

Darren415
This article was first released to Systematic Income subscribers and free trials on Oct. 27.
In this article, we catch up on Q3 results from the Business Development Company Ares Capital (NASDAQ:ARCC). ARCC is currently trading at a total dividend yield of 10.5% and a valuation of 104%.
The BDC sector continues to face a mixed environment. On the one hand, major asset classes like equities and credit continue to struggle and weigh on loan valuations and BDC NAVs. On the other hand, short-term rates have risen sharply which has provided a strong boost to net income.
Overall, ARCC investors, and BDC investors more broadly, should be heartened by the Q3 performance. Net income rose sharply, NAV fell only marginally and portfolio credit quality was broadly unchanged. This result mostly echoes our expectations that we have discussed in our BDC Weeklies over the last few weeks and why we thought BDCs could easily get a pop from their depressed valuation levels. Time will tell if the rest of the sector follows up with similarly strong results but the ARCC Q3 numbers are a great start to the earnings season.
Quarter Update
ARCC NAV fell 1.3% over the quarter – slightly more than in Q2, primarily due to unrealized losses from wider credit spreads.
Systematic Income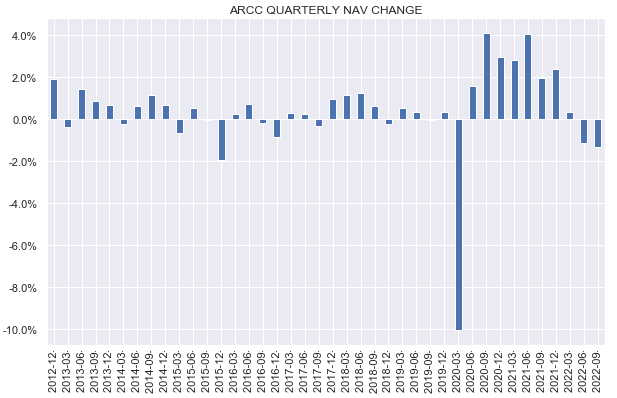
Core income (red bars) rose by 9% to $0.50 – the second quarterly gain.
Systematic Income BDC Tool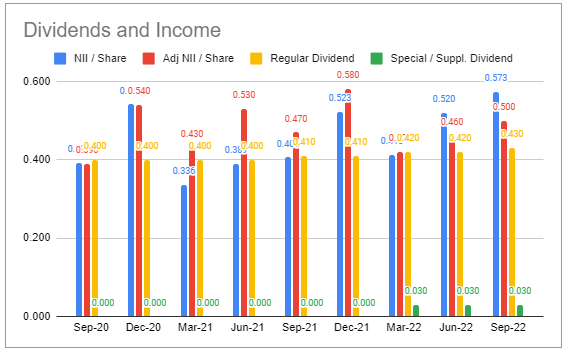
Total investment income came in at the highest level over the last couple of years despite a subdued level of prepayment fees – a feature of a weak credit market. Interest income continues to benefit from rising short-term rates after a brief dip in Q1 due to the presence of Libor floors.
Systematic Income BDC Tool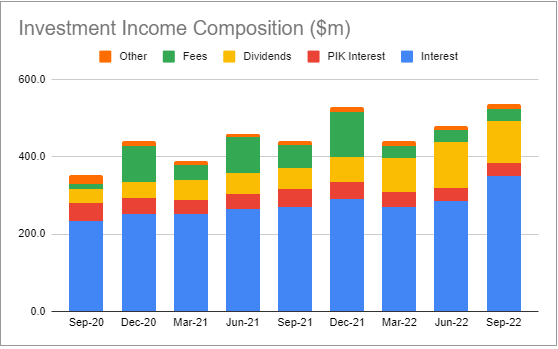
Q3 regular dividend coverage was a very healthy 116%.
Systematic Income BDC Tool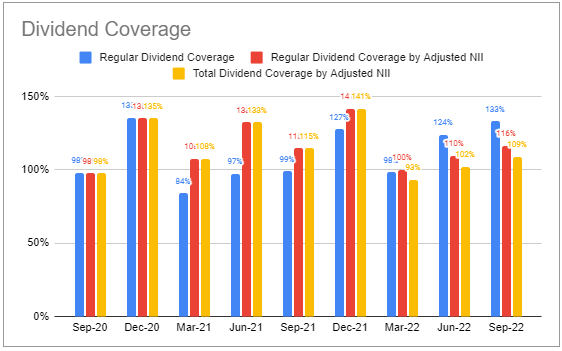
The company raised its regular dividend to $0.48 from $0.43 – the third increase this year and the largest increase in the company’s history. Based on the $0.48 dividend, Q3 coverage falls to 104%, however, this number is clearly understated as the company’s net income should continue to increase, all else equal.
If net income fully reflected the Q3-end level of Libor, it would have come in at $0.54 rather than $0.50 resulting in coverage of 112% based on the new $0.48 regular dividend.
The company previously declared a $0.03 special dividend – the fourth one in a row, reflecting its large and increasing spillover income of $1.36 per share.
Income Dynamics
In this section we highlight some of the key factors that will drive net income over the medium term.
The weighted-average yield on income-producing securities at fair-value jumped to 10.7%, primarily as a result of the rise in short-term rates. As the chart shows, some of that will be eaten away by rising debt costs (red bars) as well as potentially higher non-accruals and realized losses. The second reason for the rise in asset-side yield is the rise in credit spreads. Management have indicated that spreads are around 1% higher than the 5-year average for similarly-leveraged loans. This is due to the widening in credit spreads in publicly traded loans as well as the fact that banks, which ARCC competes with for new lending, are stepping back from new origination due to their backlog of previous issuance.
Systematic Income BDC Tool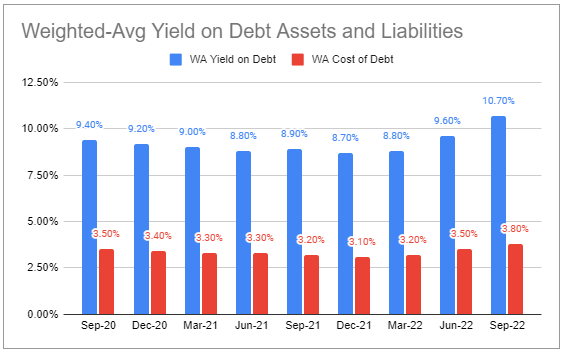
The company has a lower level of floating-rate debt in the sector but also a lower level of floating-rate debt. Over Q3 the percentage of floating-rate assets decreased marginally as did the percentage of floating-rate debt.
Systematic Income BDC Tool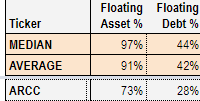
Libor has continued to rise sharply over the last quarter. It finished Q3 at 3.75% – a rise of 1.45% over the quarter. Moreover, since the end of the quarter it has risen to 4.36% as of this writing or another 0.61%. In short, rising short-term rates will continue to deliver net income gains over the following several quarters at least.
As highlighted above, management have guided that if Q3-end Libor fully fed into income, net income would have come in 8% above its actual level. Net income sensitivity to rising Libor is fairly high for ARCC as the following chart shows. We don’t expect all of this to be realized as there will be various income drags, however, it is not unreasonable to expect more mid-to-high single digit net income gains over the coming quarters.
Systematic Income BDC Tool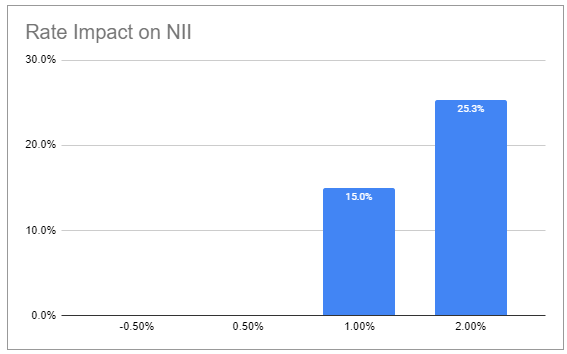
Net new investments were fairly subdued in Q3 on the back of a high level of prepayments. We expect Q4 to remain equally subdued as new origination activity level tends to fall off towards the end of the year.
Systematic Income BDC Tool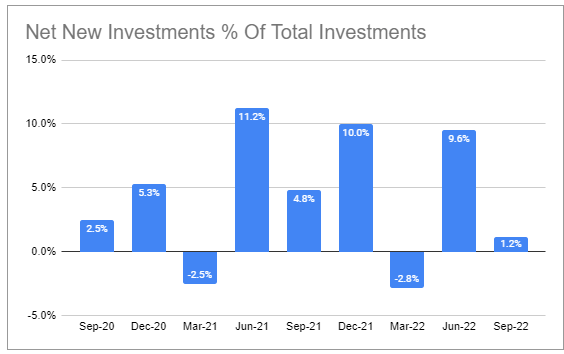
GAAP leverage remained the same as leverage net of cash ticked lower slightly to 1.24x. The leverage ratio is at the top end of the company’s range and management have expressed a desire to bring it lower. It currently stands about 0.1x above the sector average.
Systematic Income BDC Tool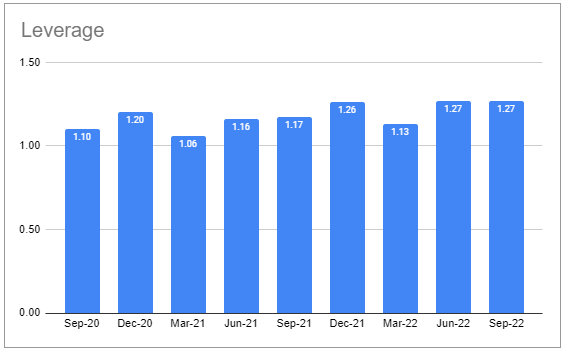
Overall, there are more tailwinds to net income than headwinds and we expect it to continue to grind higher over the next several quarters.
Portfolio Quality
Portfolio quality is holding up very well. Non-accruals were flat over the quarter. Two companies were added to non-accrual and three were removed.
Systematic Income BDC Tool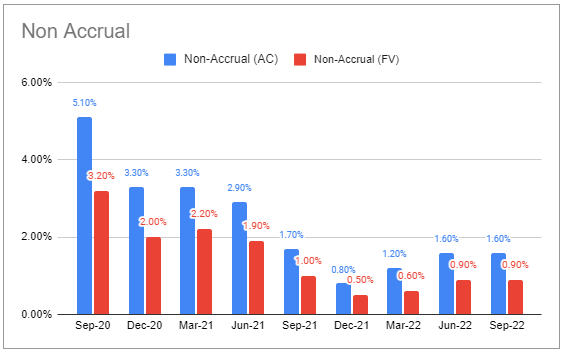
Internal portfolio quality grade was fairly flat as well.
Systematic Income BDC Tool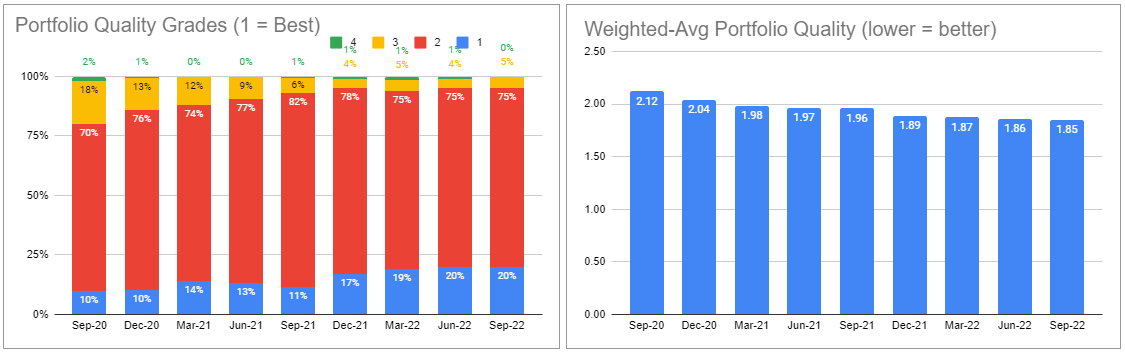
Management have indicated that the weighted-average EBITDA level of the portfolio has grown 13% year-on-year which is clearly supporting portfolio quality.
PIK income continued to move lower.
Systematic Income BDC Tool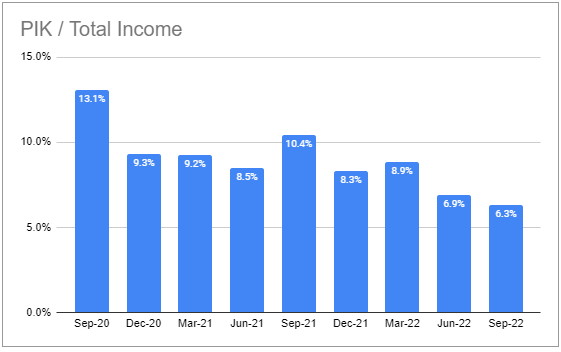
Net realized losses are running at very manageable levels.
Systematic Income BDC Tool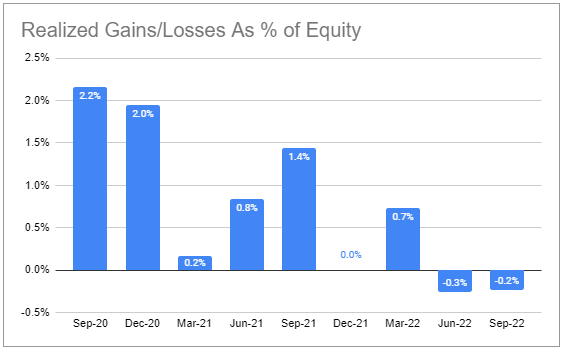
The key risk for the portfolio is that interest coverage will continue to move lower. It declined from 2.4x to 2.0x over the quarter and is set to move even lower to 1.8x according to management as short-term rates continue to rise. Management continue to view upper middle-market companies that ARCC specializes in as being better able to weather the macro downturn due to diversified revenue streams, a larger customer base and other key factors.
Valuation Profile
ARCC valuation has recently bounced twice off an unusually low level of 90%. We have highlighted the company several times in these periods as worth a look. We don’t expect the stock to reach apocalyptic levels that we saw during the GFC or the COVID period though we wouldn’t be surprised by a retracement back to a sub-100% level.
Systematic Income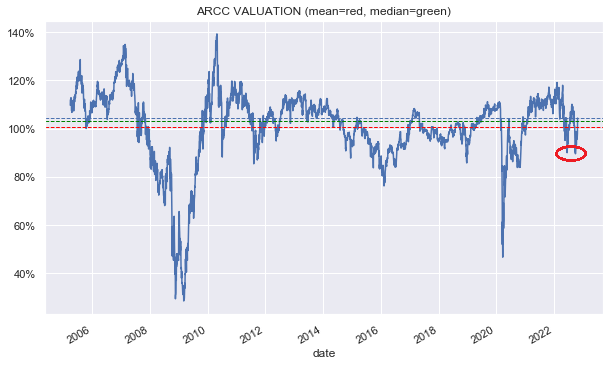
At current levels ARCC is less compelling as it’s trading around 13% above the sector average valuation and is one of the few BDCs with a valuation above 100%. We are very likely to continue to see volatility in the sector, allowing investors to pick up the stock at better levels.
Systematic Income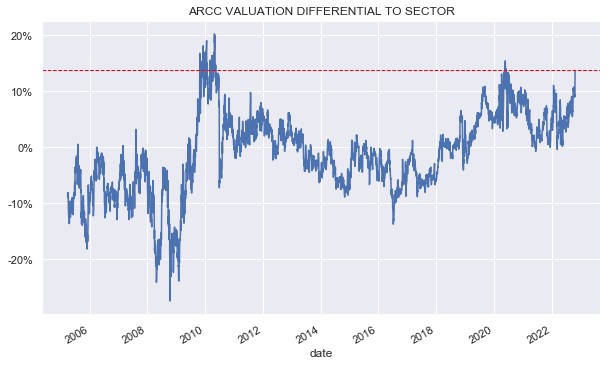
The company remains a favorite of BDC investors due to its consistent outperformance in the sector as the following charts shows so we also don’t expect its valuation to move to the sector average.
Systematic Income BDC Tool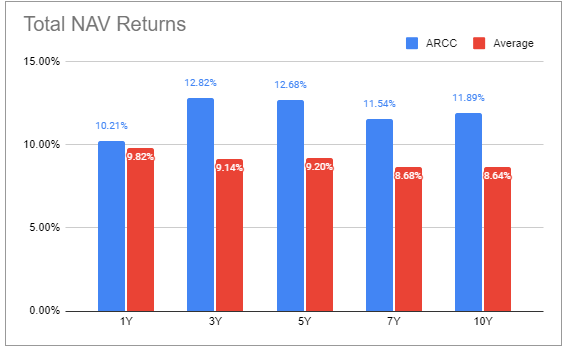
Points Of Differentiation
Besides the company’s consistent ability to deliver strong performance there is another interesting aspect of ARCC that is worth highlighting for BDC investors. This has to do with a few points of differentiation that ARCC offers relative to the sector.
First, ARCC has the largest number of portfolio companies at 458 – the average in the BDC sector is just 129. This makes its portfolio significantly more diversified than the average BDC.
Two, ARCC is focused on larger companies. In fact, the usual middle-market segment – broadly defined as $10-$150m of EBITDA is well below the ARCC landscape whose weighted average EBITDA is at $213m. This means that ARCC really targets a different kind of company than the rest of the BDC sector.
Three, ARCC has a lower first-lien profile, something which has allowed it to capture more upside in its portfolio via common equity and warrants than the average BDC, providing it with another total return angle. Its first-lien allocation is 54% versus the BDC average of 77%. This may sound like it has a “lower-quality” profile, however, it has been consistently able to perform well through various drawdown periods.
In short, ARCC provides a measure of diversification in a BDC portfolio.
Takeaways
ARCC delivered a 1.1% total NAV return over the quarter – a great result for investors and indicative of strong returns for the broader sector. Rising short-term rates, combined with stable portfolio quality, should continue to deliver growth in net income along with dividend hikes. A large spillover should also lead to further special dividends.
The BDC sector continues to face a number of challenges as leading macro indicators continue to slow. Lower interest coverage and falling economic activity should lead to an increase in non-accruals and net realized losses. That said, ARCC has been able to grow its NAV over previous downturns and we don’t expect this to change this time.
The stock’s valuation jumped on the back of its earnings results and looks fairly expensive at the moment. We are likely to continue to see market volatility over the medium term which should result in better entry points for the stock. We have highlighted ARCC twice when it traded down to a 10% discount off its Q2 NAV i.e. a price of around $17. Although we don’t expect this to happen in the near-term, investors may want to keep an eye out for a sub-$18 level for an entry position.
Be the first to comment