monsitj
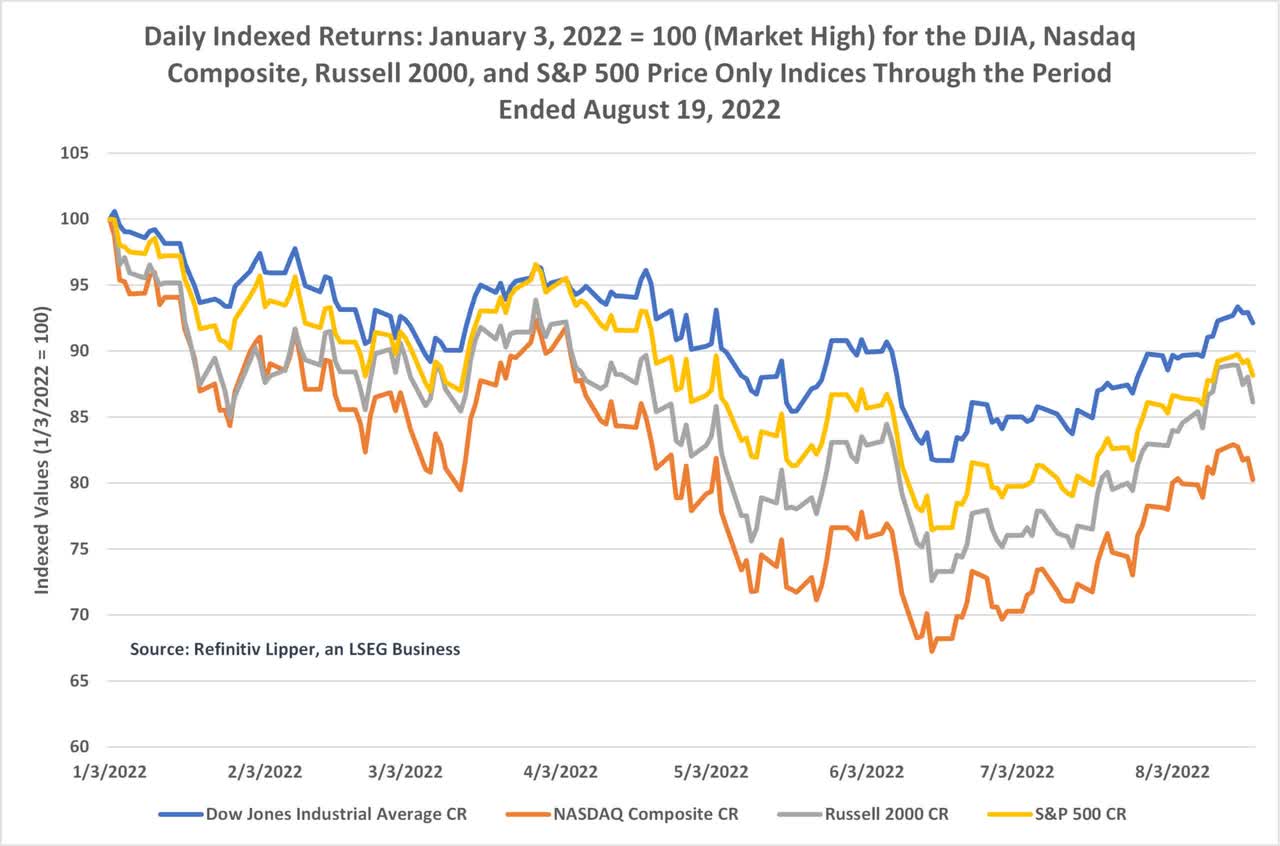
Both the Nasdaq Composite and Dow Jones Industrial Average exited bear market and market-correction territory, respectively, during the Lipper fund flows week ended August 17, 2022, with peak-to-date market losses improving to 18.28% and 7.12% from their market troughs of negative 32.76% and negative 18.30% on June 16 and 17, respectively – assuming there are no big economic or political events causing the markets to test those lows once again.

As we all are now painfully familiar with, a market correction is defined as a 10% to 20% decline in market values from a recent peak (we’re using January 3, 2022, as the common peak), while a bear market typically describes market price declines of 20% or more.
Market corrections are a regular part of the investment cycle and generally don’t last as long as many expect. They can help readjust the valuation of asset prices that have become unsustainably high. Over the long haul, the average market correction has lasted about four months.
That said, since 1974, six market corrections (including the COVID-19 pandemic crash) have turned into, generally longer-lasting, and more painful bear markets. And depending on the cause of the broad-market decline (economic crisis, geopolitical concerns, profound market bubbles, and the like), a bear market can last a few months to multiple years, with the average lasting just around a year. The COVID-19-related bear market was the shortest at 32 days, while the longest bear market was in 1930 and lasted 783 days (2.1 years).
So, the question is where are we today? No one knows. Perma bears are claiming we are just at the beginning with more pain to come, while many bulls are christening this as the end, pointing investors with a longer-term time horizon to buy selective out-of-favor issues at bargain basement values.
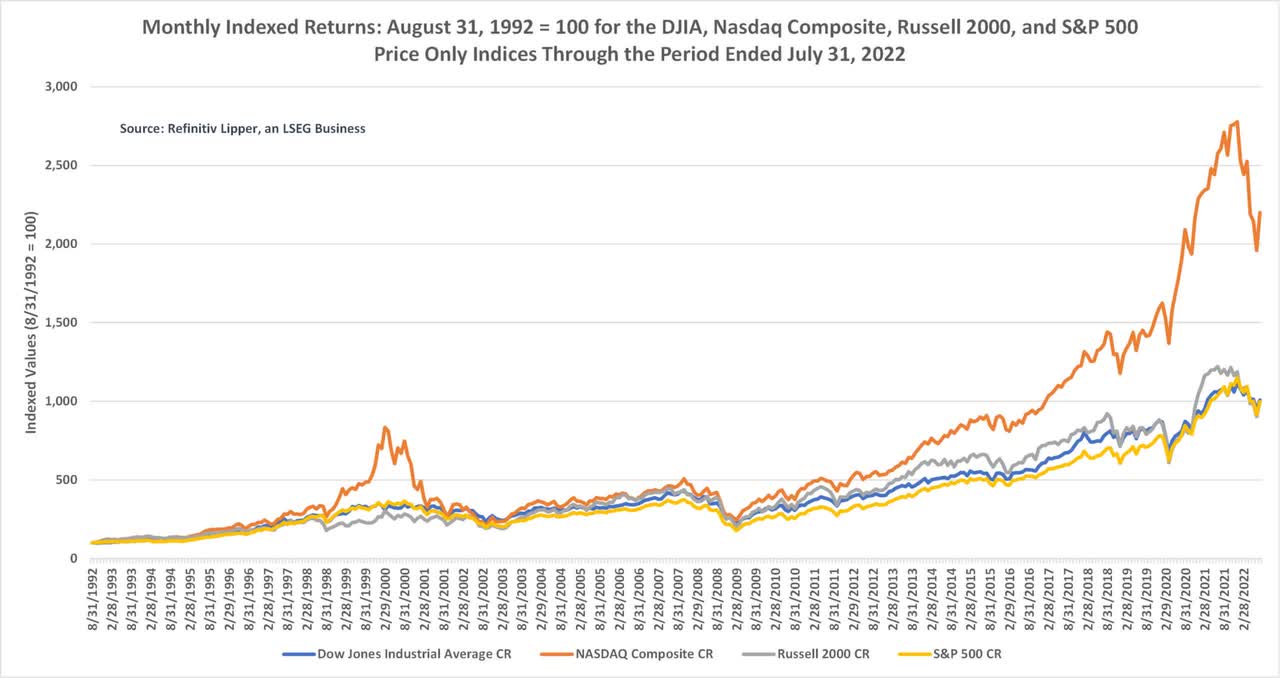
However, for most of us with long-term investment horizons and less-than-stellar market-timing skills (especially during times of market volatility), dollar-cost averaging our monthly purchases is still our best choice for wealth planning and creation, regardless of the short to intermediate outlook, given the historical returns of the market (as can be seen in the next chart).
The chart below also shows us the value of sensible asset allocation as well. It took several years for the investor that jumped into the Nasdaq on March 31, 2000, to recoup the losses seen in the tech bubble of 2000-2002. But looking over the long haul, it certainly should not have been avoided either!

Year to date, through the fund-flows week ended August 17, the mutual fund business (including ETFs) suffered net redemptions, with investors redeeming a net $317.5 billion thus far. However, it appears that investors have used the past seven months to, in some cases, reallocate a portion of their fund holdings to ETFs.
Over the same time frame, mutual fund investors (ex-ETFs) have redeemed a net $614.7 billion, with taxable bond funds (-$211.6 billion) seeing the largest net redemptions, bettered by money market funds (-$169.6 billion), equity funds (-$140.5 billion), and municipal bond funds (-$92.9 billion).
However, their ETF counterparts attracted a net $297.3 billion. Not surprising, equity ETFs (+$195.9 billion) attracted the largest draws of net new money as investors have been buying the bargain basement specials via passively managed instruments with low expense ratios and tax-efficient benefits, followed by taxable bond ETFs (+$88.0 billion) and municipal bond ETFs (+$13.4 billion).
For the Refinitiv Lipper fund-flows week ended Wednesday, August 17, 2022, a cooling of inflationary fears, better-than-expected Q2 corporate earnings, and a modest improvement in consumer sentiment pushed stocks to their longest winning streak since November 2021.
This came as investors took a risk-on approach during the fund flows week ahead of the release of the Federal Reserve’s July policy-setting meeting minutes. On Friday, August 12, the Nasdaq Composite and S&P 500 posted their fourth straight week of gains, marking their longest winning streak since November 5, 2021.
However, the fund flows trends have changed a bit from what was stated above, with investors being overall net purchasers of fund assets (including those of conventional funds and ETFs) for the first week in three, injecting a net $15.9 billion – their largest weekly net inflows since June 8, 2022, focusing a bit more on risky assets than in the recent past.
Nonetheless, the dichotomy between equity fund and ETF investors remained, with conventional equity funds handing back $4.4 billion for the week, bringing their outflows streak to 28 consecutive weeks.
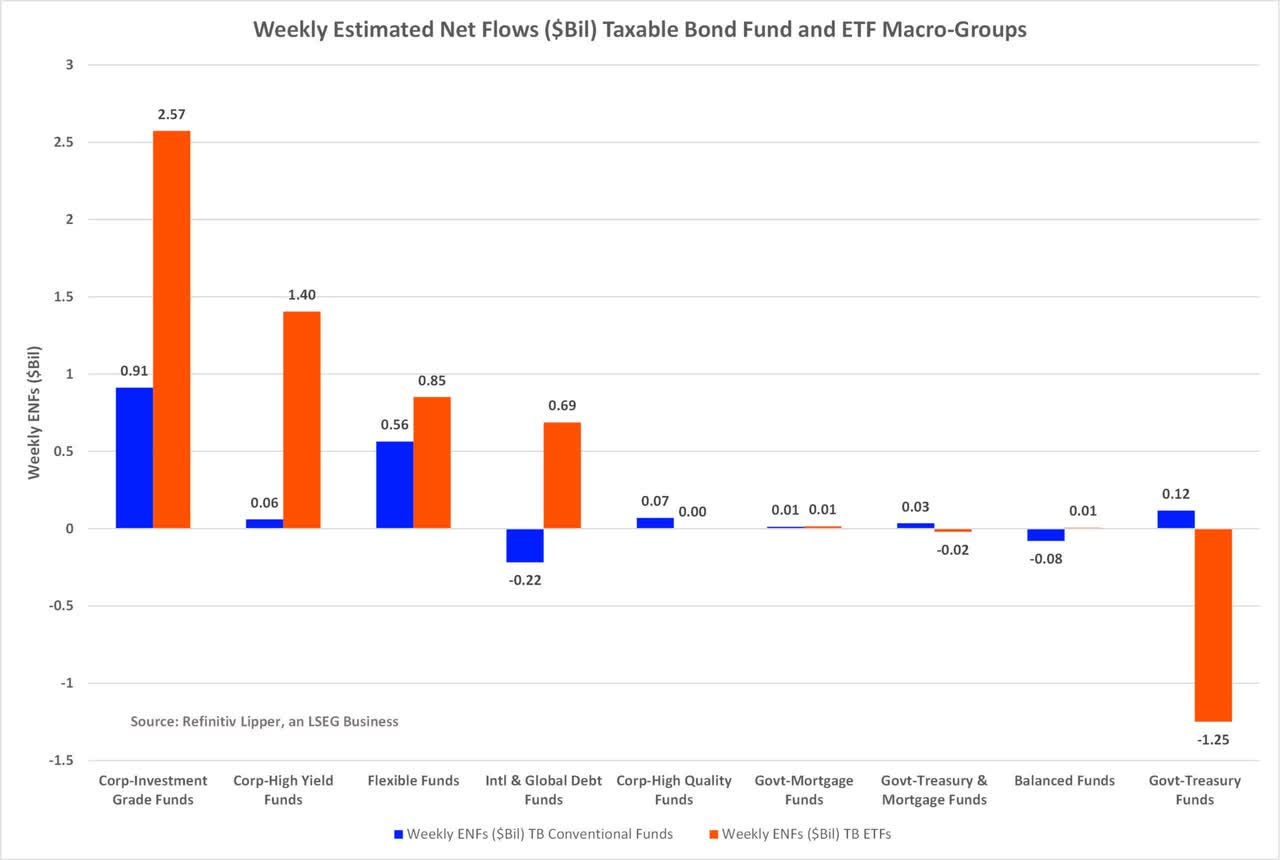
Meanwhile, their ETF counterparts attracted a net $11.8 billion, experiencing their second consecutive week of net inflows. Both conventional fund and ETF investors padded the coffers of taxable bonds, injecting $1.5 and $4.3 billion, respectively, with ETF investors being a bit more risk-seeking.

While one-week flows will not help us answer the question “are we out of the woods yet,” ETF investors were dipping their collective toes back into some of the more recently unpopular sectors. While the stalwart large-cap ETFs (+$6.8 billion) macro group attracted the largest amount of net new money this past week, small-cap ETFs (+$1.7 billion) and sector-financial banking ETFs (+$1.4 billion) took the second and third place positions.
As might be expected given investors’ continued unease with the Federal Reserve Board’s likelihood of raising interest rates a few more times this year and rising geopolitical tensions, SPDR S&P 500 ETF (SPY, +$1.4 billion) and iShares Core S&P 500 ETF (IVV, +$1.2 billion) attracted the largest amounts of net new money of all individual equity ETFs, but following close in their footsteps, Invesco S&P 500 Low Volatility ETF (SPLV, +$1.2 billion), Financial Select Sector SPDR ETF (XLF, +$1.0 billion), and iShares Russell 2000 ETF (IWM, +$840 million) also jumped to the top of the leaderboard this past week as some investors became a bit more aggressive.
Editor’s Note: The summary bullets for this article were chosen by Seeking Alpha editors.


Be the first to comment