

KanawatTH
Consumer spending and employment are two of the major immediate harbingers of recession
Several important coincident indicators that I track weekly as part of my survey of high-frequency data have decelerated sharply in the past several months. In this article, I am taking a closer look.
Consumer spending
Let me start with consumer spending, because as I always reiterate, consumption leads employment.
Each week I publish an update of consumer spending as measured by Redbook (there used to be several others, including Gallup and ShopperTrak, but they have ceased publication of those statistics). Redbook has some methodological quirks, but it captures the trend in retail spending nicely.
In the past several months, the nominal YoY% change in spending as measured by Redbook has decelerated sharply. Here is the graph of the past 12 months of YoY% changes:
Redbook consumer spending (TradingEconomics.com)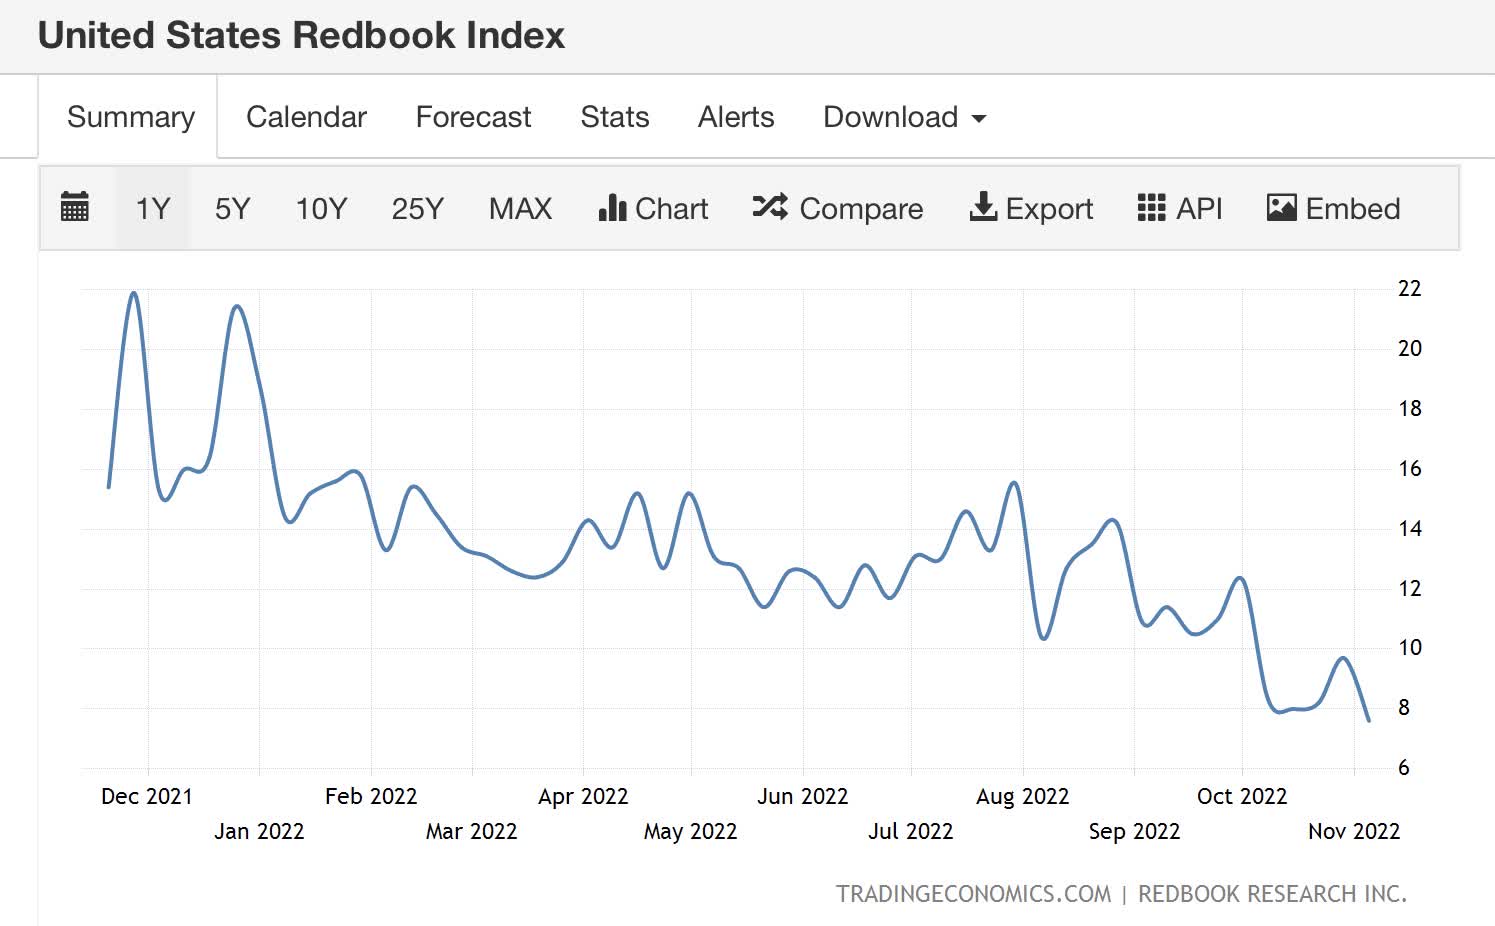
Note the decline started in September, and intensified in October and further this month so far.
Let’s compare that with the Census Bureau’s monthly report on retail spending, also measured nominally. The last report was for September; October will be reported on Wednesday:
Nominal retail spending YoY (FRED)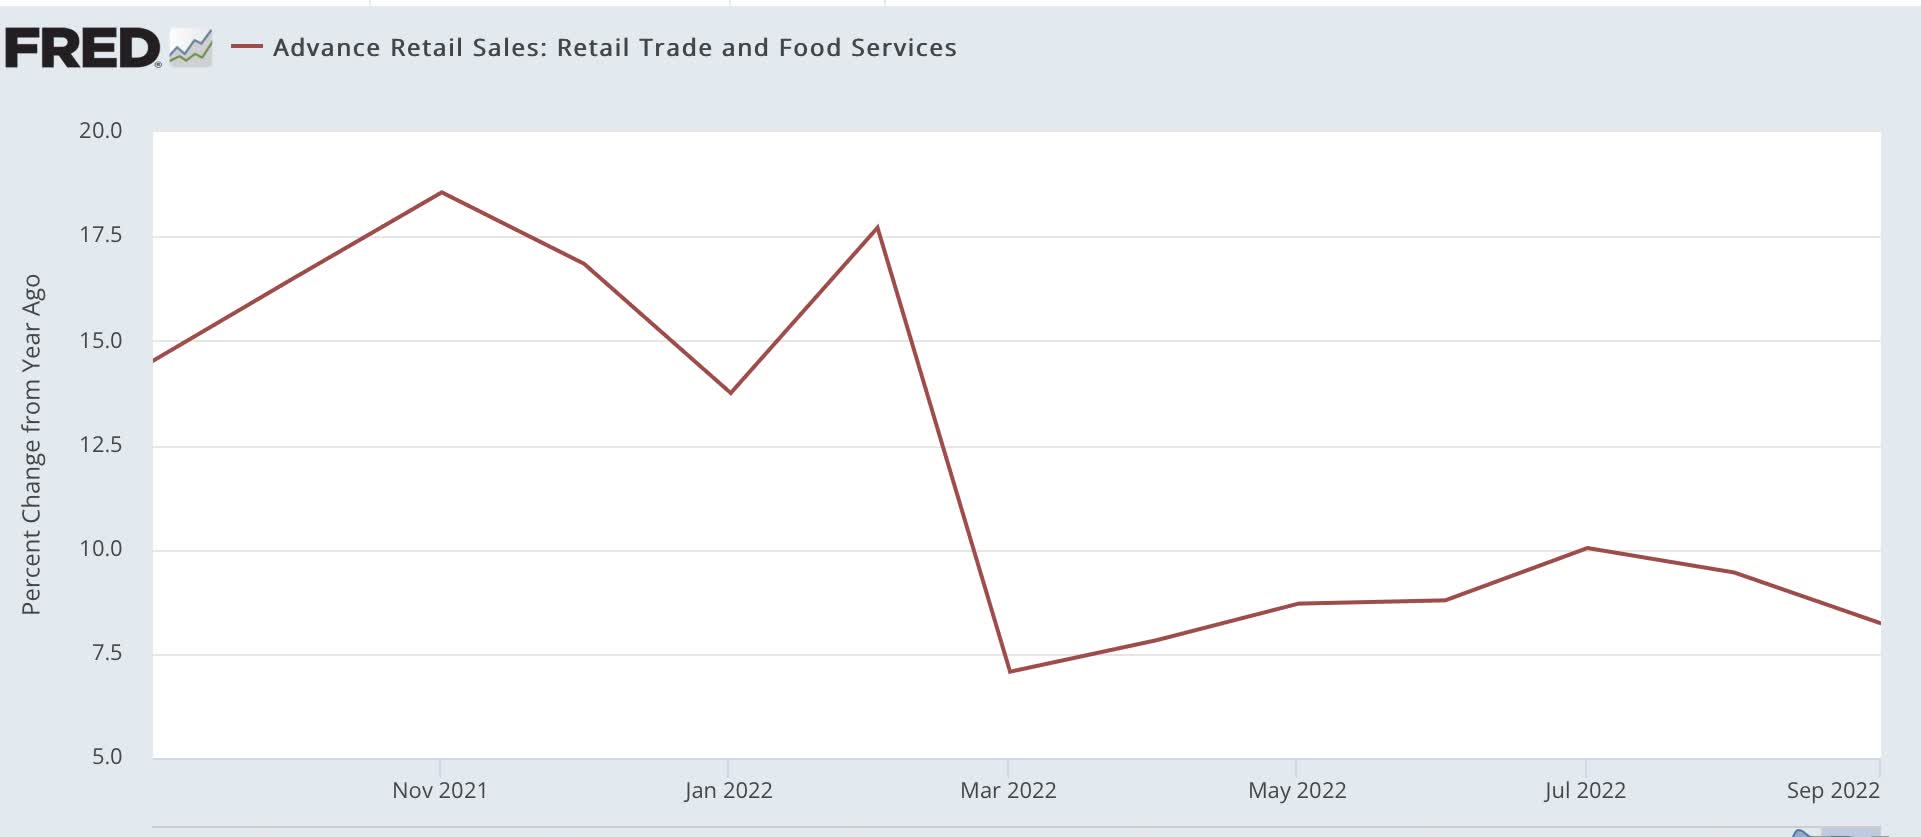
The two graphs follow the same pattern, although the Census Bureau data may lag by a month (although Redbook’s YoY comparisons have generally been several % better than the official Census Bureau report). Both show sharp YoY increases through January, major declines by March, a slow recovery through July, and then deterioration into September.
If retail sales for October follow Redbook’s pattern, I would expect significant deterioration in nominal terms in Wednesday’s report. And keep in mind that the above comparison does not adjust for inflation, which has been running at above 6% all year. Also that, when real inflation adjusted retail sales have turned negative YoY, that has almost always signaled a recession is coming in short order.
Employment
Turning to employment, one leading indicator has historically been temporary jobs. I keep track of that weekly via the American Staffing Association’s Staffing Index. Here’s what that looks like last year, this year so far, and also 2019, the last year just before the pandemic (which was a very weak, nearly recessionary year):
Temporary staffing (American Staffing Association)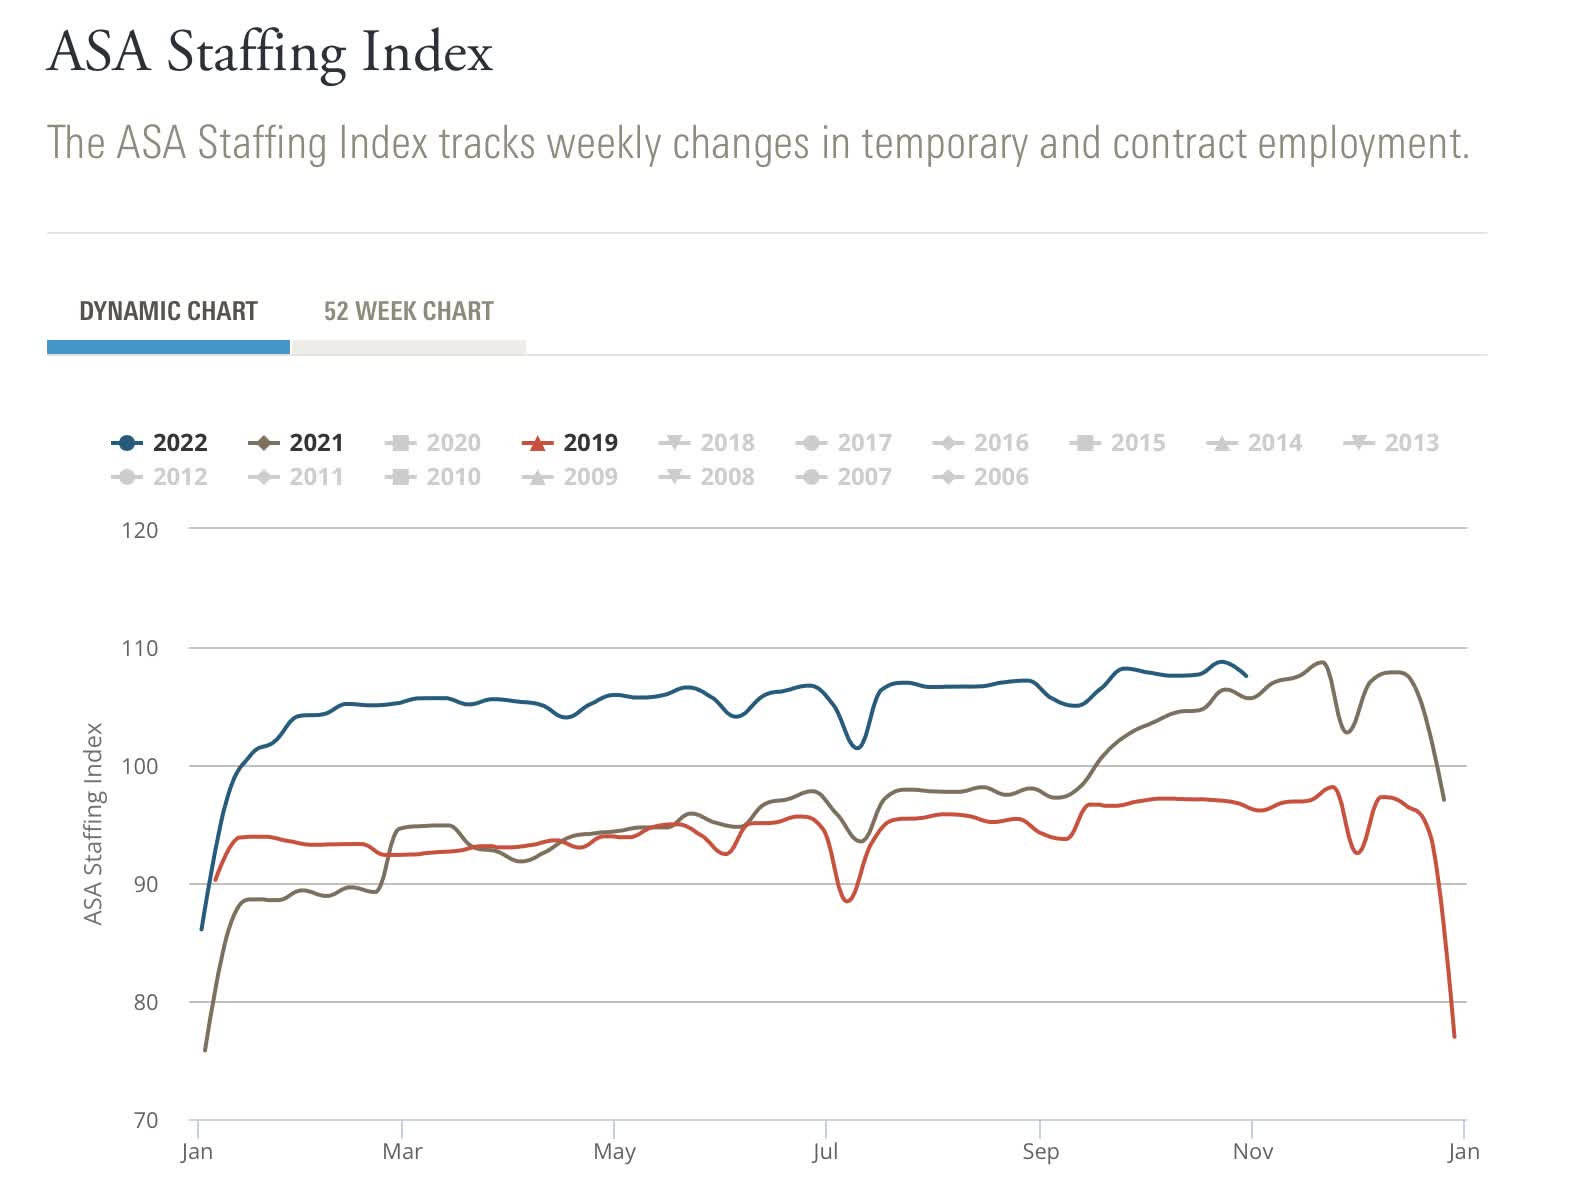
The YoY% gains in temporary jobs have also deteriorated sharply beginning in September. They are still positive, but if current trends hold that could change in a week or two.
And here is the YoY% change through October in the official Jobs report series:
Temporary help jobs (FRED)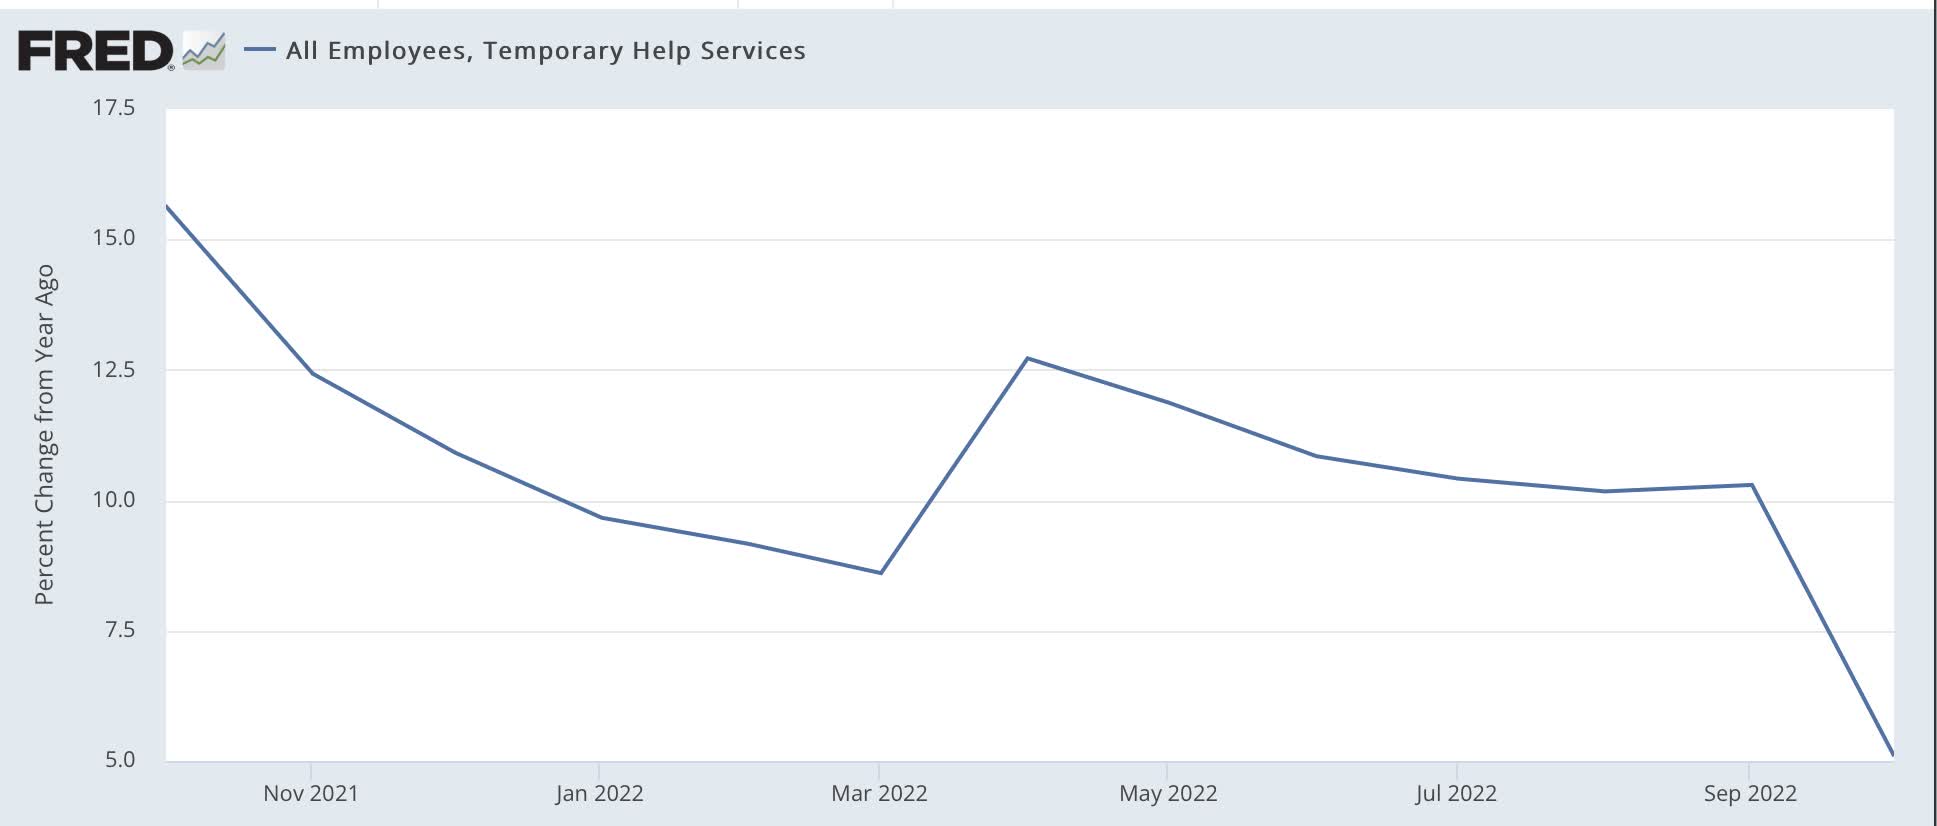
There was a very big spike in temporary jobs in October 2021, so the big decrease this past month in the YoY% change may be passing. But I would not be surprised at all to see a general trend of deceleration continue in next month’s report.
Finally, every week I also post an update on the YoY% change in payroll tax withholding, measured over the prior 20 reporting days in each year (in order to smooth out the daily noise). The point is that *all* employees’ paychecks should have payroll tax withheld, so the total tax withheld should tell you how much in the aggregate the lion’s share of employees are making in salary or wages (not all, because roughly the top 15% of all workers have compensation exceeding that cap).
Before I show you that, Matt Trivisonno has published a “Daily Jobs Update” comparing the YoY% change in tax withholding over the entire prior 365-day period. His public page includes the data with a 3-month delay. Here’s his graph through August 10 of this year:
YoY payroll tax withholding (Dailyjobsupdate.com)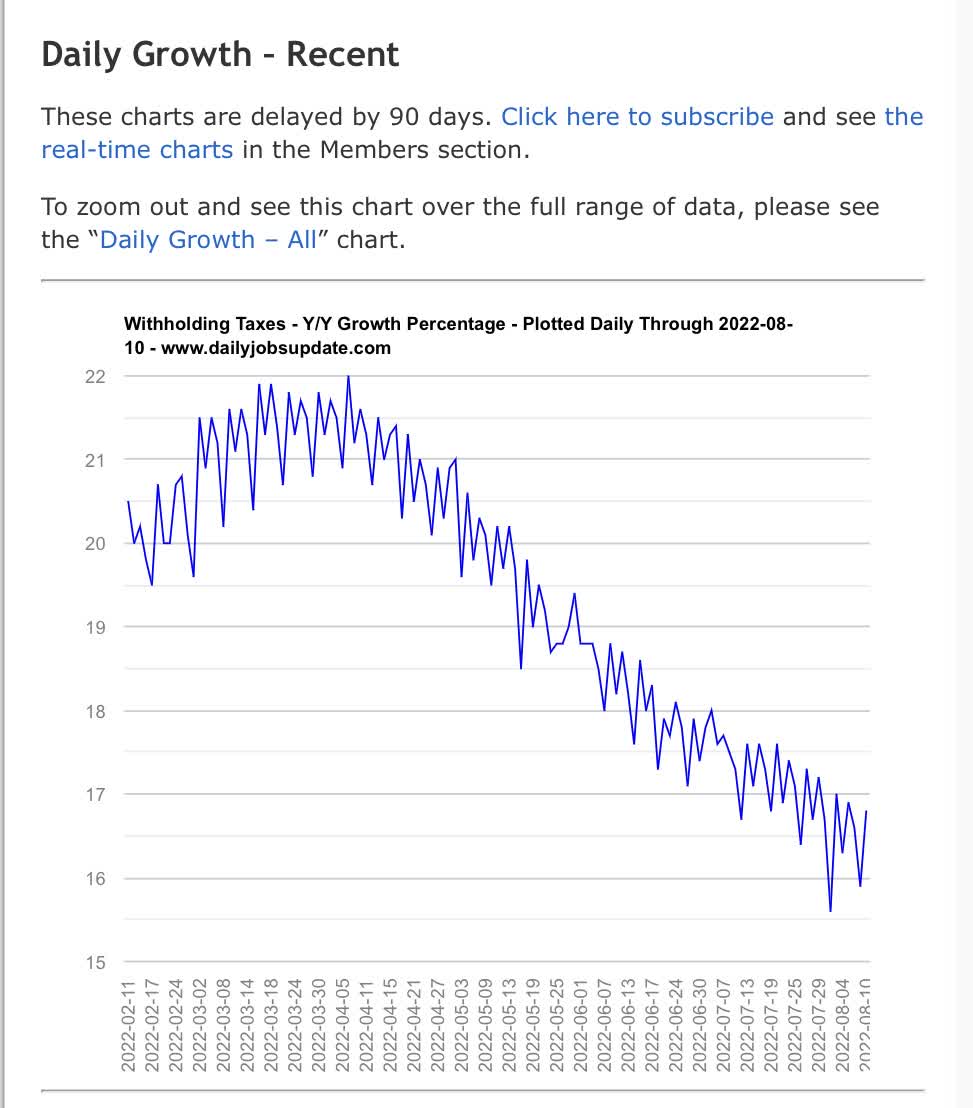
Note the steady decline since March. If the trend from then through August were to be continued into the beginning of next year, then the YoY% change would decline by more than 50%, which is my rule of thumb for when the absolute numbers (vs. the YoY trend) have actually turned negative.
With that intro, here is what the YoY% change in the 20-day total has been in tax withholding as I have reported it in the first week of each month this year:
- Jan +9.3%
- Feb +11.6%
- Mar +13.4%
- Apr +12.6%
- May +3.6%
- June +20.7%
- July +7.8%
- Aug -3.4%
- Sept +1.7%
- Oct +3.6%
With the exception of the May/June anomaly, the trend tracks pretty close with Matt Trivisonno’s similar report. But again, note the comparisons fall off the proverbial cliff beginning in August. Since then, any given 20-day average has barely exceeded 5% at best.
And that is without taking into account inflation. According to the tax withholding data, aggregate payroll tax withholding in *real* terms has gone negative in the past 3 months, which is different than the “real aggregate payrolls” data derived from the establishment survey.
Since the former is a true number, not just a survey, it suggests that there may be major downward revisions to the last few monthly jobs numbers in coming months.
Conclusion
Put the above data together, and it suggests that the crucial consumer and employment sectors of the economy may have downshifted close to turning negative since late summer – which is most important because it means actual job and income losses to average middle and working class Americans. But we just don’t know yet, because the monthly data hasn’t caught up.
Be the first to comment