

HeliRy
Investment Thesis
Ardmore Shipping Corporation (NYSE:ASC) is a global cargo shipper focusing on energy and chemical products. This company is based out of Ireland and has a long history of shipping experience.
This stock price had a strong performance over the last few weeks. Despite being a small company, this stock performance has been firm, which cannot be ignored in the market in which they participate. This article will showcase the various types of market analysis which point up over the next few months.
Positive News Helps Build Catalysts
One can get better insight from this article to understand what kind of product ACS focuses on.
Ardmore ships mostly chemicals and oil.
More stock analysts have piled on strong buys, as hinted here.
There is mention of institutional capital firms that have identified this stock as a perfect buy, as this article explains. Now is the ideal time to dip in, as hinted in the Fibonacci section of this article. It also appears this stock uptrend could last until Q1 and even Q2 of 2023.
Even Nasdaq highlighted this stock at the end of Sept.
Fundamental Data Show Trend Value
Ratios
All significant fundamental strengthening growth over the last five years. Enterprise value multiple was the strongest in the previous year. As a result, one should see this growing company over the last five years considering there has been slow growth in global economies, but this shipping company powered through a brutal global market during the pandemic.
|
2017 |
2018 |
2019 |
2020 |
2021 |
|
|
Period |
FY |
FY |
FY |
FY |
FY |
|
Current ratio |
1.440 |
1.449 |
1.622 |
1.630 |
1.611 |
|
Quick ratio |
1.145 |
1.127 |
1.354 |
1.211 |
1.295 |
|
Cash ratio |
0.677 |
0.753 |
0.856 |
0.928 |
0.948 |
|
Operating profit margin |
0.043 |
-0.046 |
0.071 |
0.085 |
-0.104 |
|
Price book value ratio |
0.628 |
0.530 |
0.655 |
0.332 |
0.340 |
|
Enterprise value multiple |
15.130 |
25.255 |
11.486 |
6.503 |
36.375 |
Source: Financial Modelling Prep
Estimates
Due to the smaller market cap value of this stock, guidance can only be measured over the next two years. One significant highlight to be taken away from this is declining debt, which is rare in this global economic malaise. This helps hedge against losses over the remainder of 2022 and 2023 but notes the future declines.
However, with this good news, there is some concern about lowering revenue and profit. Most of this shipping fleet are oil and chemical tankers, which would help determine the reason for declining long-term revenues. As oil production falls, so will supportive industries, including shipping tankers.
|
YEARLY ESTIMATES |
2022 |
2023 |
2024 |
|
Revenue |
256 |
187 |
178 |
|
EPS |
3.02 |
1.26 |
1.32 |
|
P/E Ratio |
3.19 |
7.67 |
7.31 |
|
EBIT |
122 |
54 |
52 |
|
EBITDA |
161 |
94 |
90 |
|
Net Profit |
100 |
40 |
42 |
|
Net Profit Adjusted |
112 |
55 |
73 |
|
Pre-Tax Profit |
104 |
25 |
48 |
|
EPS (GAAP) |
2.64 |
1.20 |
1.56 |
|
Cash Flow from Investing |
25 |
-4 |
-4 |
|
Cash Flow from Operations |
110 |
75 |
87 |
|
Cash Flow from Financing |
-56 |
-51 |
-149 |
|
Cash Flow per Share |
3.73 |
2.01 |
2.45 |
|
Free Cash Flow |
118 |
48 |
72 |
|
Free Cash Flow per Share |
2.97 |
1.79 |
– |
|
Book Value per Share |
13.25 |
13.97 |
15.38 |
|
Net Debt |
195 |
147 |
74 |
|
Shareholder’s Equity |
422 |
466 |
521 |
|
Total Assets |
792 |
803 |
682 |
Source: BusinessInsider
Technical Analysis
Fibonacci
One benefit of the Fibonacci trend line in orange indicates when it is a wise time to enter the market for new positions. It seems the current yellow stock price line is approaching this phase. One must question if this is the tail end of the stock price uptrend. Based on fundamentals and other noted factors, this could last into the first half of 2023.
fibonacci for ACS (custom platform)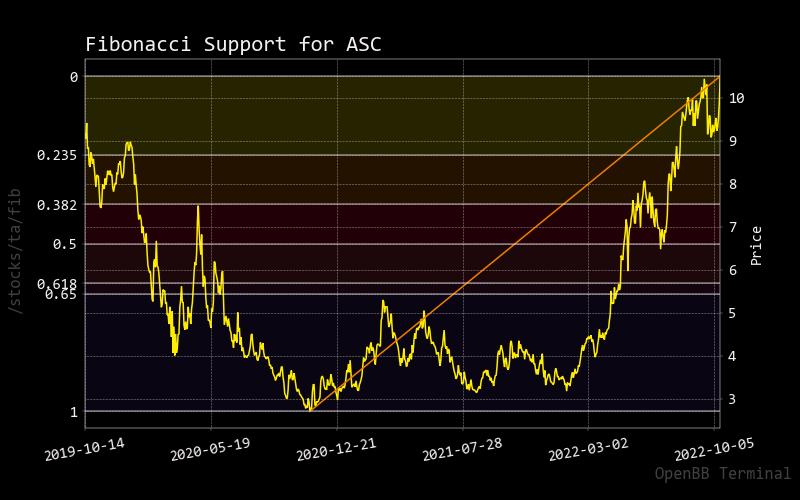
Bollinger Bands
As the stock price approaches the upper Bollinger Band, it is apparent that momentum has sped up due to the value of this stock. As more analysts and early investors find out about this stock, you could easily ride the stock price up due to the usual frenzy of fear of missing out.
asc Bollinger bands (Customer platform)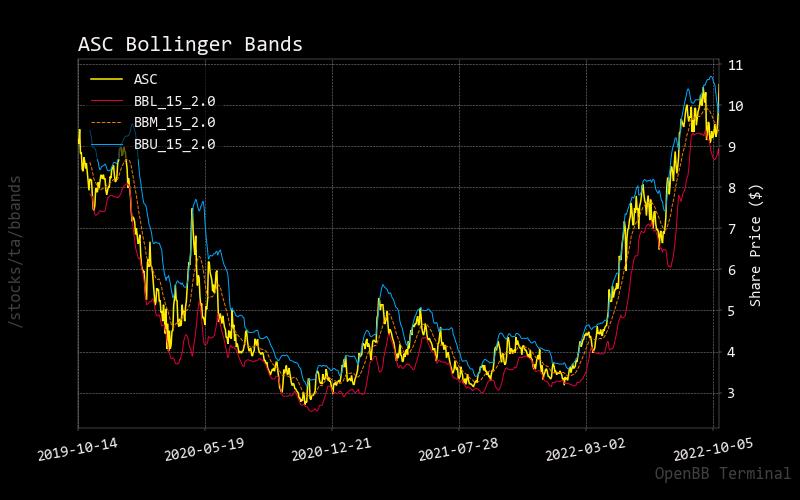
RSI
As the stock price pushes through the oversold condition of the relative strength indicator. This would concern an investor, but this analysis overlays other types of research to confirm potential uptrend probability. For day traders, this might be the tail end of this move. This could be a long-term trend for buy-and-hold investors that could last 6-8 months, as explained in this article.
ASC RSI (Custom platform)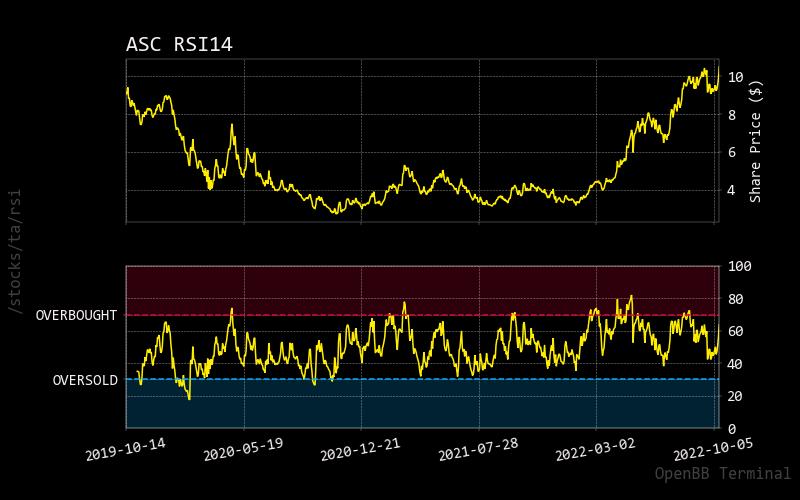
Prediction Via AI
Monte Carlo
There are two takeaways from this chart. First, the upward projections from the Monte Carlo simulations show various pricing paths on a predictive basis. Either way, you choose, it shows that most are pointing up overall.
As for the statistical distribution of probability for uptrends in stock price, you can see that it is weighted much higher than the last current stock price. Also, with this time of price momentum, you can see extreme right tails to show significant potential uptrends in price.
Both diagrams and other charts and analysis styles show extreme potential for sustainable upward pricing moves.
Monte Carlo simulation ACS (Customer policy)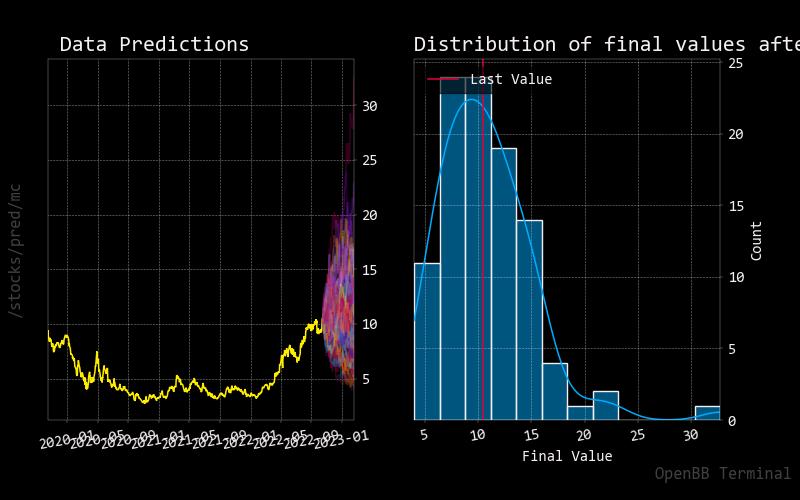
Regression
This red line shows an upward solid price trend over the next 30 days. Just holding this stock as the Fibonacci trend line confirms timing, it might be safe to say that this opportunity could be a highly profitable decision.
Regression for ACS (Custom platform )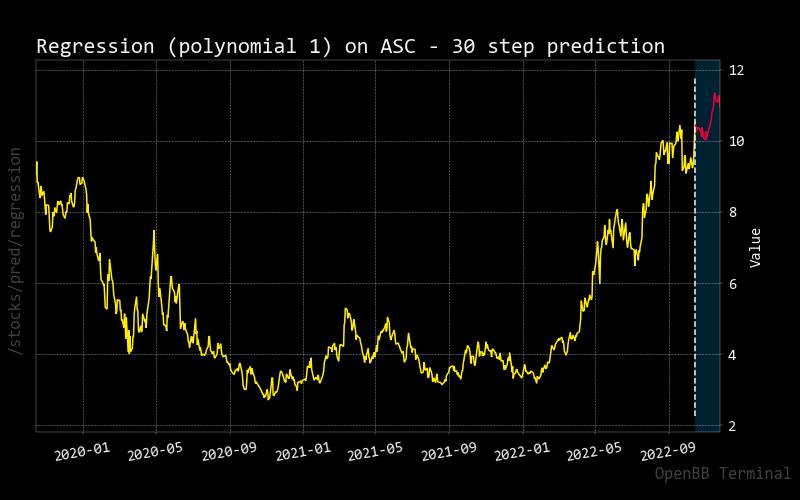
Risks Not But Minimal
Target Price Vs. Current Stock Price
There are not many stock analysts setting price targets for this company, yet the current stock price is reaching this upper target. With this latest stock performance, I have never seen a short-term strength as I have seen in the last few weeks.
Target vs Short (Custom platform)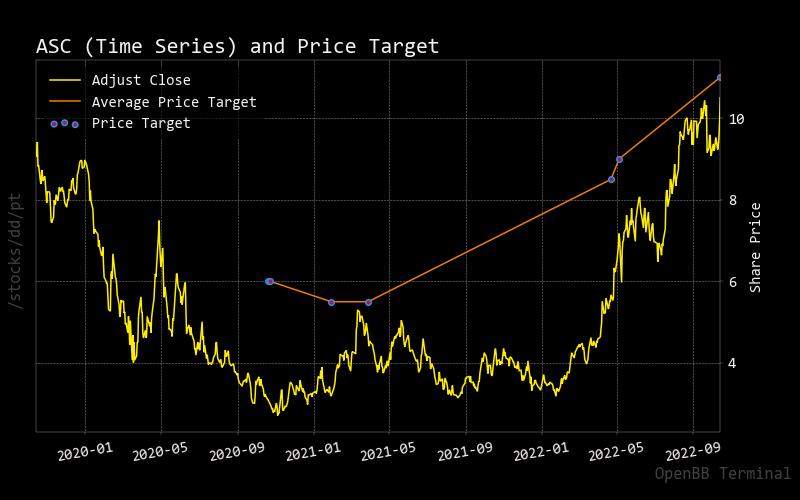
Analyst Recommendations
There are overwhelming and strong buys over neutral or sell calls. This is across all significant periods of 1 month, one week, and even one day.
|
Interval |
RECOMMENDATION |
BUY |
SELL |
NEUTRAL |
|
One month |
STRONG_BUY |
16 |
0 |
10 |
|
One week |
BUY |
15 |
1 |
10 |
|
One day |
BUY |
15 |
2 |
9 |
Source: Trading View
Price Vs. Short Volume
It seems the short volume is relatively low compared to the total volume. As this stock starts to accumulate, you might see the price rise, and the fast might grow as there is doubt of how long this company can sustain that stock price over the long term-judging from the fundamentals, one could expect that to occur in the second half of next year.
Price vs Short ASC (Custom platform) StockGrid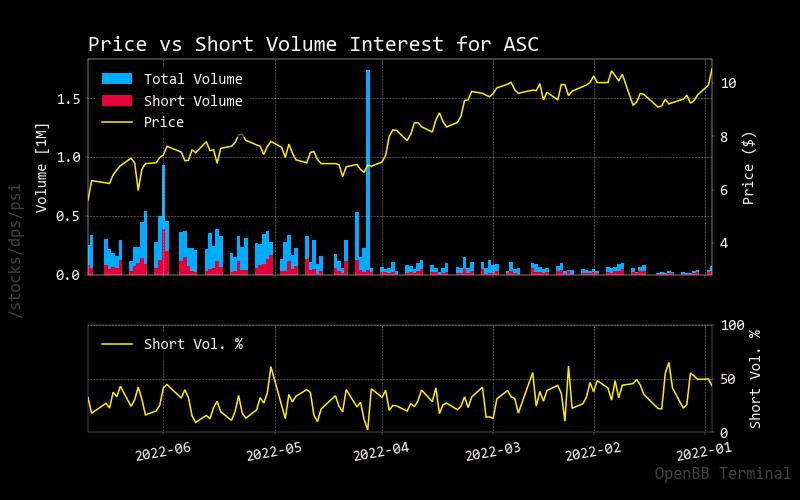
Conclusion For Strength
Overall, this is a rare stock showing a solid uptrend in an uncertain market. As all significant analysis show, this stock should be rated a rare strong buy. This rating could change at the end of the year or sometime in Q1 of 2023.
Editor’s Note: This article was submitted as part of Seeking Alpha’s Top Ex-US Stock Pick competition, which runs through November 7. This competition is open to all users and contributors; click here to find out more and submit your article today!
Be the first to comment