

nightman1965
Ardmore Shipping Corporation (NYSE:ASC) presents itself in 2023 with an excellent balance sheet.
Revenue and profitability margins have reached their highest levels in 10 years thanks also to favorable market conditions. Company debt has also reached its lowest level in the last decade and this sets the stage for any future market turbulence. Market demand seems to be able to hold up for next year while supply is looking for support (including regulatory) to find a way to grow. The company has also declared a dividend that could reach a double-digit yield.
The greatest risk could be that relating to spot rates and the Baltic Dirty Tanker Index is showing a decline right at the beginning of 2023. Ultimately, a very interesting share price evaluation lays the foundations for a risk/return ratio that is positive in my opinion. My rate is Buy.
Company Overview
Ardmore Shipping is involved in the oil and gas and petroleum products seaborne transportation. The fleet is based on 30 mid-size vessels in full operation. The fleet is quite modern and fuel-efficient with about 8.4 years old on average.
The Company’s headquarter is based in Bermuda, began the activity in 2010, and was effective in the Marshall Islands since 2013. Ardmore Shipping owns 79 subsidiaries, each representing a single ship-owning company for the fleet.
The business strategy is focused on mid-size products and chemical tankers. The fleet size is positioned in the average of the global fleet for products and chemical tankers. This strategic approach is based on mainstream tanker sizes and guarantees wide flexibility of use in the relevant global market. The fleet could be defined as modern and quality-vessels were built in Japan or South Korea.
Ardmore Shipping is also investing in optimizing fuel efficiency through modern electronic devices and this is in line with the shipping industry trend.
Other three main pillars underline the company philosophy:
- Commercial independence is based on an in-house skilled team that can guarantee a good customer service level and a high degree of operational flexibility.
- The low-cost organization can ensure effective management of operational expenses and overhead
- Slow and steady revenue growth with a very balanced and disciplined capital allocation
Product and Chemical Tanker Market trend
Potential new sea routes
The Europe War (Russia-Ukraine) is a source of high instability in supply and demand which sees larger and more persistent reorders of global products. Europe is probably also obliged to replace Russian refined oil in 2023 due to the EU oil embargo. This great geopolitical instability could represent an epochal strategic change in the maritime routes for the supply of refined oil in Europe. According to Clarksons, these new routes could lead to a potential 7-8% increase in tanker tonne miles.
Inventories
According to IEA Oil Market Report:
Global observed inventories fell by 23.2 Mb in October as product stocks fell for the first time since March and crude oil saw a smaller build. OECD industry stocks increased by 17.3 Mb, to 2 765 Mb, narrowing the deficit versus the five-year average to 150.2 Mb, but OECD government stocks fell by 19.9 Mb. Preliminary data for the US, Europe, and Japan show industry stocks increased by 3.1 Mb in November.
This means that inventories are low mainly in Europe, which probably requires Europe to import more
Possibility to maintain high rates
According to Anthony Gurnee (Ardmore CEO)
even at today’s elevated freight levels, shipping costs remain well under 10% of the underlying cargo value that we transport, creating substantial headroom for further rate increases without the risk of demand destruction.
This underlines that, at the moment and from an insider point of view, the global market for the transported product is not so tense as to foresee a deterioration of the shipping rates.
Demand and Supply
According to IEA Oil Market Report the Global Oil Demand will increase up to 101.3 Million Barrels/Day from 100 mb/d recorded in Q3-22. Also the forecast for the next years up to 2026 says that there could be an increase of about 0.9 mb/d in the annual average.
ASC Earnings Presentation Third Quarter 2022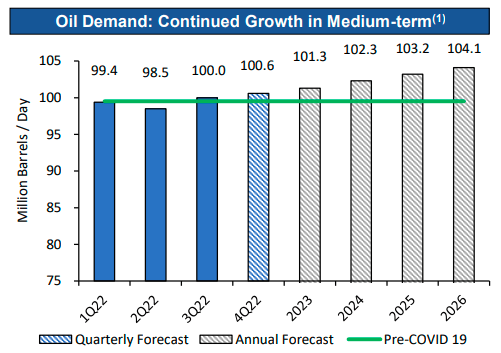
The demand for ton-miles is also driven by the discussed new trade caused by the Russian-Ukraine war with the new capacity required for the export from Asia and the Middle East.
Also, Chemical tanker demand is growing as a consequence of China’s economic recovery with new plants opening in Asia.
According to MSI, Chemical Tanker Report 2022 the Chemical tanker demand is expected to grow 5.1% yearly (more than the oil demand)
ASC Earnings Presentation Third Quarter 2022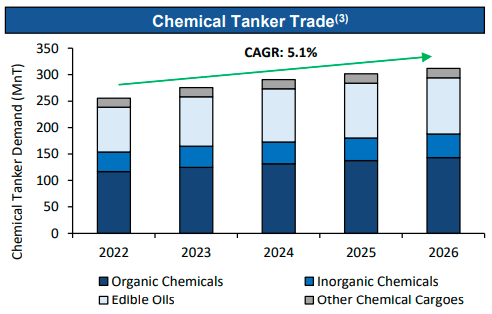
Related to the global product and chemical tankers fleet it is esteemed to grow at a low level with order books at 5% of the existing fleet. The rate is less than the very old global fleet with more than 20 years of life (equal to 8.5% for the product tanker and 13.1% for the chemical tanker). Another aspect that is limiting new orders concerns the regulatory framework where greater clarity is expected regarding emissions and the technology required for propulsion.
Why Ardmore could be the right choice
Revenue and profitability
Seeking Alpha + Author Graph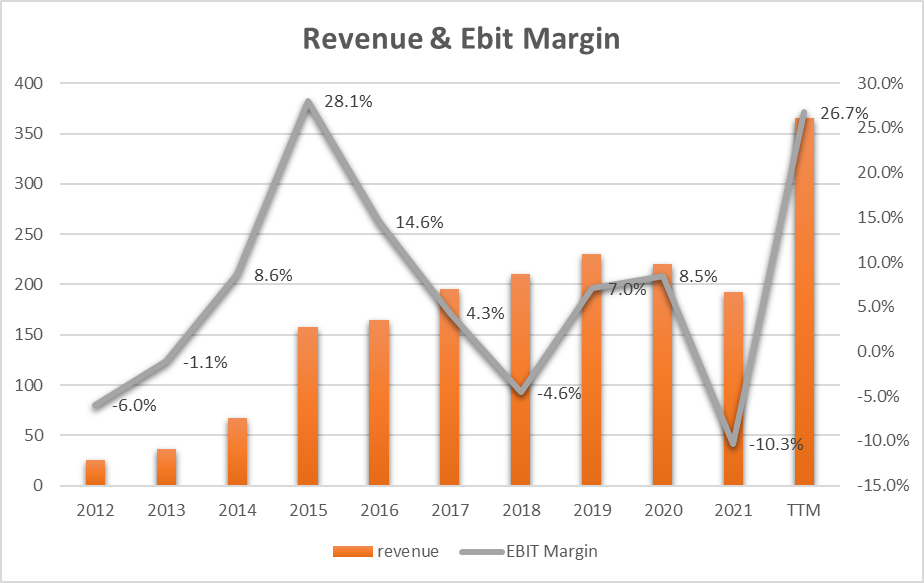
The revenue growth rate has been 30.7% [CAGR] in the last 10 years and this is mainly due to 2022 where following the favorable market and rates conditions the company has been able to almost double the turnover compared to the last year. However, the most interesting thing is the profitability recorded in 2022 with a 26.7% EBIT Margin. Only 2015 saw similarly favorable conditions in the last 10 years.
The graph shows how the business is cyclical with long-term ten-year waves. The positive tariff conditions occurred about 7 years ago and in the intermediate periods, the margins reached negative records of even -10% (2021). This could also mean that in the next periods, we can expect a new decline in the market conditions and consequently in company profitability.
Free Cash Flow and Dividend
Seeking Alpha + Author Graph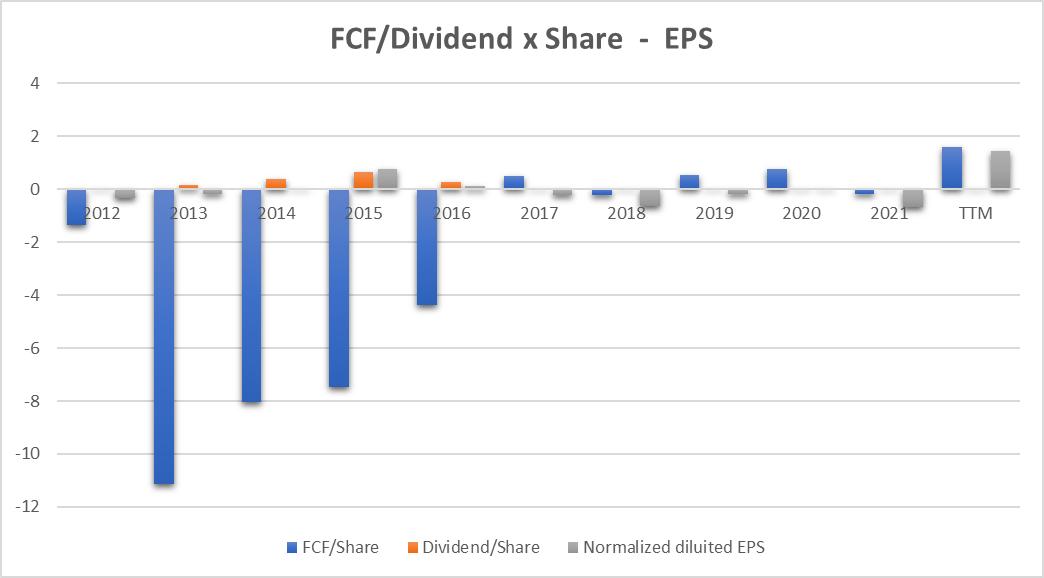
The blue bars represent the trend of the Free Cash Flow which is growing from negative peaks in the years from 2013 to 2016 to settle at the maximum level of 2022 ($1.61). Until 2016 the company invested heavily in building its business assets and this is the reason why the Free Cash flow is in heavily negative territory. From 2017 onwards, Ardmore managed its assets and maintained a level of CapEx reduced to strictly operational needs, bringing the cash flow positive.
The trend is particularly interesting as it defines and implies a specific corporate strategy in the use of Capital: past investments have been settled and have defined a balanced revenue growth. There have been no other heavy investments and neither are there any plans to make them as we can hear from the last earnings call:
So I think the first thing is that as we continue to build liquidity, pay down debt, reduce our breakevens, build more substance in the company, I think it actually does improve the quality of the dividend — prospective dividends going forward.
Whether that’s M&A or single ship acquisitions or block acquisitions, will remain to be seen.
The company is very careful about the use of capital. Strategically large investments have been made and have allowed for great growth. The future strategy is to continue to invest to optimize and make the fleet more efficient in the chemicals and refined products market without major M&A pretensions. We can also state that in recent years this strategy has brought positive results in terms of the solidity of the balance sheet data.
The years from 2013 to 2016 also saw the distribution of a dividend (orange bars) and this is in line with the trend of the margin curve. Since 2017, the dividend has been canceled and in fact, the margin has decreased. In Q4 2022 the dividend was announced again (probably with double-digit yields):
Consistent with the company’s capital allocation policy, we are pleased to announce the initiation of a quarterly cash dividend with effect from the fourth quarter. The dividend payment will be 1/3 of adjusted earnings, so that if the fourth quarter continues at similar levels to what we so far achieved, we estimate a dividend payment of $0.50 a share with an annualized dividend yield of about 15% based on our stock price in recent days.
and this could probably continue also in 2023 if we look at the company’s history and declared strategy.
The question that could arise spontaneously is how the company profits could be used for the remaining 2/3 of the earnings:
I think we do have a substantial amount of further debt we could pay down. If we were to do that to a degree, we’d have capacity for significant growth. And then it’s a matter of just being patient, getting the timing right and finding the right opportunity. But to underscore Bart’s point, I think we’d be very happy under those circumstances to return a lot more capital to shareholders.
Once again, the strategy is conservative and common sense. Part of the debt will probably be repaid and if possible the shareholders will be repaid further. The strategy seems clear, prudent, and with a vision of business continuity with what has been done in past years.
Debt
Seeking Alpha + Author Graph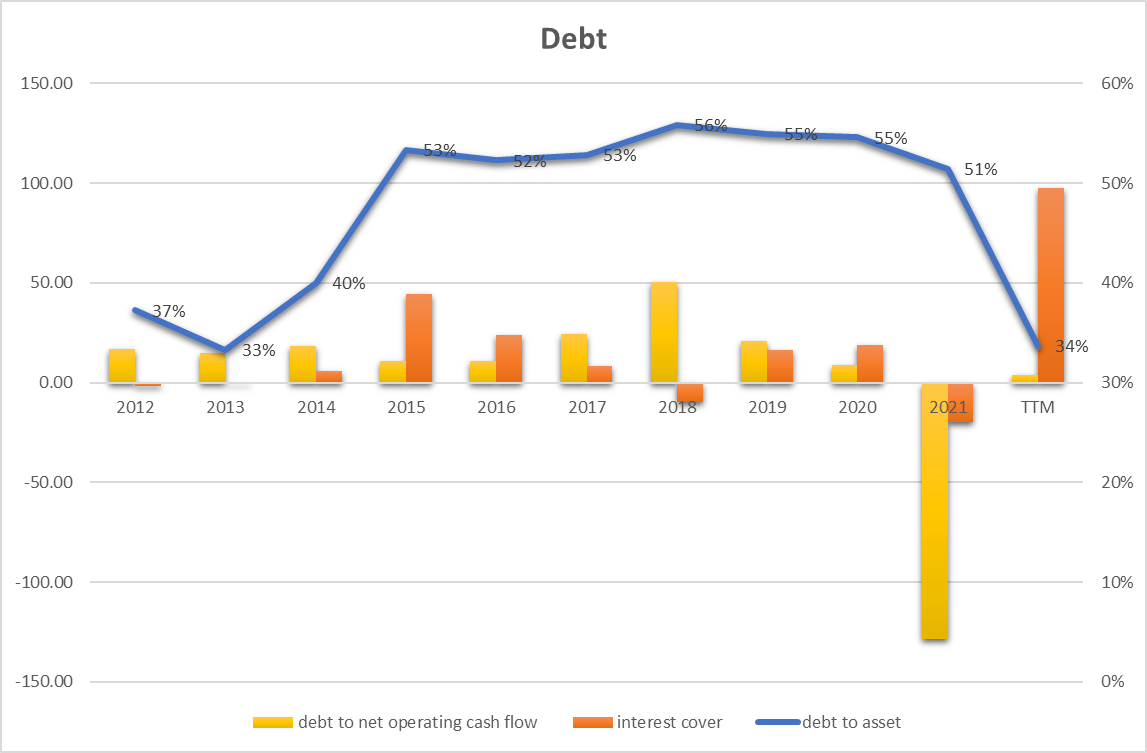
The blue line represents the ratio of the firm’s total debt to total assets. The 2022 ratio (34%) represents (2013) an all-time low in the last 10 years. If we also look at the trend of the last year, we can understand how the company has effectively implemented the appropriate measures to secure the company and to a level such as to be able to deal with any market turbulence with serenity.
The yellow bars represent debt on net operating cash flow and not considering 2021 which has a negative figure, we can see that 2022 is the lowest value in the graph. A good indicator of the company’s ability to service debt with operating cash flow.
The orange bars represent interest cover which is not a measure of debt but a measure of how many times the company’s corporate profits can pay interest on the debt. The higher the parameter, the more secure the company can be considered. Also in this case we can see how the value close to 100 and the highest in the last decade underlines the company’s great ability to repay the current interest on the debt.
Analyzing the company’s debt situation we can say that the company is having the best period in 10 years and that it has the fundamentals in place to face any future headwinds.
ASC and Earnings Power Value
Assuming that the cash profit remains constant over the long term, I use the EPV (earnings power value) method to calculate the intrinsic share price value.
The method starts with EBIT. The second step is to add depreciation and amortization and then subtract stay-in-business CAPEX.
The result is the Cash Trading Profit
I then subtract the taxes by calculating the amount using the actual tax rate that the company pays.
The result is the After-Tax Cash Trading Profit
At least to calculate the total company enterprise value I divide the After-Tax Cash Profit by the interest Rate I define as fine for this kind of Company (ASC is a high-risk company so I decided to use 15%)
The result is the Total Company Earnings Power Value. Dividing the result by the total number of shares we find the value per single share.
The table below shows the calculation for ASC
|
EBIT |
97.70 |
|
Dep & amort |
30.00 |
|
CAPEX |
-2.30 |
|
Cash Trading Profit |
125.40 |
|
TAX |
0.10% |
|
TAX |
-0.1254 |
|
After TAX cash profit |
125.27 |
|
Interest Rate |
15% |
|
EPV |
835.164 |
|
Share in issue |
40.5 |
|
EPV per share |
20.6 |
$20.6 represents the share price valuation using the EPV method. If we compare the data with the current market price ($14) we see that the current price could be seen as very cheap.
Peers Comparison
To compare ASC with similar companies in the same Oil and Gas Storage and Transportation industry I have defined the following peers:
Tsakos Energy Navigation Limited (TNP)
Nordic American Tankers Limited (NAT)
International Seaways, Inc. (INSW)
DHT Holdings, Inc. (DHT)
TORM plc (TRMD)
Using Seeking Alpha’s Quant Ratings we have a ‘Strong Buy’ verdict related to the ‘Hold’ or ‘Strong Buy’ rating of the others company.
Seeking Alpha
From the Quant Factor Grades point of view, we can see how Ardmore is outstanding in Growth, Momentum, and EPS Revisions. Only in Valuation, the grade is ‘B-‘ and NAT could be preferred. Profitability is also ‘B-‘ but if compared with peers ASC represents the best choice. Globally ASC has the best factor grades and, at the moment, represents the best investment opportunity.
Seeking Alpha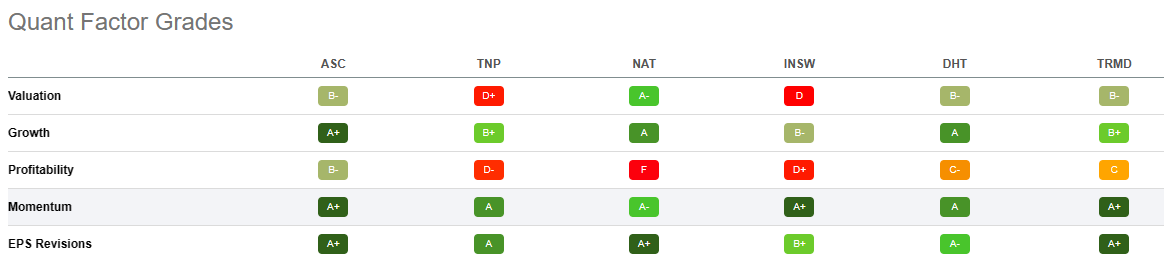
If we also look at the market price in the last year we can see how ASC was the best performer with an outstanding 307.5%!!
Seeking Alpha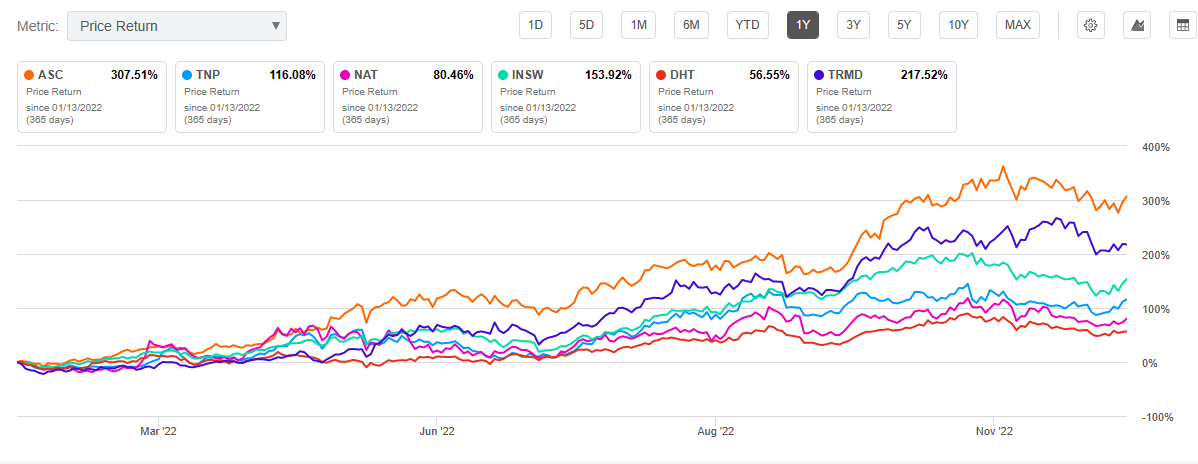
The seaborne tanker industry is highly volatile and cyclical.
Weak spot charter markets could deteriorate revenue and profit in a very short time. In 2022, Ardmore 25 (more than 80% total fleet) vessels were employed in the spot market and this means that the earnings are directly based on the spot market.
The spot charter operativity is very commonly used in the industry and oil products or chemical demand/supply changes could directly affect the charter rates. The graph below represents the Baltic Dirty Tanker Index trend which is a trend indicator of the market rates.
Investing.com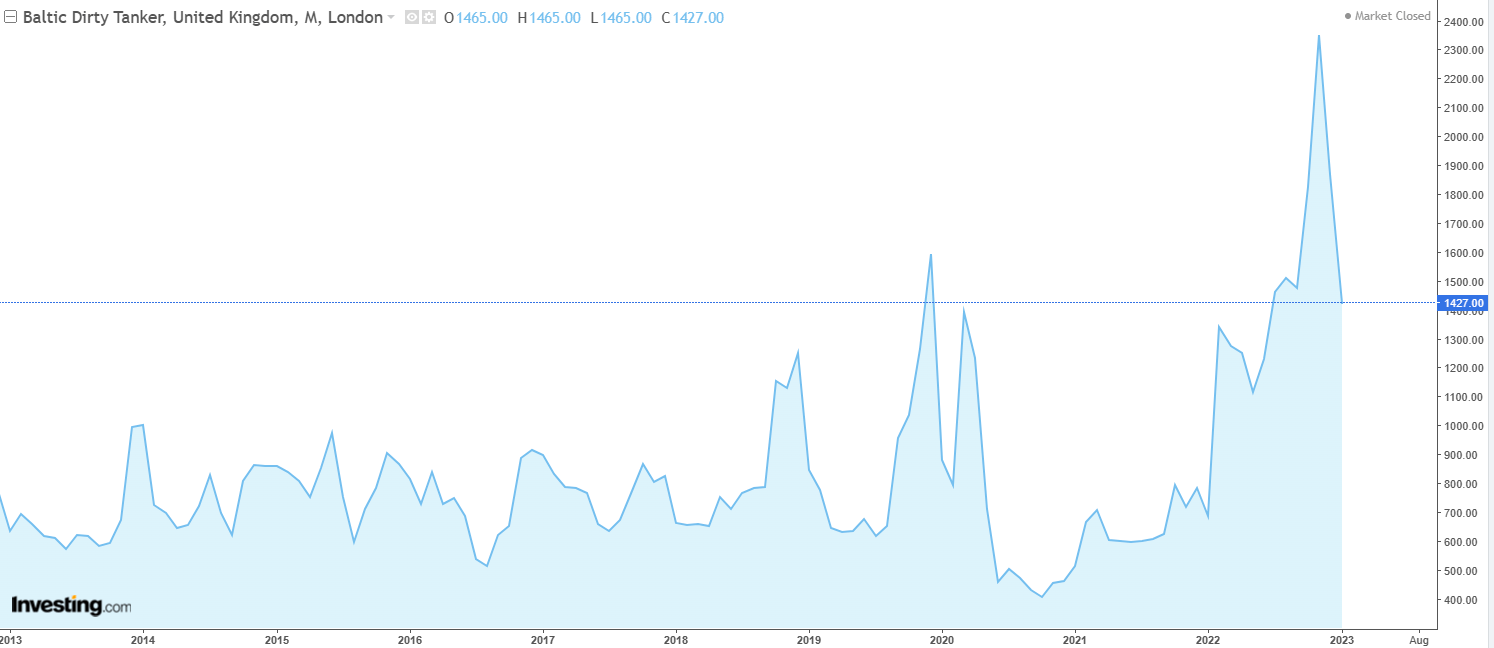
As we can see there are periods (for example 2021) when the index has reached its lowest level and this has led to a drop in spot rates below operating costs.
2022 instead recorded the maximum peak and this determined the great company result. What needs to be kept in mind is the high volatility of this index over the years. We can already see how at the beginning of 2023 we are experiencing a sharp drop in tariffs.
This index represents the greatest risk to corporate profitability and, as we are today, in a historic peak period, the probability of a trend reversal is high.
Conclusion
Ardmore Shipping can be defined as a company with solid financial fundamentals. Revenue growth and profitability have been extraordinary in 2022 but what makes the company ‘safe’ is maximum attention to capital allocation in the long run: investments and debt support a sustainable business even if the winds turn against it. The extremely favorable market period could continue into 2023 and with a share price valuation that seems to be very convenient, my rate is Buy.
Be the first to comment