


Darren415
This article was first released to Systematic Income subscribers and free trials on July 27.
In this article, we catch up on Q2 results from the Business Development Company Ares Capital Corp (NASDAQ:ARCC). ARCC is currently trading at a total dividend yield of 9.41% and a valuation of 104%.
The second quarter had a lot of moving parts for the BDC sector. Credit spreads widened substantially, providing a headwind for BDC NAVs while private equity risk appetite was generally subdued which weighed on income levels due to a lower level of prepayment fees. At the same time, short-term rates rose sharply, providing a boost to floating-rate BDC asset coupons while more opportunities emerged to make new loans at more attractive yields.
Overall, the company looks to be navigating this difficult period relatively well. It did see a modest fall in NAV as expected, however, the overall portfolio credit quality, as gauged by non-accruals, PIK and internal ratings remains good. ARCC is also taking advantage of the rise in short-term rates which has boosted portfolio income. The company increased its 3Q regular dividend by a penny to $0.43 on top of its $0.03 additional dividend declared previously for the last two quarters. Decent portfolio quality, further short-term rate rises as well as the company’s large undistributed spillover of $1.41 should continue to support its dividend level over the medium term, very likely resulting in further small hikes.
Quarter Update
Overall, ARCC did very well in Q2. Its NAV fell by only 1%, primarily due to unrealized losses from wider credit spreads. The quarterly drop in the NAV was the first since the COVID-related Q1-2020.

Systematic Income BDC Tool
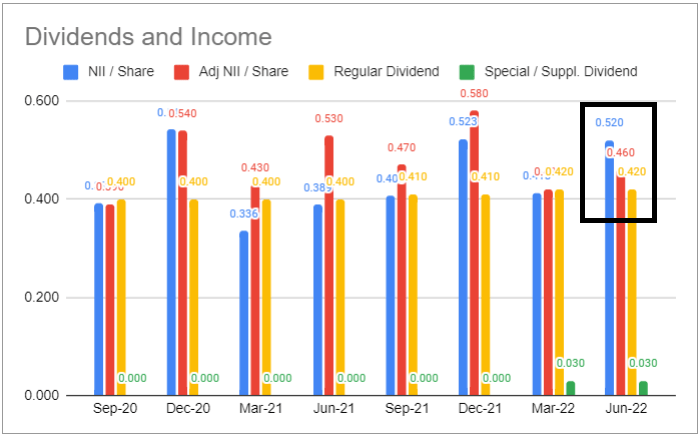
Core EPS (red bars below) increased by around 10% to $0.46 on the back of a strong level of recurring interest and dividend income.
Systematic Income BDC Tool
Total investment income in Q2 rose significantly above its Q1 level. Only the blow-out Q4, which was flattered by an unusually high level of capital structure fees (green bars), was above the Q2 level.

Systematic Income BDC Tool
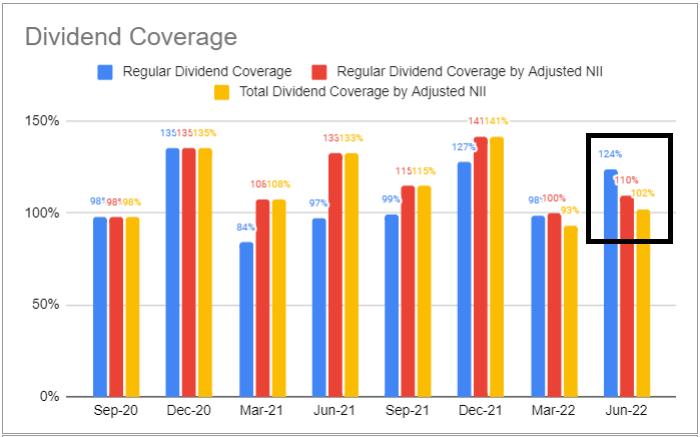
The new $0.43 regular dividend remains well covered by Core EPS (110% red bar below). The total dividend of $0.46 (regular plus the $0.03 additional dividend declared for Q3 and Q4) is also fairly well covered at 102% (yellow bars).
Systematic Income BDC Tool
Income Dynamics
In this section we highlight some of the key factors that will drive net income over the medium term.
The weighted-average yield on income-producing securities at fair-value increased to 9.6%, primarily as a result of the rise in short-term rates. Portfolio yield is running at the highest level over the last couple of years. As the chart shows, some of that will be eaten away by rising debt costs (red bars) as well as potentially higher non-accruals and realized losses.

Systematic Income BDC Tool
In Q2 ARCC financed its new assets with floating-rate debt which rose from 16% to 23% of the company’s overall debt. This is still a very low number within the BDC sector (the average BDC has a larger amount of floating-rate debt – around 43% vs. 23% for ARCC). This means that the company’s interest expense will increase in a slightly higher rate as short-term rates continue to rise although not as much as that of the broader sector.
Rising Libor will continue to contribute to higher net income over the rest of the year. Specifically, 3-Month Libor finished June at around 2.3%. However, not all of the 2.3% has fed into the company’s interest income for two reasons. First 3-Month Libor resets quarterly so a reset in the middle of the quarter would have only applied a higher Libor to half of the accrual period. And two, because Libor resets at the start of the period – the entire accrual references an earlier, lower level of Libor (because Libor has been rising in a more-or-less straight line).
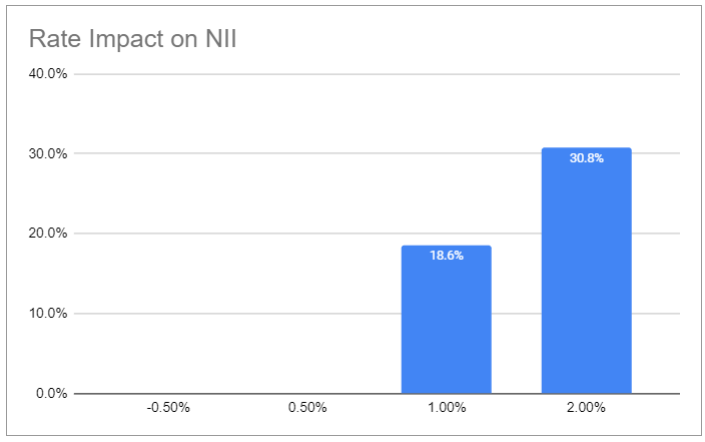
Management indicated on the call that if the entire rise in Libor over the quarter fed into the accruals, core EPS would have been 11% higher. In addition, short-term rates are expected to rise at least another 1% from their June level (to around 3.5%). If this is correct, we should expect another 19% rise in net income on top of the 11% full Q2 benefit, all else equal. Clearly, we don’t expect the full benefit to materialize due to refinancings, new non-accruals, realized losses etc. but a significant chunk should make it through.
Systematic Income BDC Tool
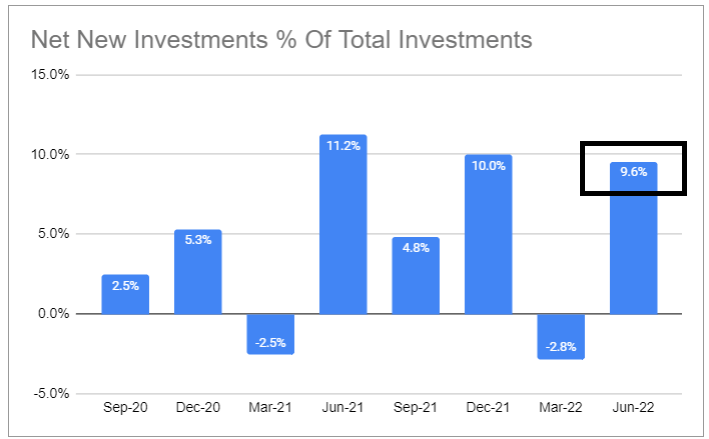
ARCC had a very strong origination quarter, growing its portfolio by close to 10%. This will continue to provide a boost to net income, going forward.
Systematic Income BDC Tool
The knock-on impact of the strong rise in net originations was a sizable uptick in leverage to the highest level of the last couple of years which will add to net income.
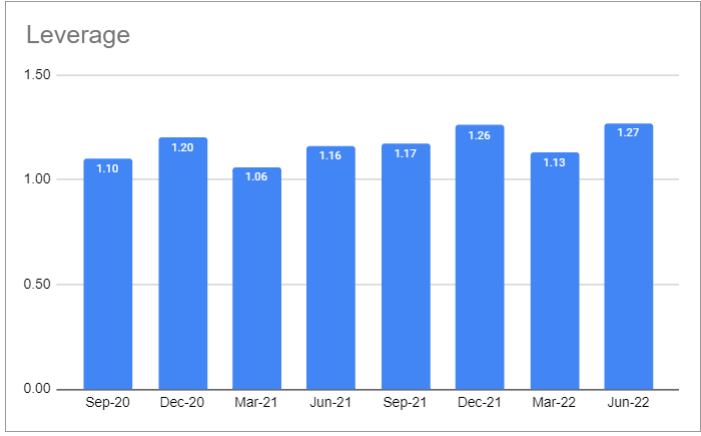
Systematic Income BDC Tool
The company’s leverage stands well above the sector average of 1.06x and median of 1.12x (based on BDCs in our coverage universe). The Annaly acquisition via the Ivy Hill portfolio was the primary driver of the leverage increase. Management have guided that they expect leverage to move lower over the rest of the year.

Systematic Income BDC Tool
Portfolio Quality
Overall portfolio quality appears to be holding in quite well. Obviously, we are very early in the current credit downturn but, so far, neither portfolio metrics nor management are indicating serious concerns.
Non-accruals ticked up slightly as one new name was added and now run at 0.9% on fair-value (1.6% on cost). This is still about half its value from a year ago. It also compares very favorably to the BDC average of 2.2% (2.9% median).
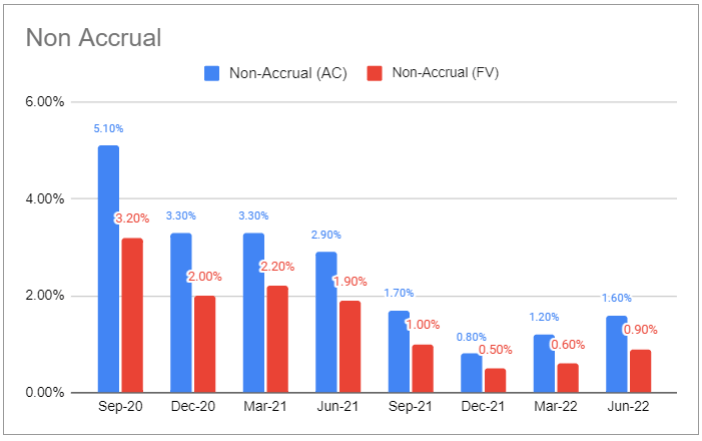
Systematic Income BDC Tool
Despite the uptick in non-accruals, internal portfolio quality rating improved slightly over the quarter.

Systematic Income BDC Tool
PIK income also fell and stands a bit above the sector average level.
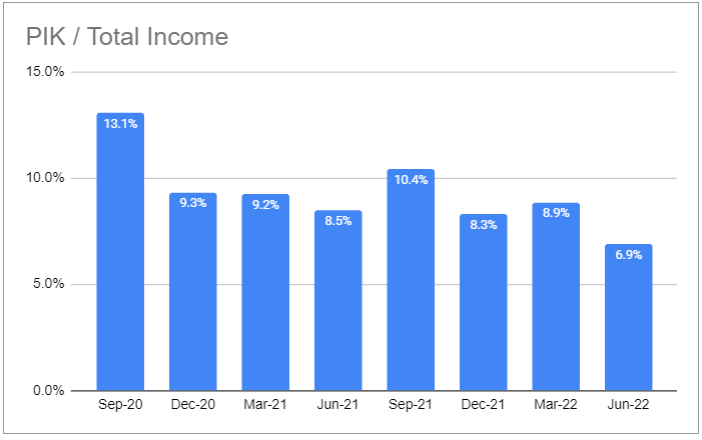
Systematic Income BDC Tool
The allocation to first-lien secured loans moved higher at the expense of second-lien positions.
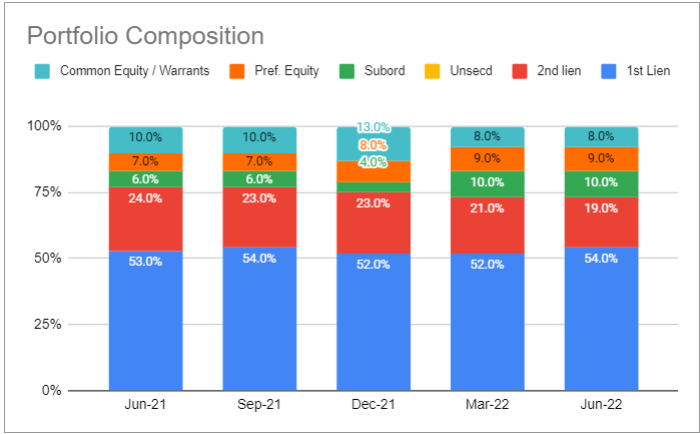
Systematic Income BDC Tool
For the first time in the last couple of years the portfolio registered some net realized losses.

Systematic Income BDC Tool
An important question is whether the sharp rise in short-term rates will have a negative impact on the interest coverage of the company’s borrowers. Management didn’t sound particularly concerned about this, highlighting that a 1.5% rise in short-term rates would still result in a reasonably healthy weighted-average interest coverage of 2x. Arguably, a more interesting metric would have been the proportion of the portfolio whose interest rate coverage would go negative, however, this piece of data is not available.
Valuation Profile
The valuation of ARCC has come down significantly from its high level earlier in the year when it traded in the valuation range of 110-120%. ARCC has also tended to trade fairly consistently above the sector average valuation since around 2019 – very likely as the market finally caught on to its strong performance.
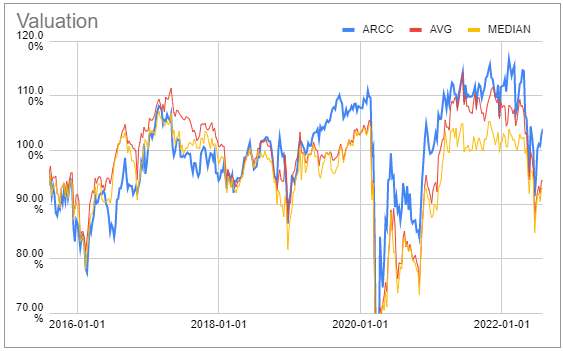
Systematic Income BDC Tool
This chart shows the valuation differential to the sector. It is currently trading at a valuation of around 10% above the sector average which is on the high side of its historic trend.
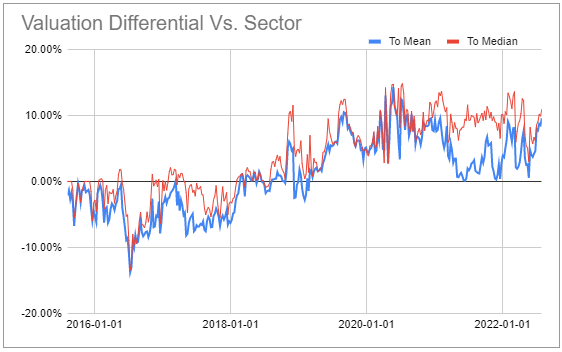
Systematic Income BDC Tool
We track this relative sector valuation in the price / NAV spread percentile metric in our BDC Tool. This figure is currently at 95% meaning the stock is trading at a higher valuation level relative to the sector than 95% of previous days. This is possibly skewed a little bit because of NAVs referencing different quarters (i.e. ARCC valuation being as of Q2 and the rest of the sector as of Q1) but it won’t change the fact that ARCC is relatively expensive.
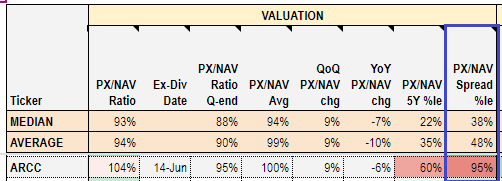
Systematic Income BDC Tool
The historic total NAV return chart shows that investors are happy to pay up since the company has delivered an above-sector return over various time periods.
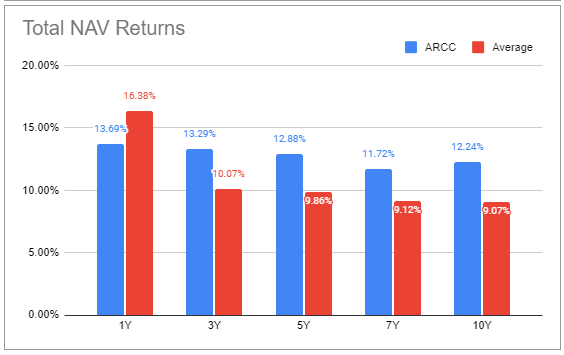
Systematic Income BDC Tool
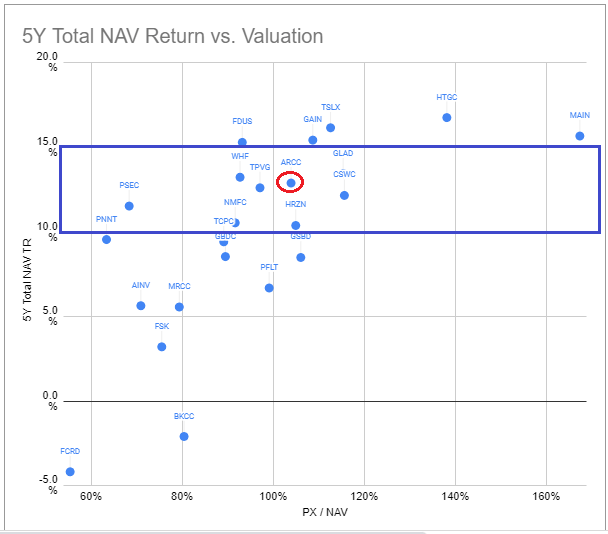
If we combine the 5Y total NAV return with its valuation we see that of the BDCs that delivered a total NAV return of 10-15% CAGR ARCC is slightly on the expensive side although, arguably, it has been more consistent than BDCs like TPVG or WHF that have similar 5Y total NAV returns but trade at lower valuations. Overall, this suggests the company’s current valuation is fair, if not a slam dunk.
Systematic Income BDC Tool
Points Of Differentiation
Besides the company’s consistent ability to deliver strong performance there is another interesting aspect of ARCC that is worth highlighting for BDC investors. This has to do with a few points of differentiation that ARCC offers relative to the sector.
First, ARCC has the largest number of portfolio companies at 452 – the average in the BDC sector is just 129. This makes its portfolio significantly more diversified than the average BDC.
Two, ARCC is focused on larger companies. In fact, the usual middle-market segment – broadly defined as $10-$150m of EBITDA is well below the ARCC landscape whose weighted average EBITDA is at $179m. This means that ARCC really targets a different kind of company than the rest of the BDC sector.
There is a lot of debate about the “best” segment of the corporate direct lending space to be – ARCC thinks it’s at the higher EBITDA end (due to more diversified revenue streams, broader customer base, deeper management etc.) while BDCs that focus on the lower middle-market segment will typically extol the features of that space such as lower default rates and others.
Three, ARCC has a lower first-lien profile, something which has allowed it to capture more upside in its portfolio via common equity and warrants than the average BDC, providing it with another total return angle. Its first-lien allocation is 54% versus the BDC average of 77%. This may sound like it has a “lower-quality” profile, however, it has been consistently able to perform well through various drawdown periods.
Takeaways
Overall, ARCC put up a very good quarter. The drop in the NAV is fairly small as are realized losses and the uptick in non-accruals. On the income side, rising short-term rates should continue to drive net income higher, further supporting the dividend.
Despite an increase in volatility, a slowdown in macro indicators and a likely increase in defaults over the medium term, the broader BDC environment has also improved in a few significant ways. The pricing of new loans is at more attractive levels – ARCC estimates that there is 1% of additional spread on new deals. This is obviously in addition to a higher Libor base rate as well. This is an unusual combination as, typically, rising Libor is correlated with a strong macro backdrop which causes spreads to fall and offsets some of the rise in rates.
And secondly, documentation on new deals is also improving according to ARCC with covenants reemerging in some of the smaller deals. With defaults still at very low levels, this environment of rising short-term rates, slightly wider spreads and stronger documentation presents a kind of Goldilocks environment for BDCs.
So while we expect the next two quarters to continue to present challenges to the BDC sector, investors shouldn’t overlook a number of positive elements as well as the historic ability of ARCC to continue to deliver value for investors.
Be the first to comment