

Jacob Wackerhausen/iStock via Getty Images
First question: Do you like high yielding real estate investment trusts (“REITs”)?
Second question: Do you like capital appreciation?
Third question: Do you want your cake and eat it too?
If you answer the third question as “yes,” then this article is made for you.
Because today I will be writing on one of my favorite commercial mREITs, Arbor Realty Trust, Inc. (NYSE:ABR).
But first, here’s a sector overview…
iREIT 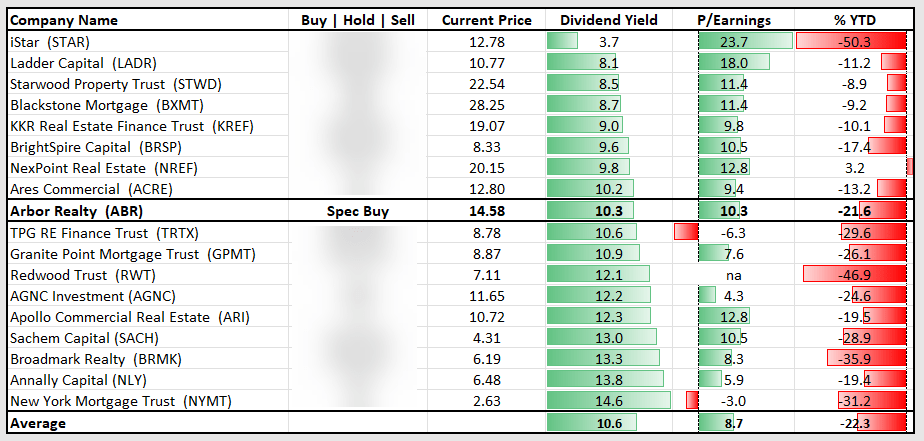
Mortgage REITs Sector Primer
Mortgage REITs, also known as mREITs, are not the easiest sector to understand. To start, there are commercial mREITs as well as residential (or “resi”) mREITs.
Commercial mREITs focus on commercial buildings with residential involving residential assets with loans either involving or subsidized directly or indirectly by the U.S. government. Those are Freddie and Fannie loans.
We allocate the majority of our time, energy, and personal capital to commercial mREITs. It’s for a long list of reasons, which we outlined in our “Building A Foundation Series” on mREITs, including more reliable and predictable loan and interest payments, less leverage (2-3x less), greater borrower industry diversification, and a better track record during downturns.
mREITs are internally or externally managed. That applies to equity REITs and Business Development Companies (“BDCs”), too, but external management is particularly common with mREITs.
We have to be especially careful about conflicts of interest, incentive structures, and critically evaluating management’s performance when external management is involved.
Several of the largest and best known mREITs are externally managed, including one of the companies we’ll be focused on today. While some dismiss any company with an externally managed structure, I consider it throwing the baby out with the bathwater.
All companies have negative and positive characteristics associated with their businesses, and how management is legally structured is just one variable. Internally managed companies have destroyed much more shareholder value than externally. That’s more a function of the fact most companies are internally managed, but the fact still stands.
Let’s get into today’s first mREIT we think is designed to provide attractive risk-adjusted returns in today’s uncertainty and going forward.
Arbor Realty Trust
Arbor offers one of the most comprehensive lending platforms I’ve come across. It specializes in customized financing and is most active in the multifamily sector. Arbor’s business is unique among mREITs.
First, Arbor is internally managed. Most mREITs are externally managed, and all things being equal (they rarely are), internally managed is better.
Second, Arbor executes a highly flexible multifamily focused lending and operating business. This concentrated approach is attractive to those who like the stability and inflation protection offered by multifamily and don’t necessarily need a diversified approach.
Let’s talk about this for a moment to better understand the plusses and minuses.
If we look through the equity REIT lens, the best performing REITs are sector specialists. Do you want a heart surgeon to perform heart surgery or an ER generalist?
mREITs generally tilt toward heavy diversification, and I’ll explain why. On the debt side of the equation, upside is limited or nonexistent outside of interest collected on the loan.
If Starwood Property Trust (STWD), our selection for Part I of this series, were to be exceptionally skilled at hotel underwriting, it isn’t likely to generate significantly better returns than another lender that’s simply reasonably skilled at it.
That’s because there isn’t additional upside as a lender. No matter how great the property performs, all you get is principal and interest payments. If governments were to suddenly restrict travel, however, the downside of concentrating in hotels could be devastating.
To mitigate this risk, most mREITs prefer a portfolio diversified across many industries and geographies. When it comes to individual portfolio construction, however, people prefer to own a diversified set of sector specialists rather than many diversified managers.
That’s what we all do, whether we realize it or not. That includes exchange-traded fund (“ETF”) investing as each underlying company mostly focuses in one area – automotive, oil and gas, real estate, you get the picture.
Multifamily Is Multifaceted
By focusing on multifamily, Arbor is a sector specialist like most equity REITs. Cyclical industries wouldn’t be a good fit for this strategy. Neither would those with substantial regulatory uncertainty.
It can make sense for equity investors since there is proportional upside, but not for lenders. That’s one reason so many banks were negatively impacted when the upstream oil and gas sector collapsed around 2014 – they were too concentrated in one volatile area.
Multifamily, however, is well positioned to weather the storm. Lease terms average about one year so inflation risk is minimized. Owners can pass on inflationary pressures every month as tenant leases expire. While no one needs to live in a brand-new Class A skyscraper downtown, everyone does need a place to live, and housing stock is limited.
Unlike industrial and several other property types, location is critical too. Families are tied to schools, workers to their jobs, and people to their local communities. Occupancy in all types of multifamily, from Section 8 affordable housing to luxury properties, tends to stay above 90% through economic cycles.
Multifamily benefits from another structural tailwind. The U.S. multifamily market was 10% owned by institutions 25 years ago. That’s around 25% today.
We’ve talked about this before, but the same trend has occurred in self-storage and other parts of the real estate market that has generated truly impressive returns over long periods of time.
There are other benefits, too. As we’ll soon discuss, the government subsidizes multifamily loans just like they do for single-family homes. This improves economics and makes deals easier to close.
Regulations are reasonable and demographics are favorable as well. The alternatives to renting remain extremely expensive to most people, and that’s before a recession drives up down payment and credit score requirements.
Interest rate increases also tilt economics toward apartments and away from single-family homes (it hurts both, but individual buyers using 90% leverage are more sensitive to it).
CapEx isn’t high compared to other property types either. The typical credit risk associated with the tenant of an office or retail building is spread across hundreds of tenants in a multifamily building. For those that have bought or sold a single-tenant building, you know the challenge of syncing the lease term with the transaction.
This all comes together to improve liquidity when it comes time to sell and there are dozens of multifamily properties in every medium and large city in the U.S to choose from.
Portfolio & Strategy
Source: Arbor Q2 Fact Sheet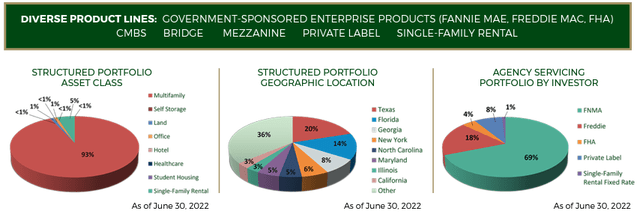
We know what Arbor does at high level, but we need a granular understanding to properly assess the risk and reward profile.
93% of the portfolio are multifamily loans, 5% is self-storage, and ~1% each in several other property types. Geographic diversification is extremely good, so no issue there.
The pie graph on the far right is one you won’t see with other commercial mREITs and demonstrates how subsidized government loans augment Arbor’s business.
Much of Arbor’s business looks and pays like an annuity as it builds income streams from its lending activity. Loan originations in Q2 2022 were $1.27 billion, which is a lot, but pales in comparison to the $26.77 billion in loans that Arbor services.
Source: ABR 2022 Q2 10-Q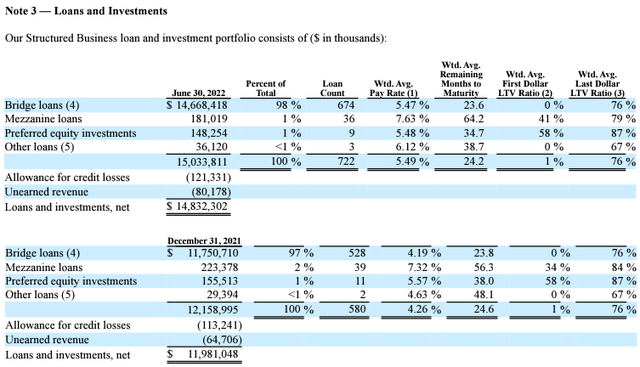
Its structured loan portfolio surpassed $15.0 billion in Q2. That’s up 6% from the previous period. Most of the loans are short to medium duration or 2-5 years. This table shows the various interest rates associated with Arbor’s loans. Since 98% are Bridge, that division’s 5.47% is the most important.
Note that Arbor uses relatively high loan-to-value (“LTV”) 76% on those loans and the rest of the portfolio. Arbor’s focus on Bridge loans with around a 75% LTV has been in place for many years.
Cash Flow & Dividend
Source: ABR 2022 Q2 10-Q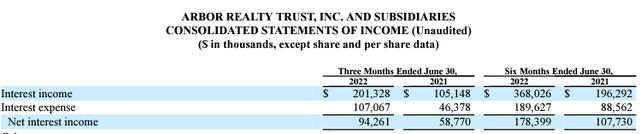
Starting with revenue, interest income rose from $196.3 million in the first half of 2021 compared to $368.0 million in the first half of 2022 – that’s 87.5% growth.
That’s great, but interest expense matters to. We can use net interest income to adjust for that, which gives us $107.7 million in the first half of 2020 compared to $178.4 million this year. 65.6% growth on net interest income in one year is easily the best in the sector.
Source: ABR 2022 Q2 10-Q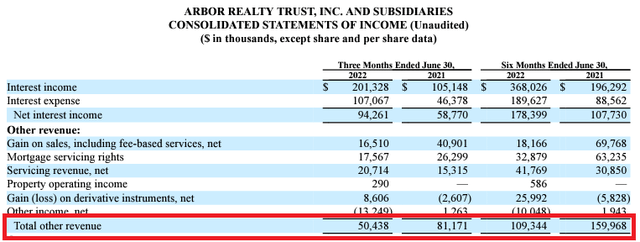
We need to consider other forms of revenue for Arbor. In this case, the first half of 2022’s $109.3 million in “other revenue” is well below that of the same period in 2021’s $160.0 million.
Expenses were up slightly (11%) as well. Adding it all together, GAAP net income was down 3% in the first half of 2022 compared to 2021. Like most REITs, Arbor issued shares over the period, so diluted per share earnings of $0.82 were about 20% lower than the first half of 2021’s $1.06 per share.
We need to look at prior years before coming to conclusions. 2019 is a good reference point since it’s pre-pandemic. Net interest was $32.5 million in Q3 of that year compared to $89.2 million on average for the first two quarters of 2022.
That’s 175% net interest income growth in less than three years. GAAP earnings per share (“EPS”) was approximately $0.36 in Q3 of 2019 and 2018 compared to an average of $0.41 quarterly so far in 2022. That’s 14% growth despite challenging conditions this year.
GAAP EPS is reasonably useful for mREITs, but like their equity cousins, they have non-cash charges that artificially deflate GAAP numbers. That’s why most use Non-GAAP numbers like “Core EPS,” “Non-GAAP EPS,” or “Distributable Earnings.” In all cases, this is what management believes is the correct way to measure cash flow and dividend coverage.
Source: ABR 2022 Q2 10-Q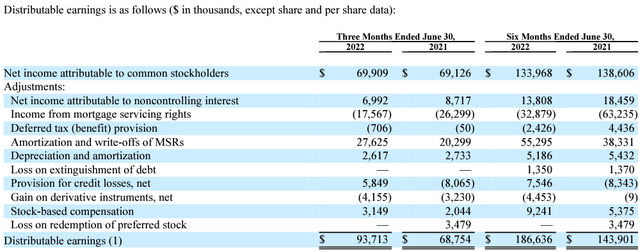
Distributable Earnings were $185.6 million in the first half of 2022 compared to $143.9 million last year. That’s 29.0% cash flow growth year-over-year at the firm level.
Impressive, but we need to adjust that for the increase in shares outstanding. First, if we include potential dilution from the issuance of convertible notes, the share count increases by 15.1 million. The SEC doesn’t require this and those shares do not currently exist, but that would result in Distributable Earnings per share of $0.98, or just one penny higher than the same period in 2021.
Excluding that figure, which Arbor does in their calculations, results in $1.06 per share or 9.3% cash flow growth. All other variables constant, that’s the number Arbor can responsibly increase the dividend.
Even if we use $0.98, the recent dividend increase to $0.39 per share quarterly still results in a 79% payout ratio. $1.06 per share in cash flow for the first half of 2022, which is accurate for today as the notes haven’t converted, is a 73.6% payout ratio.
Let’s put that into context.
The average quality mortgage REIT has a payout ratio of 90-95% with spikes to 100% not atypical. This includes the likes of Starwood Property Trust and Blackstone Mortgage Trust (BXMT), two of the largest and most respected players in the sector. The average investment grade equity REIT has a payout ratio of 70-80%.
Arbor has with the most conservative payout ratio in the mREIT industry coupled with the fastest dividend growth.
Both metrics are comparable to the best of the best equity REITs, except there is one glaring difference. Most of those quality equity REITs don’t even yield half of Arbor’s 10.4%.
Risk, Leverage, and Liquidity
Source: ABR 2022 Q2 10-Q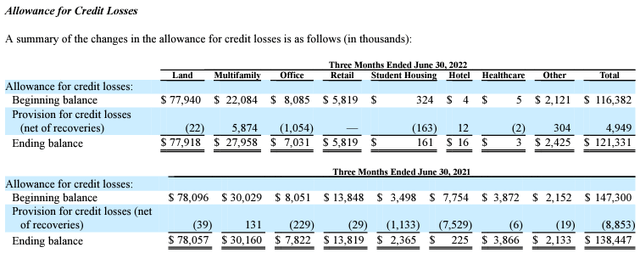
This table shows Arbor’s allowance for credit losses in 2022 and 2021. Anticipated credit losses are a reliable (not perfect) measure of how a mREIT (or bank’s or BDC’s) loans are performing.
In Arbor’s case, it ended Q2 2022 with $121.3 million in problematic holdings, most of which are tied to land rather than buildings. That’s down from $138.5 million in the same period last year.
That compares to $71.1 million in anticipated credit losses in Q3 of 2019 when the portfolio was $3.9 billion compared to today’s nearly $15 billion. Normalizing for the size of the portfolio, today’s allowances for credit losses are 52% lower than before the pandemic.
Source: ABR 2022 Q2 10-Q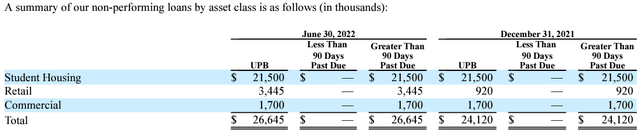
As of June 30th, total non-performing loans (“NPLs”) were $26.7 million. That’s 0.12% of the portfolio – barely a tenth of one percent.
Source: ABR 2022 Q2 10-Q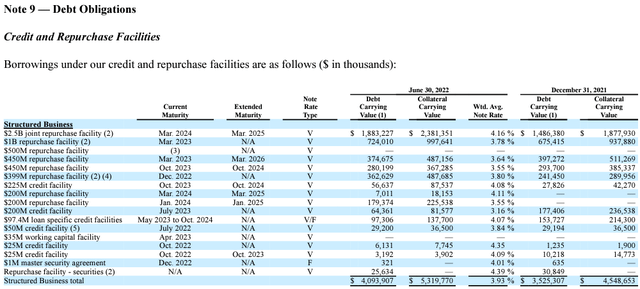
A key for all lenders is the spread between what they borrow and lend at. In Arbor’s case, we’ll divide that into two sections.
The first section encompasses this chart and the one below it. The above chart shows a highly diversified set of facilities totaling $4.1 billion in outstanding credit with a weighted average borrowing cost of 3.93%.
If you think that’s good (I do), wait until you see the terms on the government subsidized business.
Source: ABR 2022 Q2 10-Q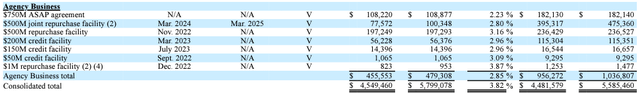
2.85%.
That’s the weighted average cost of debt for Arbor on its agency business. Remember that agency just means Fannie Mae and Freddie Mac.
It’s important to realize that the “V” in the middle column stands for variable rate. These facilities will increase in cost as rates rise. Bridge loans are also floating rate so the cost is passed on directly to the borrower. A major spike in rates or a severe recession, however, could cause borrowers to become unable to absorb those higher rates.
Source: ABR 2022 Q2 10-Q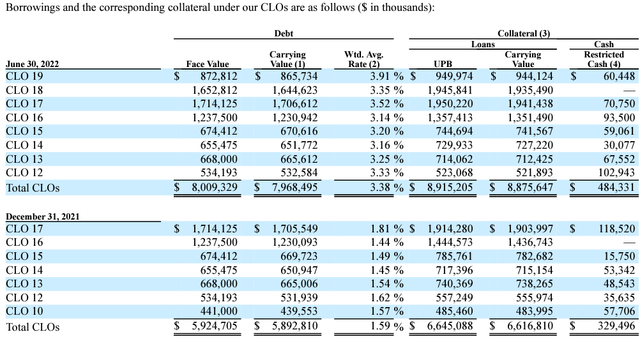
Most mREITs utilize the collateralized loan obligation (“CLO”) markets as well. That’s because it’s nonrecourse to Arbor – they could walk away if they had to. At the end of 2021, Arbor was paying a mere 1.59% on its CLOs outstanding. That has increased to 3.38% due to higher rates.
Source: ABR 2022 Q2 10-Q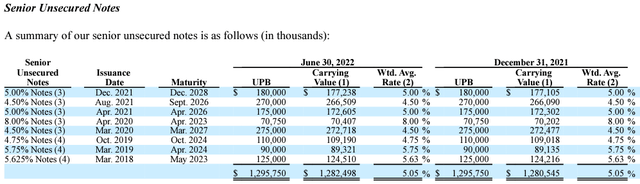
Arbor also has $1.28 billion in senior notes outstanding with maturity dates ranging from 2023 to 2028. The weighted average interest rate on these is 5.05%, which is why it’s the least utilized capital source.
In every case, the carrying value of the loans used as collateral exceeds the carrying value of the loans on Arbor’s balance sheet.
In summary, Arbor has $4.55 billion in credit facility and repurchase facility debt outstanding at a weighted average rate of 3.82%, $8.0 billion in CLO debt at a weighted average interest rate of 3.38%. and $1.28 billion in senior notes at 5.05%. That’s $13.8 billion in various types of debt against $17.6 billion in total assets.
The mREIT ended Q2 with $767,432 in restricted cash and well over a billion in undrawn capacity on its credit facilities.
The primary risk for Arbor in my opinion isn’t any of these factors. If the commercial and residential real estate markets have a multi-year downturn, as happened due to the Great Recession, lending activity will grind to a halt and Arbor won’t have nearly as much lending activity. That said, Arbor has navigated just about every type of cycle albeit with mixed success.
Although the last 15 years have been good, the company cut its dividend due to the Great Recession. It survived when many didn’t, but it wasn’t an easy road.
Back then, Arbor maintained meaningful equity in its deals. The equity exposure, which was wiped out, is what damaged Arbor’s financials back then. Arbor no longer participates in the higher risk equity part of the business and hasn’t for a long time.
Valuation
Versus its direct peers, Arbor’s:
- 10.4% yield is moderately superior (peer average is 9%)
- 74-79% dividend payout ratio is far superior (peer average is 90%+)
- Double-digit annualized 3 and 5-year dividend growth is far superior (peer average is <5%)
- Dividend track record of nine consecutive quarterly increases (30% increase over that period) and no reduction in its history is far superior (better peers have never reduced either albeit with little to no dividend growth)
- 13.9% cash flow yield per share is far superior (peer average is 9-10%).
There are two elements that some analysts believe are headwinds to owning Arbor’s stock.
First is premium to book value.
I won’t spend much time here because it’s mostly irrelevant. Cash flow yield per share and the growth of that metric is all that matters for Arbor or any of its mREIT peers. In fact, one could argue that’s all that matters for any high yield or dividend growth investment.
Additionally, comparing book values between companies with different business models is apples to oranges at best. You’d have to adjust for the risk and return profile of those underlying net assets to make a fair comparison, and nobody does that (at least not on Seeking Alpha or in any other free research).
Undepreciated book value per share is a good metric for some mREITs, but it isn’t terribly useful for Arbor. It doesn’t matter anyways because cash flow is king.
The second is Arbor’s leverage profile and interest rate sensitivity. Certain analysts claim Arbor’s borrowing costs have increased 60% due to the recent $250 million debt offering.
That’s on the senior notes, which as I’ve detailed here, are the smallest and most expensive part of the capital stack. The $8.0 billion, or 70% of all debt, invested in nonrecourse CLOs is much more important to the business. Any lender has sensitivity to rising rates to some degree, but it isn’t necessarily any higher for Arbor compared to peers.
Arbor remains extremely compelling below $16 per share. In a normal market environment, there isn’t a good reason for Arbor to trade below $19. It’s important to note that retained earnings and earnings growth mean those numbers just go up every year.
At $14.50 per share, investors obtain:
-
A 10.4% dividend yield with best-in-class coverage,
-
Reliable high single-digit/low double-digit annual dividend growth in the near to medium-term, and
-
30% capital gain potential as markets normalize.
FAST Graphs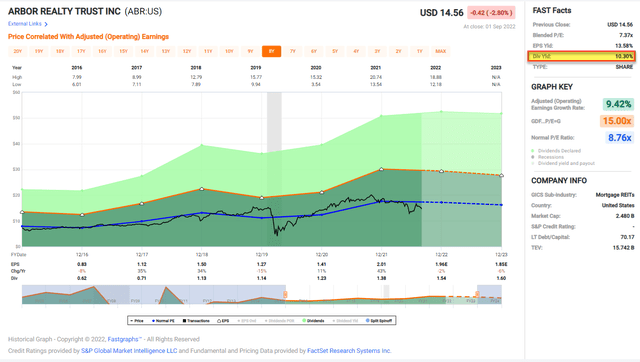
Be the first to comment