

deepblue4you/iStock via Getty Images
Not only because of the last week’s earnings…
This article examines the developments in the financial performance of Arbor Realty Trust, Inc. (NYSE:ABR) since my last coverage in January 2022. It will, however, touch much less on various reported metrics than would be expected given the increase in price following the last Q3 earnings call on November 4.
Rather, I will focus on my interpretation of the narrative that has been made by Arbor Realty management over the last three quarters. My analysis refers obviously to the financial performance and outlooks for the next year, especially given the rising inflation and projections of the recession. However, for all those who want to understand the business, including myself, it is vital that we really learn why management make the decision they do and what it could mean to us as investors in the mid- and long-term. The investors’ presentation for Q3 is not yet available on the IR site of ABR, so wherever I refer to any financial metric, I will help myself with a Q2 presentation while speaking to the Q3 numbers, besides bringing up also the Q4 2021/FY 2021 presentation.
About the business
Very briefly, the $2.72B-market cap Arbor is a multifamily (over 90% of assets) focused real estate investment trust (“REIT”) with an annuity-based business model. This creates multiple high-quality long-dated income streams from one investment through diverse product lines. It originates and services balance sheet loans, Fannie Mae, Freddie Mac, and FHA loans, as well as runs a small single-family rental portfolio platform that provides bridge, permanent, and build-to-rent lending products – being also an area where Arbor sees some of the biggest growth opportunities.
To visualize the 2021 development of Arbor’s portfolio, see below the slide for Financial Year 2021 as compared to 2020.
Segments of originations (FY 2021 results – Arbor IR site)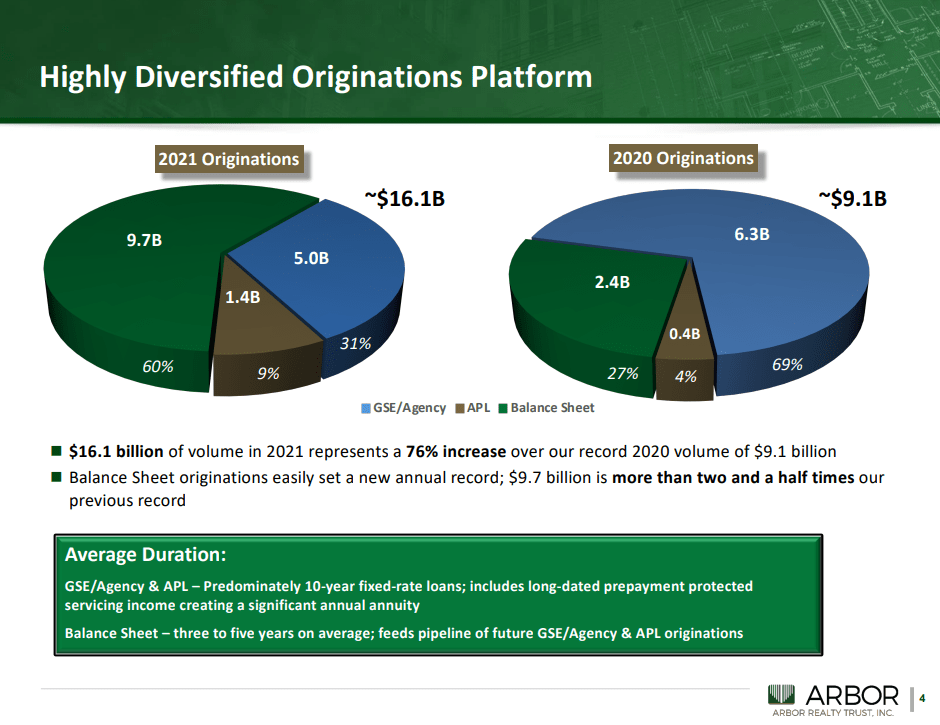
As taken from Q2 presentation, you can compare the volume and the characteristics of the originations for the first half of 2022 to the full of 2021.
Segments of originations (Q2 2022 results – Arbor IR site)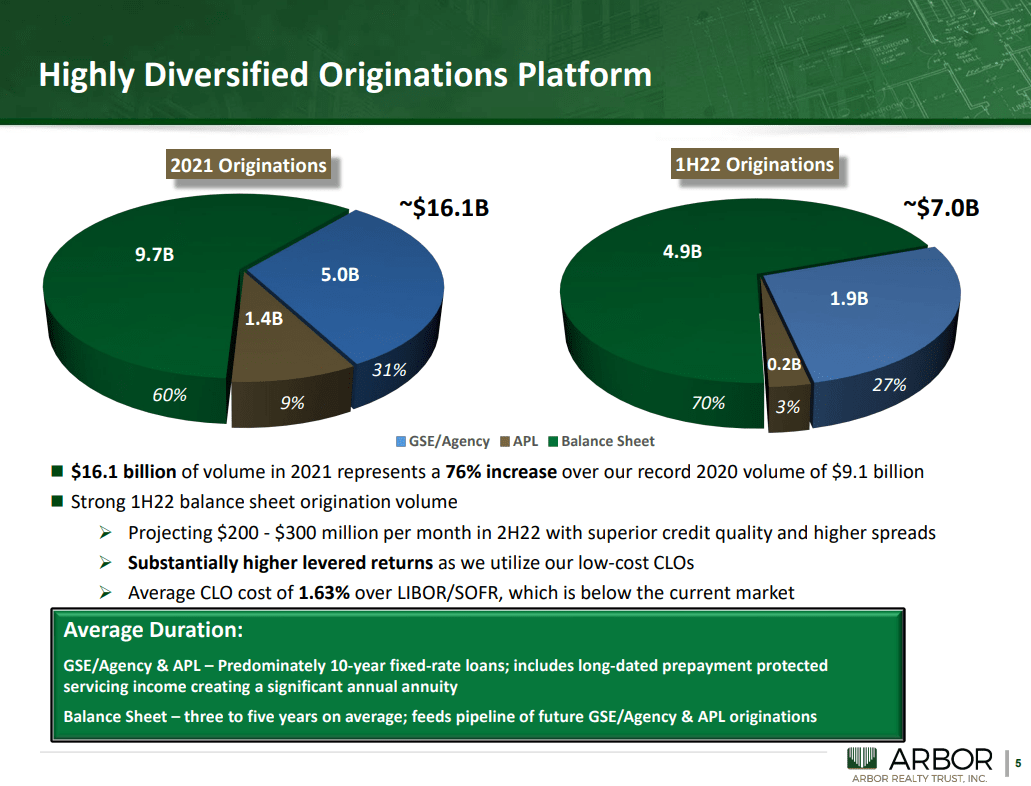
In Q3, the GSE/Agency portfolio increased by another $1.1 B in originations in comparison to Q2. While the balance sheet portfolio was valued at $12.2 B at the end of 2021, in Q2 (and Q3) it was at the level of $15B. When it comes to the composition, Arbor has increased even more its focus on multifamily workforce affordable housing, with the main geographical footprint in Texas, Florida, and Georgia.
Balance sheet loan portfolio composition (Q2 2022 results – Arbor IR site)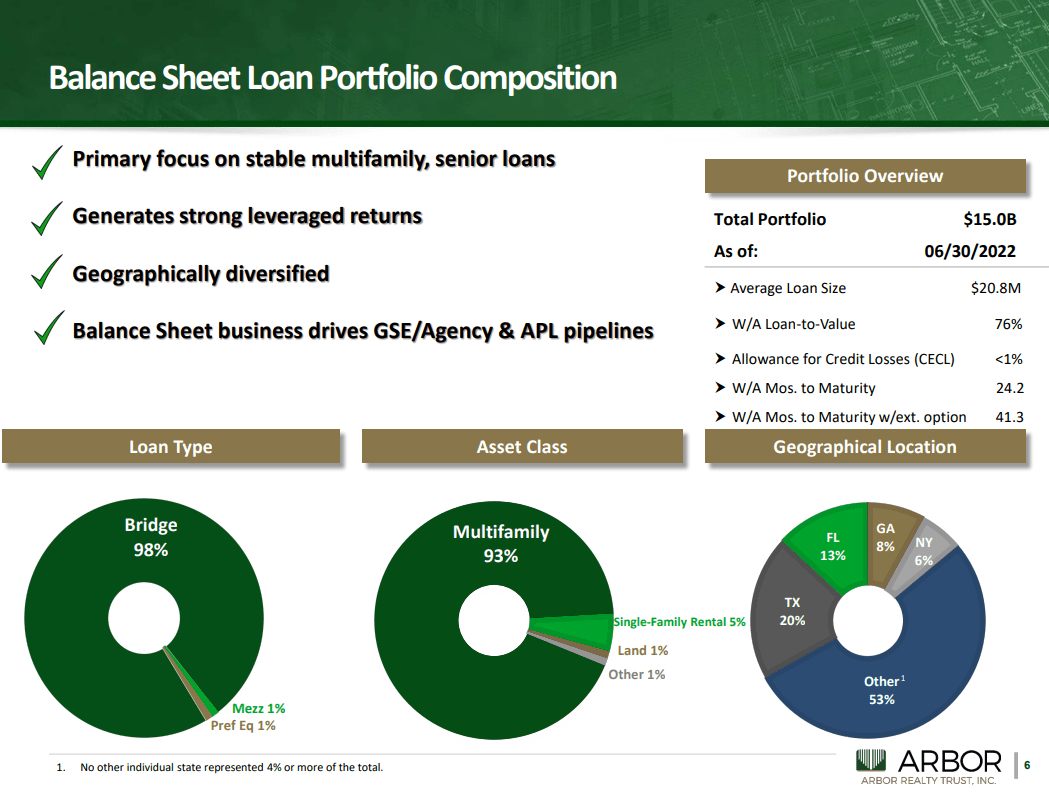
As you can see, the weight-average Loan-To-Value rate is 76% for Q2 (the same was for FY 2021). The loans that have run-off in Q3 had an LTV of 79%. However, in Q3 the average LTV of the new originations was at the level of 72%. What that means, and which is part of the Arbor narrative, is that Arbor requires now that borrowers bring in a higher portion of down-payment to de-risk the loans. This demand on quality is also combined with increased pricing, which in total is a testament to Arbor’s tightening its requirements towards new borrowers, especially with a view to rising interest rates which allow only high-quality borrowers to take this loan.
As mentioned, Arbor originates and services the loans on their own balance and on behalf of the Agencies. See below the Q2 visualization of the trends for the last 5 years.
Income from originations and servicing (Q2 2022 results – Arbor IR site)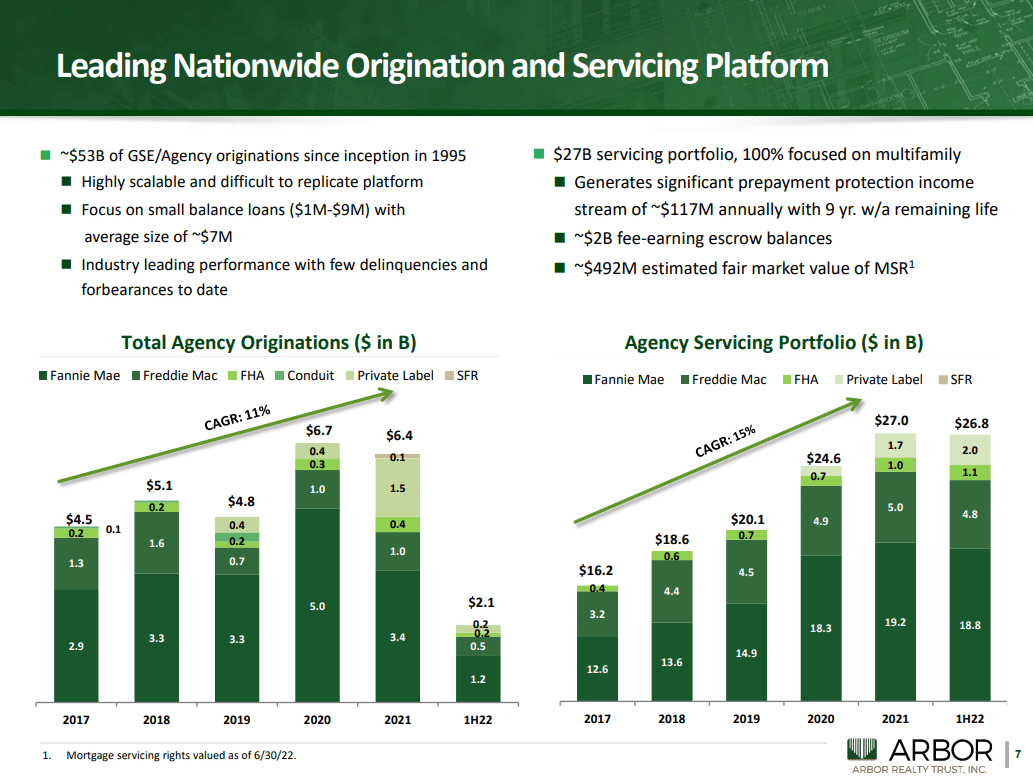
The servicing portfolio as of September 30 was at $27.1B and it is expected to generate a predictable annuity of income going forward at around $115M annually.
As for the run-offs, the prepayment fees are predicted to fall substantially since with the rising interest rates, there will be fewer opportunities for refinancing shopping by the borrowers. In the discussion during the Q3 earnings call, the management predicted those fees to fall from the teens to single digits in the coming quarter and next year.
Dividend growth
The last declared dividend was $0.40, which marked also the 10th consecutive quarterly increase, while maintaining one of the lowest (around 71%) payout ratios in the industry. The current annual run rate is $1.60 per share. Buying Arbor’s shares now, even after the surge of the last week, locks in the trailing dividend yield of approximately 11%. Does anybody need income?
Outlooks on access to financing and recession
I personally enjoyed listening to the last 3 earnings calls, especially the last one (Q3). It included a piece of high-quality communication from the management. CEO Ivan Kaufman gives an excellent explanation on why Arbor is not only a REIT of choice for quality income, but also a frontrunner of preparation for a possible serious overcorrection of the market and recession. Many of his points refer to discipline and conservative focus on the quality of borrowers, to preparedness and gathering cash in order to allocate it opportunistically when some M&A targets and vacant assets get ripe. In addition, he discussed getting out in a timely fashion of some structured instruments like collateralized loan obligations (“CLOs”) at the last moment when their use and cost are still beneficial – while others are just getting into them.
I felt like I had to read a bit more about CLOs to understand the logic, process, and historical performance of this type of instrument, given the amount of attention Arbor’s CLOs have been receiving from the analysts. For those of you interested in learning more but without too much academic jargon, see the article from Crystal Capital Partners “Understanding Collateralized Loan Obligations or CLOs,“ as well as an excellent 2020 study of CLO characteristics and performance in comparison to other debt instruments, including in the period of the Great Financial Crisis, from Ares Management.
Since reading these materials from those third parties, I have realized what a powerful and superior instrument CLOs are and how much it matters to invest in a seasoned CLO manager, which Arbor seems to be. The very fact that after having performed the biggest in the company’s history CLOs in Q4 202, Q1 & Q2 2022 (of $2.1B, $2B and $1B, respectively), Arbor management has decided not to return to the use of CLOs for the foreseeable future (next 6-9 months), in a testament to their disciplined approach. The clear message in Q2 earnings call was they that did not need new ones any longer and they don’t do things that don’t need to be done. Not only that – those who are starting now to get into CLOs are actually getting worse conditions and locking into more and more unfavorable conditions.
Ivan Kaufman explained in the Q2 call:
If you’re watching the market, you have many of our competitors trying to access CLO debt because they’re out of balance relative to their bank lines to the CLO debt and are executing to horrendous levels on profitable levels. My comment is basically that we don’t need to access CLO debt. We have the right proportions. We have these embedded low-cost structures in place that gives us a huge competitive advantage. So we’re sitting back and saying, we’re the last one to get the best execution in the market on a $1 billion CLO debt, and we’re not in a position where we’re forced to reaccess that. So we’re in one of the best positions in the market. So that’s kind of where that comment or narrative was based towards. […] if you follow the people who have had to execute, they’ve had to lock in returns that are just unacceptable.
In the Q3 call, Kaufman actually painted a picture where Arbor can benefit from the competitors’ getting into trouble due to greediness, bad timing, and lack of skills with this instrument:
I think there’s going to be a liquidity squeeze. I think people got a really, really aggressive on the originations even late in the cycle. When we were backing off nine months ago, people were thinking that was an opportunity to gain market share. And I think that was a real mistake. I think a lot of people have never managed CLOs before don’t have asset management skills. And I think there could be some real opportunities.
We’re in a period now of capitulation, on cap rate changes in values and rent growth. It’s interesting that we spoke about it on this call. We’ve been speaking about it for nine months. Everybody’s been looking at us like we’re nuts. And I definitely think we’ve had a different view than everybody else. There’s a bit of a catch up. So, I think that will occur. I think there’s going to be plenty of trouble with the people who have been extraordinarily aggressive the last nine months.”
For us to understand, CLOs allow Arbor to access low-cost debt to invest in the loans, bringing higher spreads thanks to the rising interest rates. While adjusting the underwriting guidelines and working with borrowers (many of them being multi-transaction long-term relations) on strengthening structural enhancements, like interest reserves and necessary replenishments, so that both parties succeed, Arbor takes care of both sides of CLOs’ equation and reaps benefits in the form of increasing spreads and ROE. What transpires from the management’s communication, is that Arbor does not strive to increase its portfolio – it strives to grow its returns thanks to the low-cost debt the company managed to lock in.
With regards to cash position and liquidity, in Q2 and Q3 Arbor sold some positions (loans and investments), some of them by taking a loss. As of Q3, Arbor has a $600M cash position, getting ready for offensive action at the bottom of the upcoming correction. The company does not shy from taking over and managing real estate whose owner might become insolvent and go bankrupt. On the fundamental level, the renters will get more into “economic vacancy” by failing to pay on time. For rental owners, the Eldorado of ever-growing rent rates should be soon over, which should put a brake on short-term flipping and cause the loan run-offs to dry out, too.
What about interest rate growth?
Impact of interest rate hikes is net positive for Arbor. With 97% of Arbor’s balance sheet loan book on a floating rate, while 88% of their debt contains variable rates, the company foresees that, all things remaining equal, a 1% increase in rates would produce approximately $0.10 a share of additional annual earnings. The accretive effect was still calculated in Q1 as an additional $0.05 only, but in Q2 call it was already recalculated to $0.10. As rates are predicted to continue to rise, Arbor will also earn significantly more income from large escrow balances from agency business and balance sheet loan book. Approximately $2B in escrow balances are now earning almost 3% of around $60M annually, effective November 1st, which is up significantly from a run rate of approximately $25M annually on June 30th. See the “old” numbers from the Q2 presentation with the mentioned $25M compared to escrow revenue growth YoY.
Diversified income streams (Q2 2022 results – Arbor IR site)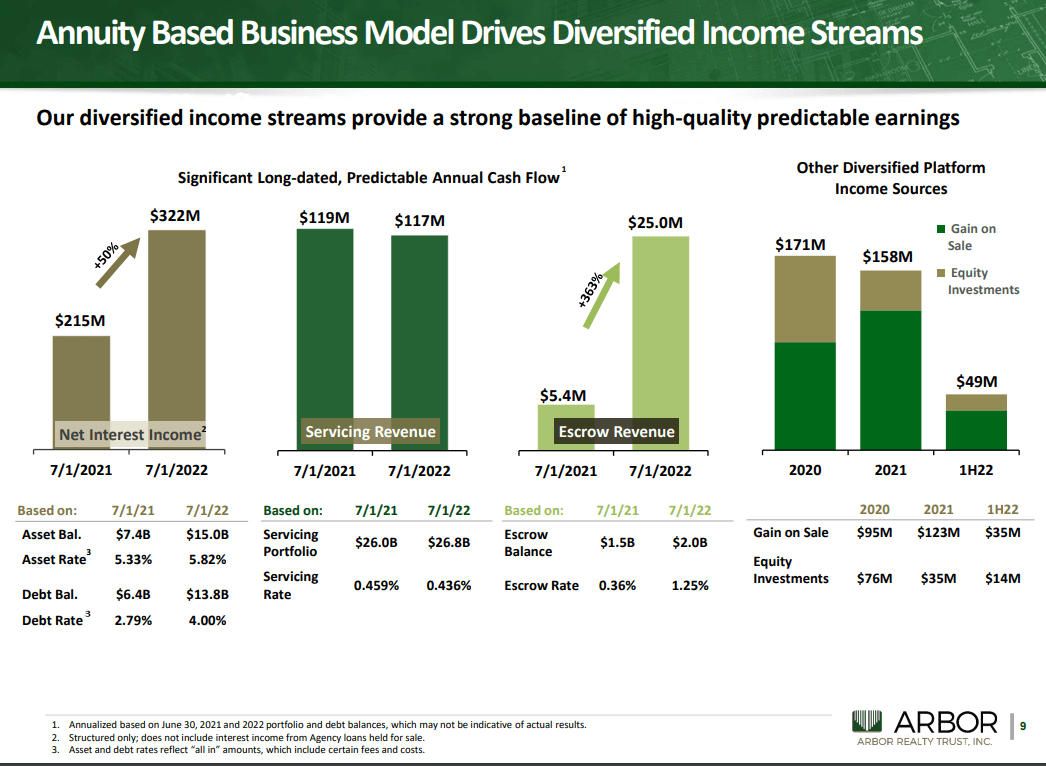
Technical analysis
On the monthly Heikin Ashi chart, you can distinguish two technical signals of a probable trend reversal: the beginning of the new green candle for the month of November as well as the bouncing of CIDI (Composite Index Divergence Indicator) which is also on the verge of crossing above its fast moving average (green line). As for DMI (Directional Movement Index), its positive directional movement line (+DI, blue line) is making a slow flattening move still below the negative directional movement line (-DI, orange line), possibly to move upwards in the matter of next few months. Monthly MACD is still below its signal and oscillates around zero level. On the chart itself, the blue line of the 10-month Moving Average is still above the red line of the 50-month MA.
Monthly chart (TradingView)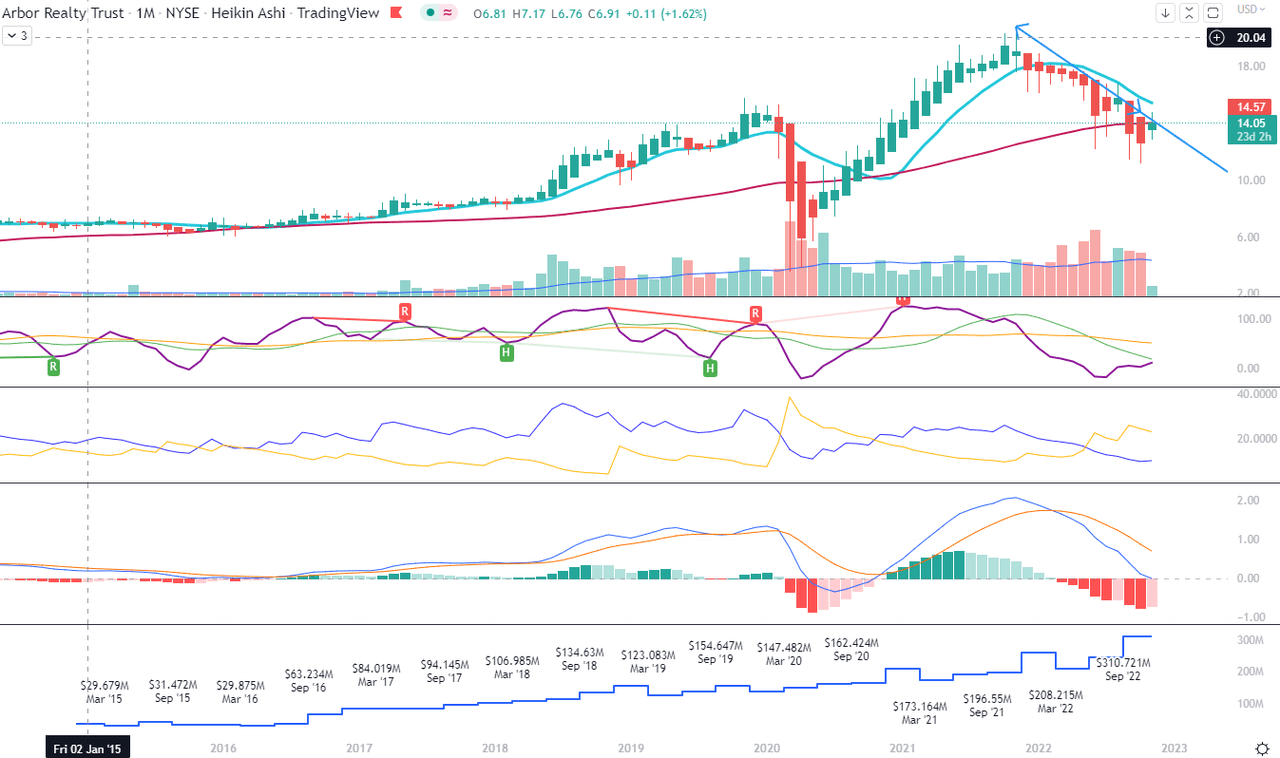
On the weekly chart, also Heikin Ashi, we can see that CIDI has boldly moved above both slow and fast averages. Also, the weekly MACD crossed above its signal, but both these lines are below zero level. The DMI numbers are also still not confirming a return of uptrend. This timeframe is not very convincing, as if it waited for a push.
Weekly chart (TradingView)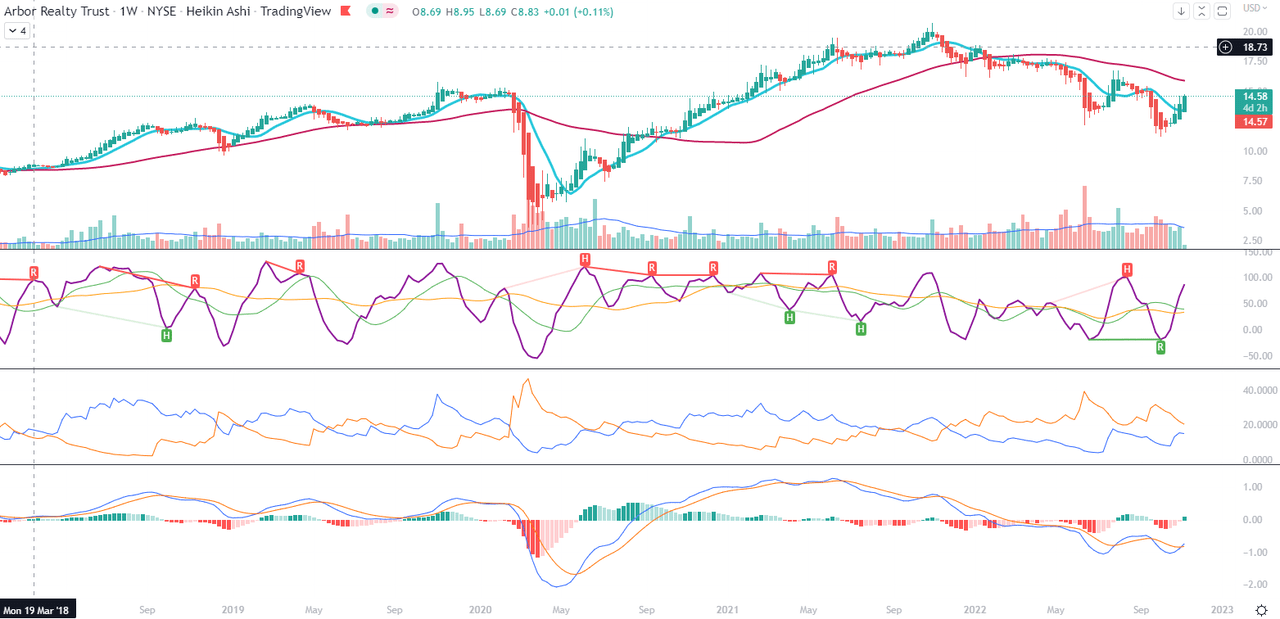
The daily Renko chart is much more interesting. Not only does the Renko box cross over 10-box Moving Average precisely in the place where the same Renko box crosses over the trend line, not only is CIDI crossing above its both averages and DMI has made a sharp upturn, but also Renko MACD is on the verge of crossing above its signal while still in the negative territory. As you can see, the last two times the same type of crossing by MACD happened were in April 2009 and April 2020. What happened then? The stock bottomed and bounced back. This is just technical analysis, I know.
Daily Renko chart (TradingView)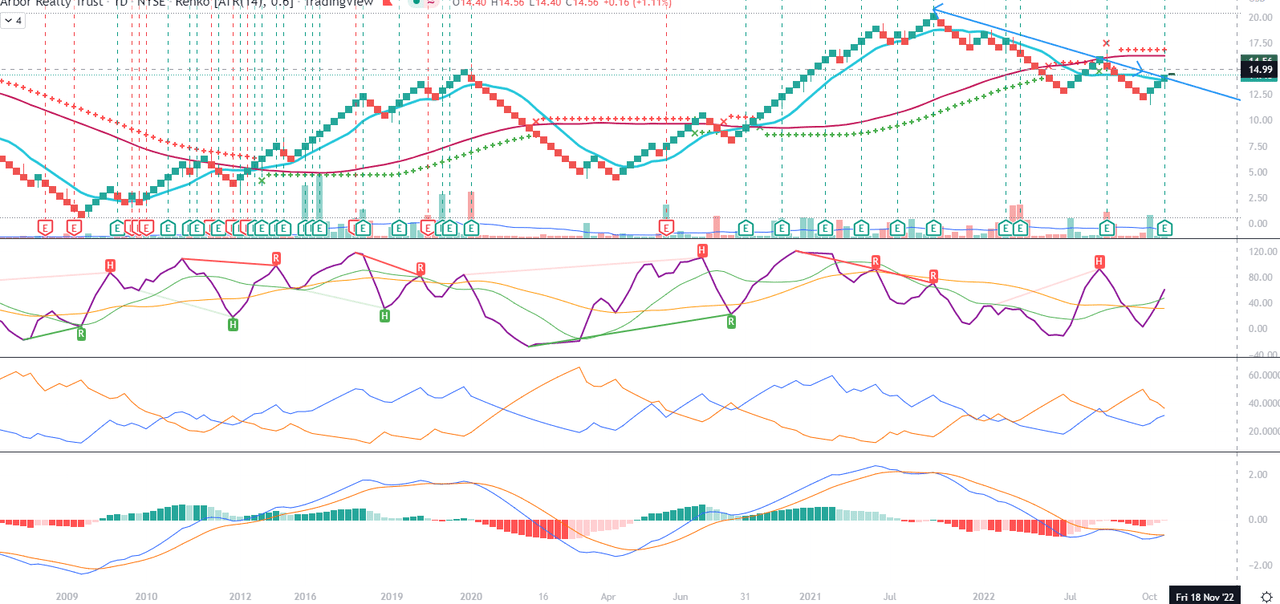
Conclusions
Since my first article about Arbor Realty in January 2022, I have added to my position twice. The last time was last week, a day before earnings. I love the results of the company, the discipline and cold blood of the management, and the fact that Arbor Realty is a niche player with beautiful returns for investors. Of course, I suggest doing your own due diligence before investing in any stock.
Be the first to comment