

Bogdan Kurylo/iStock via Getty Images
Thesis
Depending on your love (or the lack of) for shopping, searching for the perfect Christmas gifts can range from an enjoyable relaxation to a source of agony. In our son’s case this year, our job is made easier. We (wife, son, and myself) all agreed on a few extra shares of Apple Inc. (NASDAQ:AAPL) into his Uniform Transfers To Minors (“UTMA”) account (in addition to a pair of Nike shoes, of course).
Thanks to the recent market volatilities, AAPL is now for sale at 21.7x forward P/E ratio (or about 22x P/E) as seen below. It is not only near the bottom level in about 3 years (as you can see from the following chart) but also near what I call the no-brainer level for high-quality compounders like AAPL, as explained in my earlier article, because:
To me, any P/E near 20x is very attractive for a stock with ROCE (return on capital employed) near 100% like AAPL. At about 100% ROCE, a 5% investment rate would provide 5% organic real growth rates (i.e., before inflation adjustments). And a ~20x P/E would at least provide 5% of earnings yield in AAPL’s case, leading to a total return in the double digits.
In the remainder of this article, I will elaborate on two details (both highlighted above) that many readers asked about: A) why I said a 20x P/E ratio provides “at least” 5% of earnings yield; and B) why I mentioned “in AAPL’s case” also. Shouldn’t a 20x P/E ratio ALWAYS provide a 5% earnings yield (because 1/20 = 5%)?
The answer lies in the difference between accounting earnings and owners’ earnings. For most businesses, accounting earnings and owners’ earnings are different, and the discrepancy can be quite large. As a result, the true owners’ earnings yield can be very different from the inverse of the P/E ratio (which is often based on accounting earnings). And next, we will see that in AAPL’s case, the accounting EPS underestimates its owners’ earnings. And hence, its true earning yield is better than what’s on the surface.
Source: Seeking Alpha data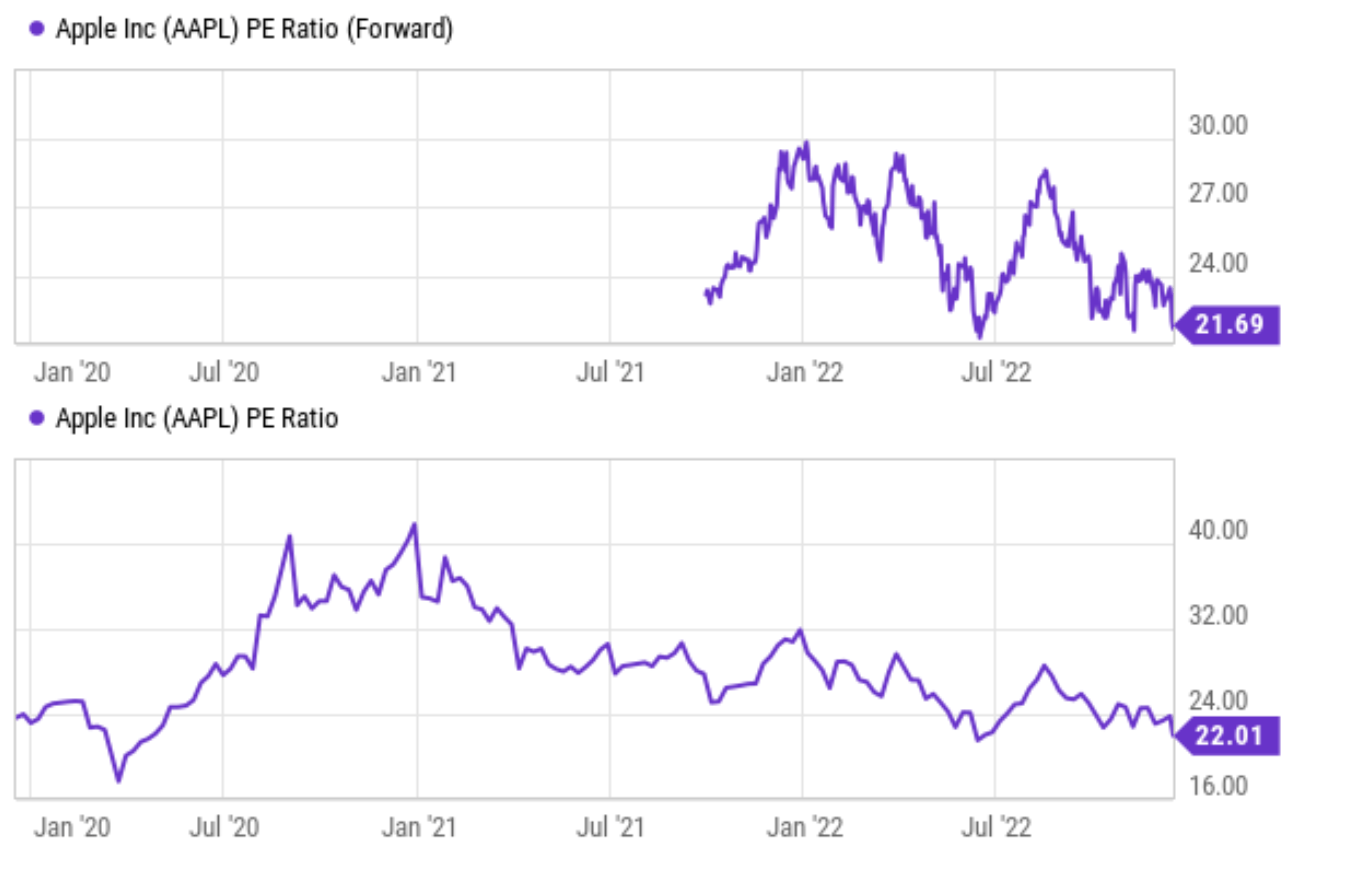
AAPL and our UTMA
Let’s first take a look at quick look at our holdings in our UTMA account. The general information about the UTMA account has been detailed in our blog article here. Key motivations in our case included: the tax advantages, seed funds for our kid, and also an account to seek long-term growth. Our current holdings are shown below (first chart below) together with their performances (second chart below). A few notes:
- For performance tracing purposes, I used the prices on July 11, 2022 (the date I first published this portfolio) on SA as the entry price. So, it’s easier for readers to verify and track its performance.
- Our actual portfolio size is substantially smaller. The $100k starting size used here is just to simplify the math.
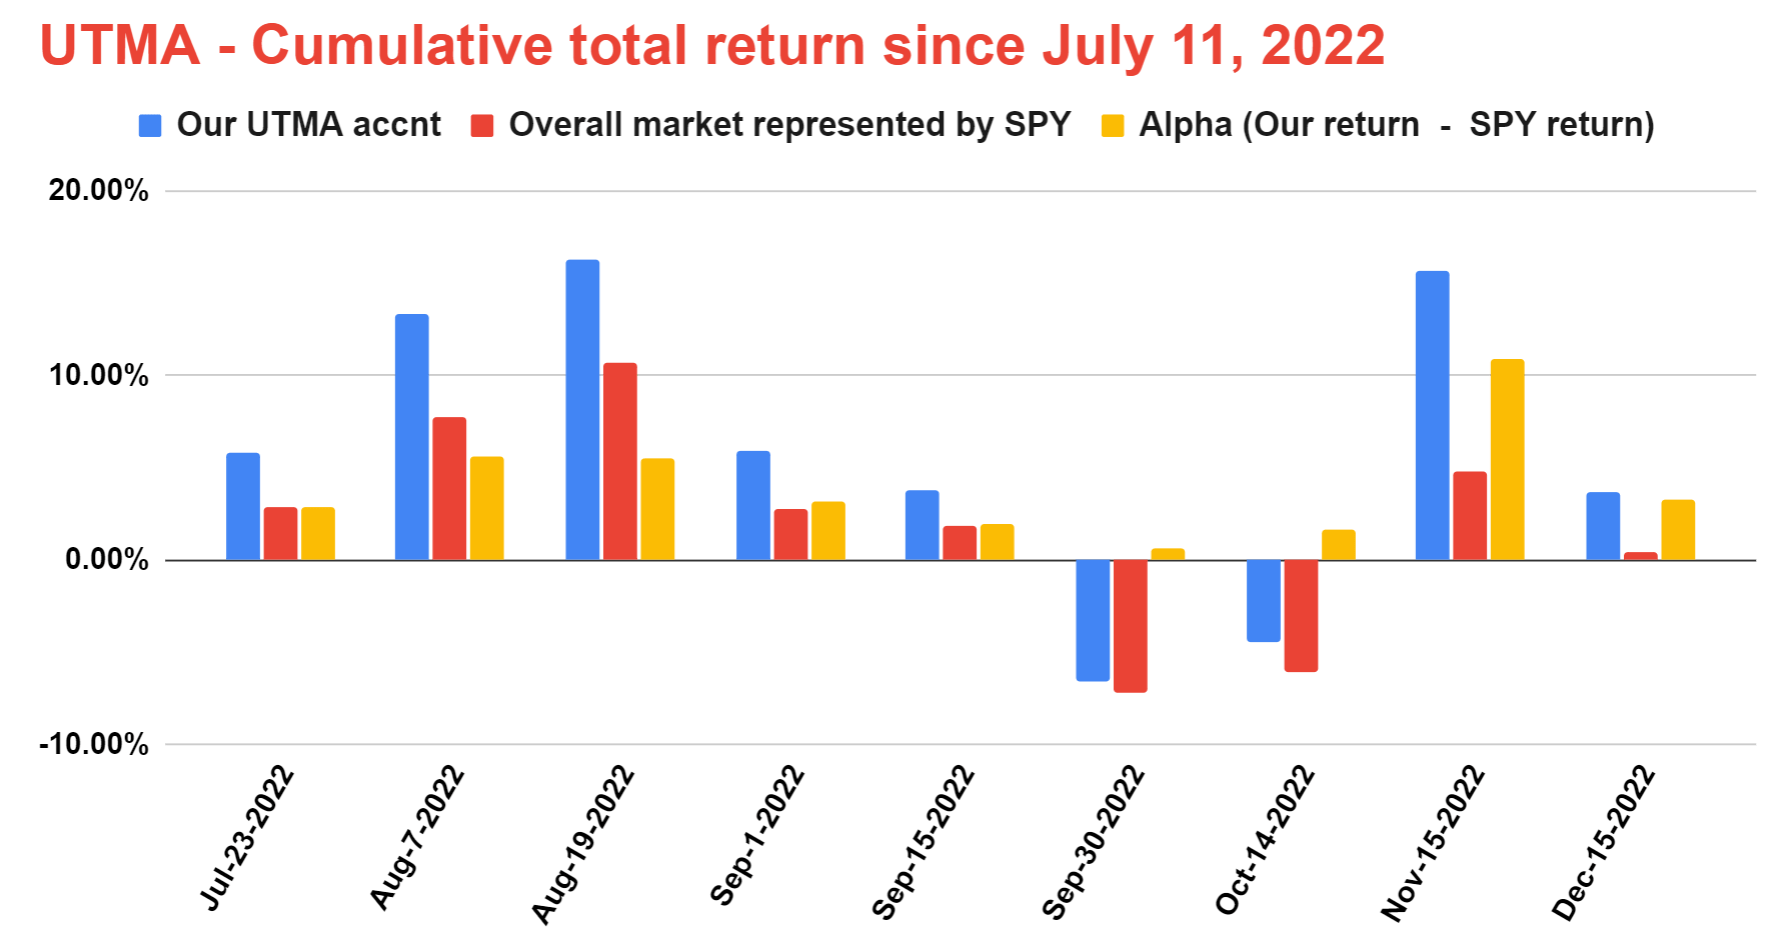
As seen, AAPL currently represents about 15% of our total assets in this account. It suffered a price loss of 6.9% since July 11. As seen in the second chart, the UTMA account has always outperformed the S&P 500 index (approximated by the SPY ETF) despite (probably because of) the concentrated holding of 6 stocks. The account is leading the market by a margin of 3.3%.
Source: Author based on Seeking Alpha data Source: Author based on Seeking Alpha data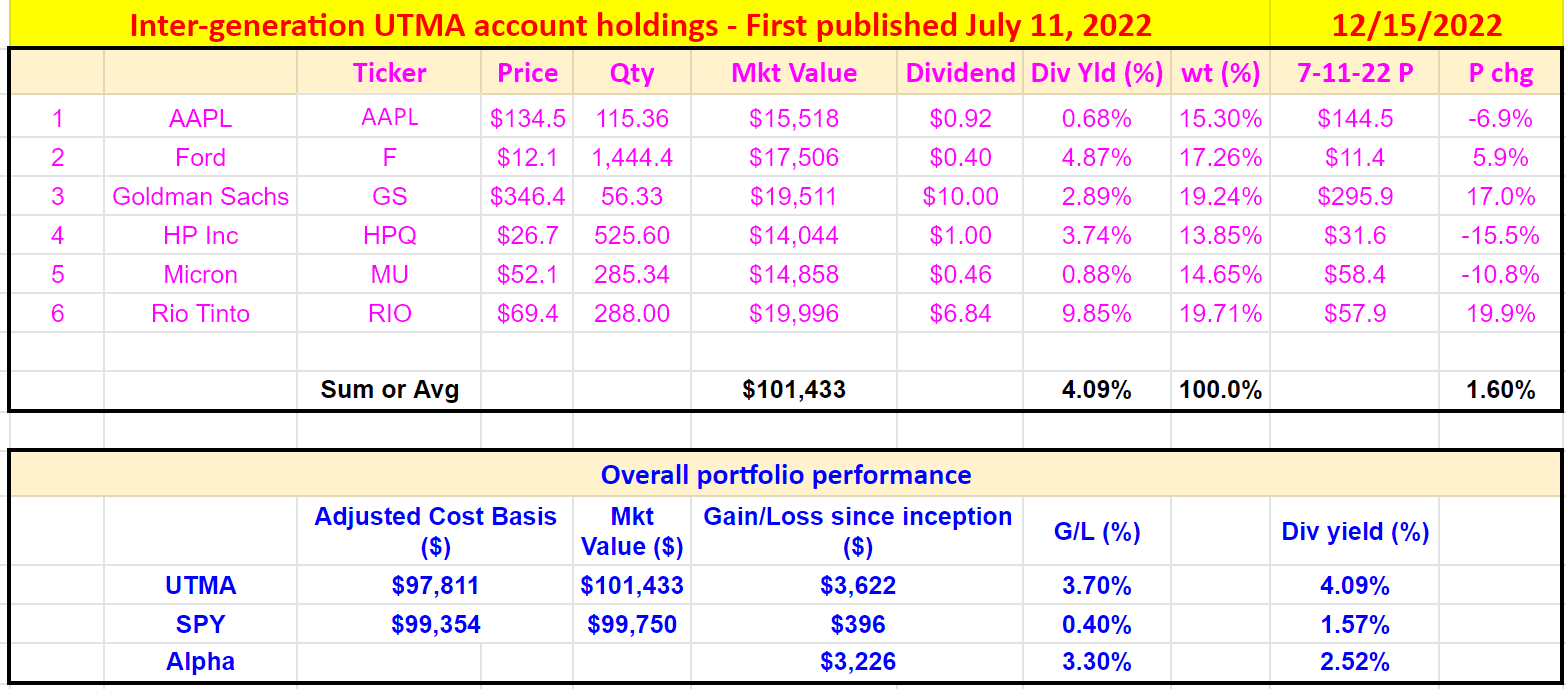
AAPL’s account EPS underestimates its owners’ earning
Now, let’s examine AAPL’s owner earnings (“OE”) more closely and see why it is higher than its accounting EPS. And the final results are summarized in the table below. As seen, at the price as of this writing ($134.5), AAPL’s accounting EPS for 2022 is about $6.11 and $6.25 for FY1, resulting in a P/E of 22x and FW P/E of 21.5x. Note my FW EPS projection is a bit higher than SA’s, hence the FW P/E of 21.5x is slightly lower than the 21.7x provided by SA above. However, in terms of OE, the P/E is only 18.7x and 18.4x on an FW basis. And if you further adjust the cash position on its ledger, the P/E further shrank to 18.4x for 2022 and 18.0x on an FW basis, hence providing more than 5% of owners earning yield as aforementioned. An 18x P/E translates into an annual owner-earning yield of 5.55%.
The key difference between the OE and the accounting EPS lies in the CAPEX expenses. The CAPEX includes both the maintenance CAPEX (which is a cost and should be subtracted) and the growth CAPEX (which is not a cost and shouldn’t be deducted).
My analysis shown in the table below is a delineation of AAPL’s maintenance CAPEX and growth CAPEX using Bruce Greenwald’s method. More details of this method can be found in our earlier article or in Greenwald’s (Value Investing). In the end, AAPL’s OE is about $7.18 per share for 2022 and $7.33 for FY1, both higher than its accounting EPS.
Note that the so-called FCF/EPS ratio provides a shortcut in many cases. You can often tell if the OE is larger or smaller than the accounting EPS by simply calculating the FCF/EPS ratio. In Apple’s case, as you can see, the FCF/EPS ratio is 113%, higher than 100%. And bear in mind that the FCF already underestimates the true OE, because, in the calculation of the FCF, ALL the CAPEX is deducted. So, in the end, the EPS must underestimate its true OE even more than the FCF.
Source: Author based on Seeking Alpha data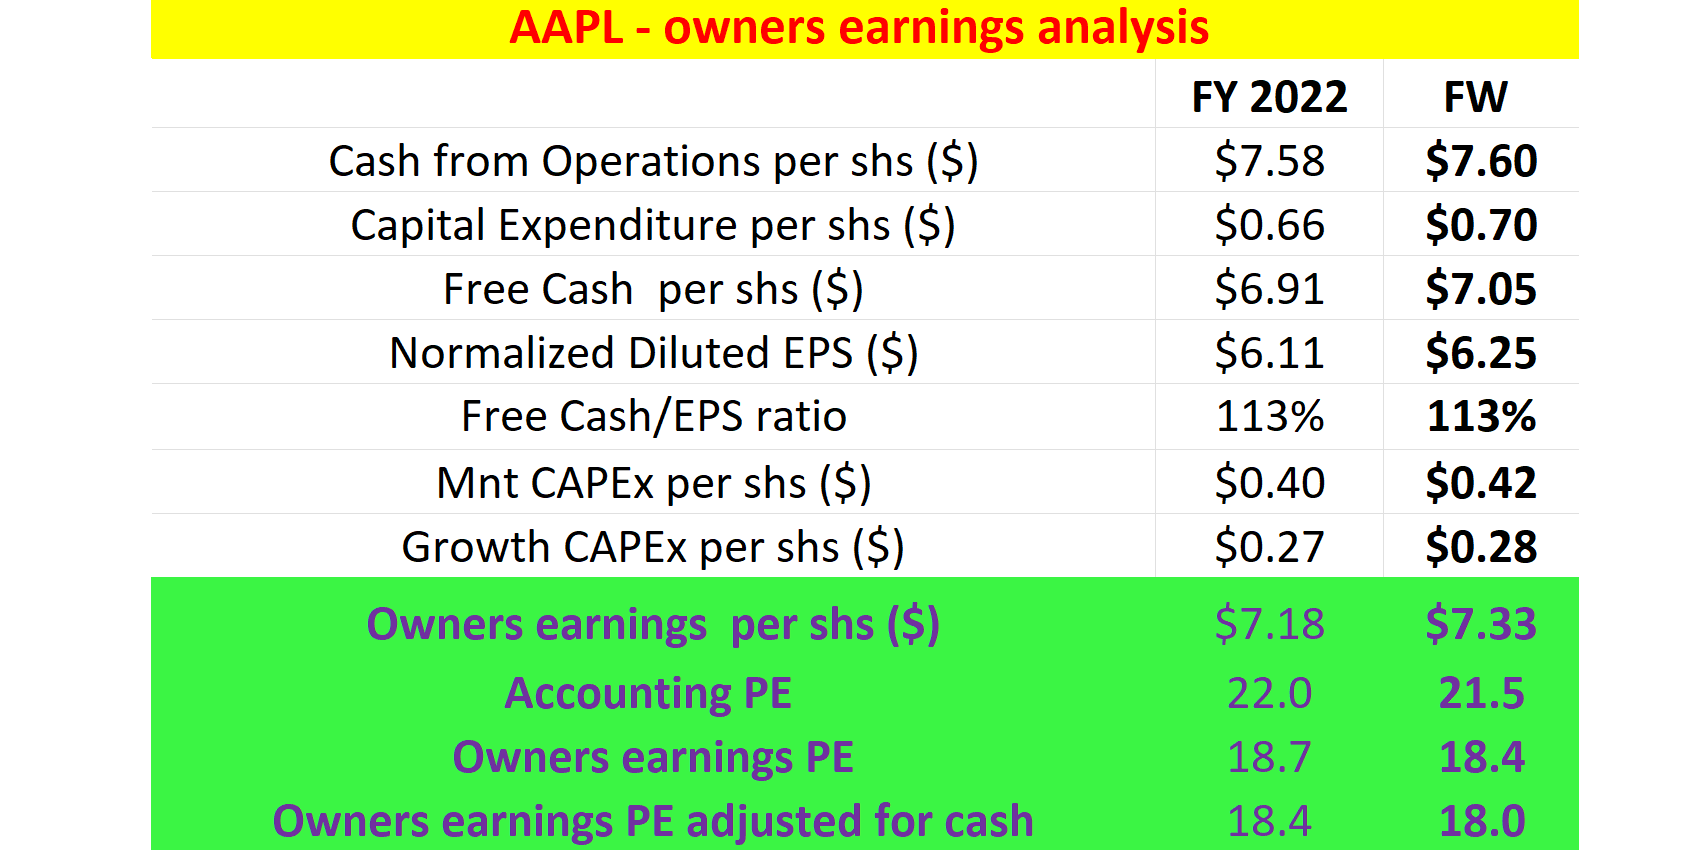
Total expected returns
To recap, at its current price, its P/E on OE basis is around 18x, translating into an owner-earning yield (“OEY”) of ~5.5% as aforementioned. As detailed in my earlier articles, the ROCE (return on capital employed) of AAPL is on average 100% in recent years. As a result, even a 5% investment rate would provide 5% organic real growth rates (100% ROCE * 5% reinvestment rate = 5% organic growth rate).
Combining the OEY and growth, the total return is expected to be earlier in the double digits, far exceeding that of the overall market. The S&P 500 is currently trading at ~20x P/E ratio, resulting in an OEY of about 5%. And its ROCE is ~20% or so. Thus, assuming the same 5% reinvestment rate, its growth rate would be about 1%, resulting in a total return of ~6% only.
If the reinvestment rate is higher than 5% (e.g., due to acquisition opportunities or new initiatives), the outperformance from AAPL over the general market would be even more dramatic, again as illustrated in the chart below.
Source: Author based on Seeking Alpha data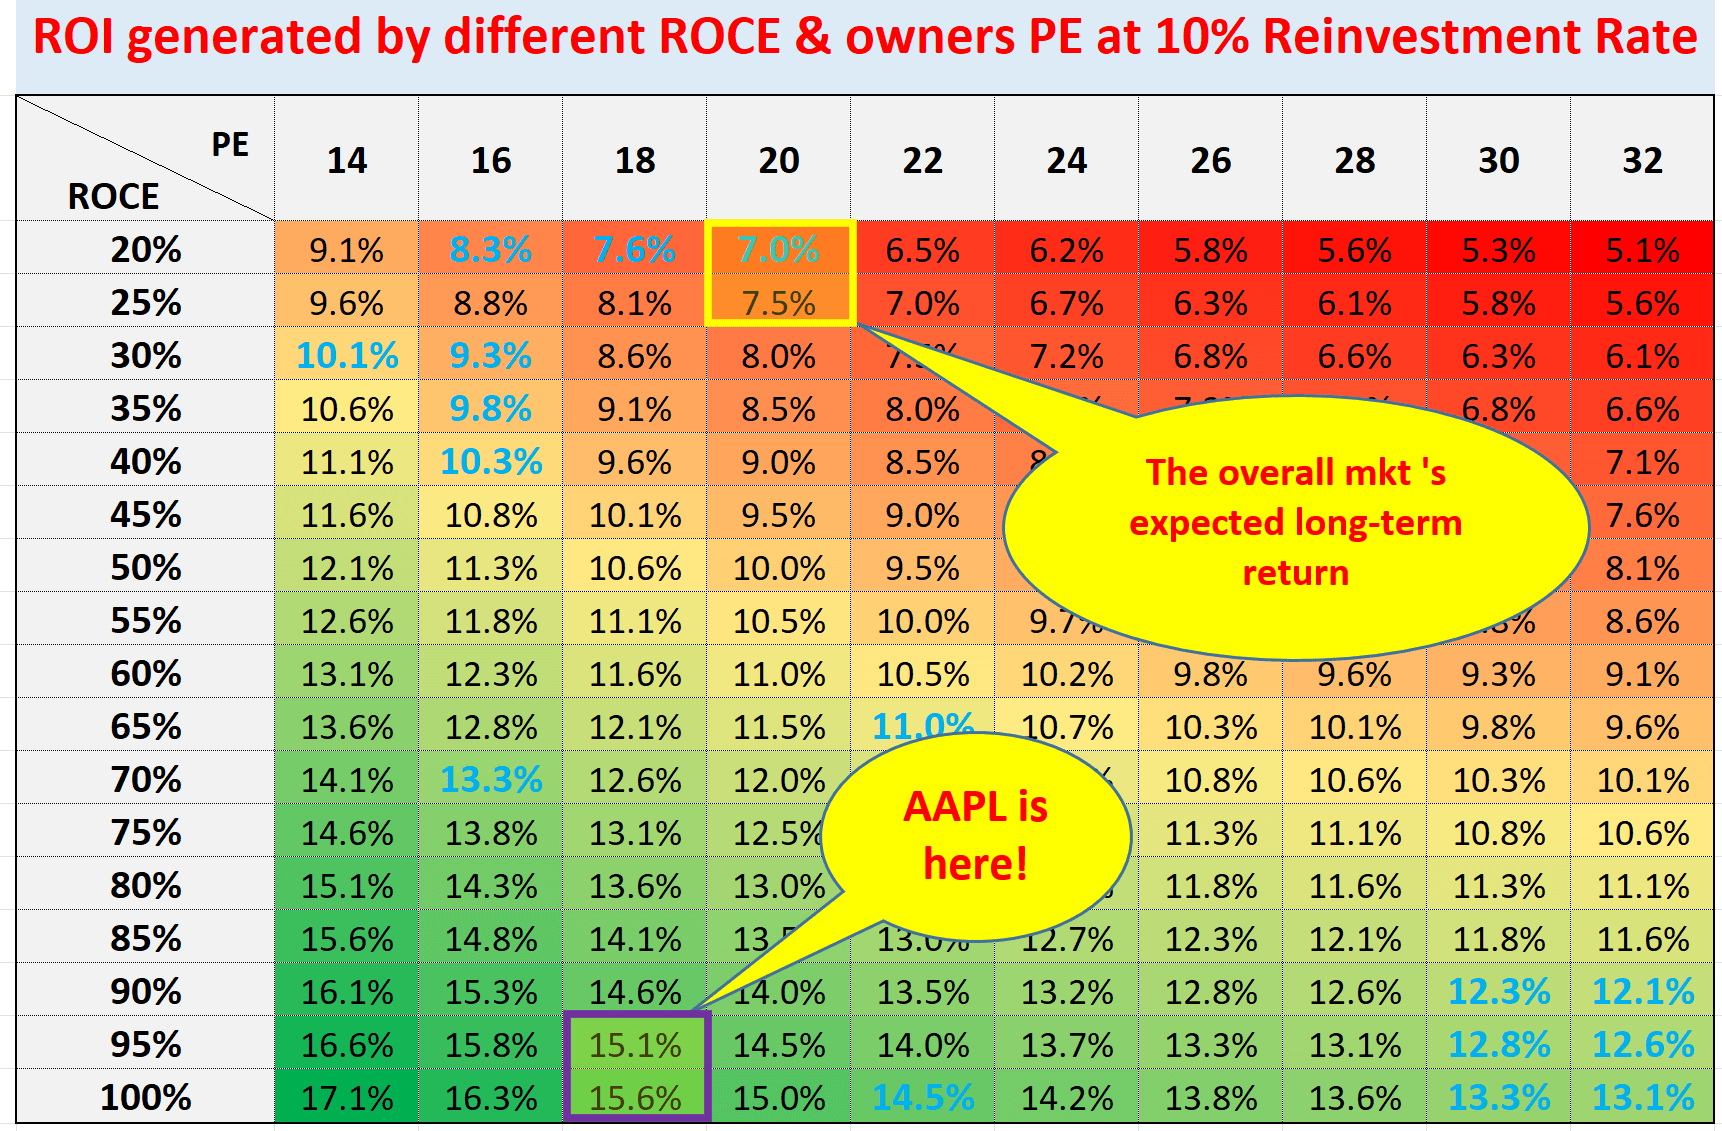
Risks and final thoughts
There are both upside and downside risks to my above analysis. My analysis is more focused on the AMOUNT of the earnings and neglected the QUALITY of the earnings. When the quality of the earnings is adjusted, the investment is even more appealing. The company has displayed remarkable resilience in the face of the difficult operating backdrop. Meanwhile, its services-related revenues should continue to advance, making its income even more diversified and recurring. Of course, for downside risks, the company is facing many macroeconomic and operational uncertainties. The uncertainties include the drag from foreign exchange rates, supply constraints, and the fluid COVID situation. Its bottom line is facing some pressure due to rising costs, as well as COVID-19-related lockdowns in China, a key end market, and also a production site for AAPL.
Altogether, AAPL is now in a no-brainer zone for me. Any P/E ratio below 20x with AAPL’s ROCE is very likely to generate double-digit annual returns in the long term combining the earnings yield and the growth rate. In AAPL’s case, its accounting EPS underestimates its owners’ earnings substantially. And hence, its true earning yield is better than what’s on the surface. To wit, in terms of OE, AAPL’s current FW P/E is 18.4x. After adjusting the cash position, the P/E becomes 18.0x only, translating into an OE yield of 5.5%. In terms of growth, a 5% reinvestment rate would provide 5% organic growth rates and lead to a total return exceeding 10% per annum.
Merry Christmas!
Be the first to comment