

undefined undefined
The investment thesis
I am a big fan of Apple Inc. (NASDAQ:AAPL) as I use many of its products on a daily basis. The iPhone, Mac, Airpods, Watch etc. have become basic necessities of life over recent years. Lately, Seeking Alpha’s Apple stock page has caught my attention as more and more bearish articles are being published. This has made me think about the future of the company and the stock.
On one hand, there is this company with excellent financial performance, an enormous investor base (including Berkshire Hathaway (BRK.A), (BRK.B)), the most valuable brand according to Forbes, and an unparalleled ecosystem offering wide moats. On the other hand, growth is slowing down and, especially in the current macroeconomic environment, valuation is becoming an issue.
In this article, I will present to you my bull case and bear case. The bull case assumes that recent financial performance will continue in the future. In the bear case, I assume that revenue growth will slow down. Next, I will substantiate why I think that the bear case is the most likely scenario given the current available information. Selling Apple stock has never been a good advice during the last decade, so I give Apple stock a ‘hold’ rating. However, I recommend investors to wait for better opportunities before adding more shares.
The bull case
Stellar financial performance over recent years
Apple has divided its business into five segments: (1) iPhone, (2) Mac, (3) iPad, (4) Wearables, Home, and Accessories, and (5) Services. All these segments have shown stellar performance over recent fiscal years, as presented in the following table.
|
FY Revenue ($ billion) per segment |
2017 |
2018 |
2019 |
2020 |
2021 |
4Y CAGR |
|
iPhone |
$139.3 |
$164.9 |
$142.4 |
$137.8 |
$192.0 |
8.4% |
|
Mac |
$25.6 |
$25.2 |
$25.7 |
$28.6 |
$35.2 |
8.3% |
|
iPad |
$18.8 |
$18.4 |
$21.3 |
$23.7 |
$31.9 |
14.1% |
|
Wearables, Home, and Accessories |
$12.8 |
$17.4 |
$24.5 |
$30.6 |
$38.4 |
31.6% |
|
Services |
$32.7 |
$39.7 |
$46.3 |
$53.8 |
$68.4 |
20.3% |
|
Total |
$229.2 |
$265.6 |
$260.2 |
$274.5 |
$365.8 |
12.4% |
Source: Company filings
The iPhone is by far the largest product category in terms of revenue, but also the slowest growing category (together with the Mac). 8.4% growth on average is obviously very good given the though comparables, but the iPhone segment is subject to cyclicality shown by the drop in sales between FY2018 and FY2020. Luckily, Apple has some aces up its sleeve with their Services and Wearables, Home, and Accessories products. These categories have been growing at a staggering 31.6% and 20.3% on average over the last four years. Even iPad performed very well with a mid-teens CAGR.
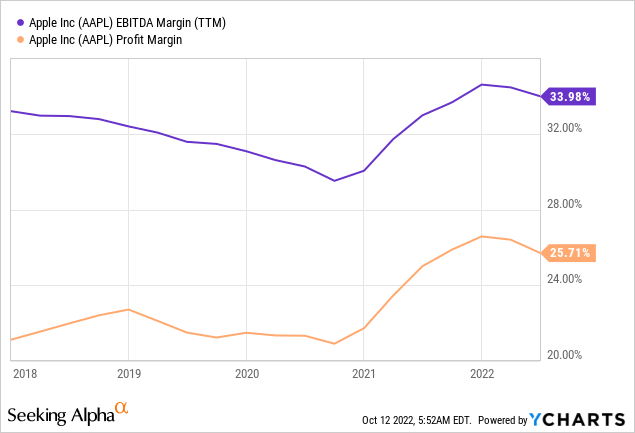
Especially Apple’s Services segment is considered very important as it is mainly subscription-based. We know the subscription-model from companies like Adobe Inc. (ADBE) and Microsoft Corporation (MSFT) which have achieved huge margins and very dependable recurring cash flows. Apple also generates cash flows with great margins from its offered services, which is clearly visible in the financials. While Apple’s product segments had a gross margin of 35.3%, the Services segment had a gross margin of 69.7% in FY2021. Given the steady growth runway, Services are essential for Apple’s future bottom line growth. The Services segment has become more and more important for Apple’s total revenue every year, growing from 14.3% of total revenue in FY2017 to 35.6% in FY2021. As a result, Apple’s overall margins have improved substantially over the years (see following graph).
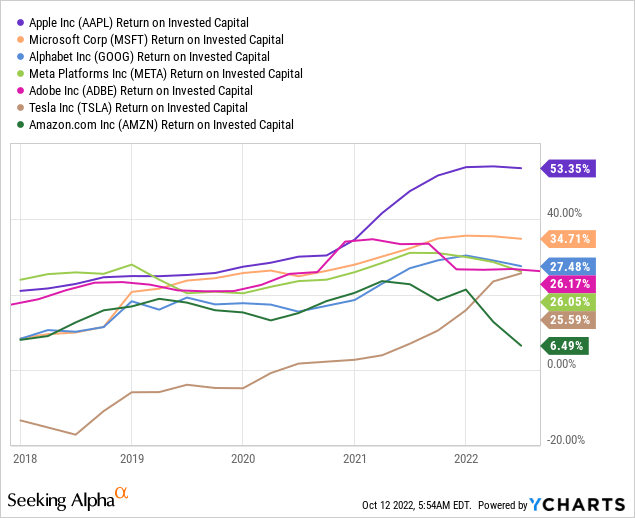
Apple is also doing an amazing job in effectively and efficiently reinvesting capital back into its business. The next chart is showing the ROIC development for some of the major tech companies: Microsoft Corporation, Alphabet Inc. (GOOG), Meta Platforms, Inc. (META), Adobe Inc., Tesla, Inc. (TSLA), and Amazon.com, Inc. (AMZN). Especially over the last two fiscal years, Apple has achieved by far the highest ROIC. It has even been outperforming Microsoft Corporation and Adobe Inc., two major players in subscription-based business models.
The huge cash flows and high ROIC have enabled Apple to return a lot of capital to shareholders. It has returned no less than $686 billion in the form of buybacks and dividends from FY2012 to recent Q3 FY2022. Thus, shareholders have been awarded greatly for holding shares of Apple.
Attractive valuation if growth continues
Apple has grown its total revenue with a CAGR of 12.4% from FY2017 through FY2021. Let’s say that revenue will continue to grow by double digits and margins will keep expanding as Services become an even more dominant part of total revenue. A free cash flow CAGR of 12.0% is not unlikely in that scenario. In the following, I will perform a Discounted Cash Flow (or DCF) Analysis with a 10.0%-14.0% free cash flow growth bandwidth over the next 10 years (12.0% as a midpoint). Next, I assume a bandwidth between 2.0% and 4.0% for the perpetuity growth rate. My personal objective is to buy stocks which could potentially give a 10.0% return on investment. This gives us the following inputs:
|
Input |
Value |
|
First year of projections |
2022 |
|
Personal Required rate of Return |
10.0% |
|
Number of shares outstanding |
16.07 billion |
|
Base free cash flow (fiscal year 2022) |
$93.0 billion |
|
Free cash flow growth rate for next 10 years |
10.0% / 11.0% / 12.0% / 13.0% / 14.0% |
|
Growth rate in perpetuity |
2.0% / 2.5 / 3.0% / 3.5% / 4.0% |
Source: Author, company filings
In the following table, it can be seen that Apple shares are very attractive at the current price ($138.98) if you accept a 10.0% ROI. At the mid-point assumptions, the stock is actually quite undervalued with a fair value of $171.52. If the mid-point scenario plays out, this would imply a 23.4% upside – nothing wrong with that.
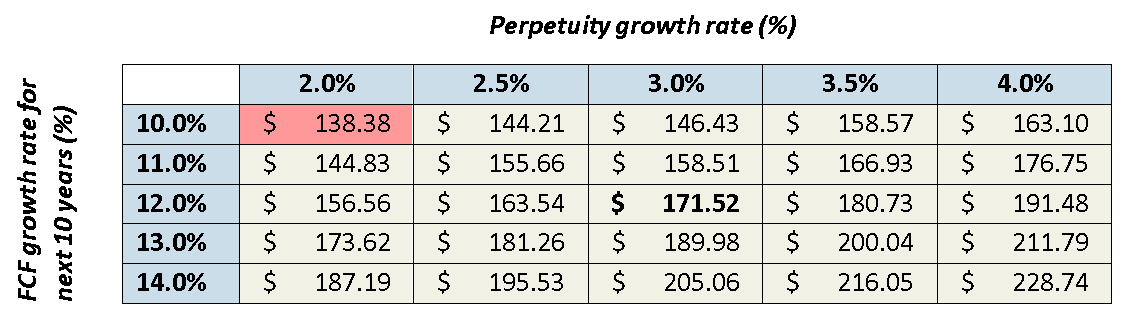
DCF analysis for the bull case (Author)
The bear case
Growth can slow down – also at Apple Inc.
According to the bull case, Apple stock is attractive if recent growth continues. But that’s a big if. Taking a closer look at revenue development between FY2021 and FY2017, it can be observed that the jump between FY2020 and FY2021 of 33.3% has been mainly responsible for the double-digit revenue CAGR. Between FY2017-FY2020, revenue grew with a 6.2% CAGR – still decent, but not the double-digit growth I assumed in the bull case DCF analysis.
So, what was the last time that revenue made such a big leap? Therefore, we have to go back to FY2015. Between FY2014 and FY2015 total revenue grew 27.8% YoY. Looking at the following years, revenue grew from $233.7 billion in FY2015 to $274.5 billion in FY2020 with only a 3.3% CAGR. I obviously have been selective by taking this time period, but I just want to show that also for a wide moat company like Apple growth can slow down. On the positive side, the revenue mix was different back in FY2015 – iPhone was responsible for a higher share of total revenue (66.3% in FY2015 versus 52.5% in FY2021). Services revenue is now a larger portion of total revenue and way more stable compared to the more cyclical nature of smartphone sales. Still, Services growth cannot fully compensate a possible fall in iPhone sales. Thus, it is only logical that after a 33.3% jump with a gigantic revenue base, growth will slow down.
Poor valuation if growth slows down
Next, I calculate the fair value for Apple stock if revenue indeed slows down like it did in the past. Let’s say revenue will continue to grow at mid-single-digits on average and the Services segment outperformance continues to drive overall margins higher. I therefore think that a 6.0% free cash flow CAGR offers a good mid-point (just for the reference: between FY2015 and FY2021, free cash flow grew with a 4.8% CAGR). Now I perform the same DCF Analysis as I did previously, but now with a 4.0%-8.0% free cash flow growth bandwidth over the next 10 years (6.0% as a midpoint). This gives the following results:
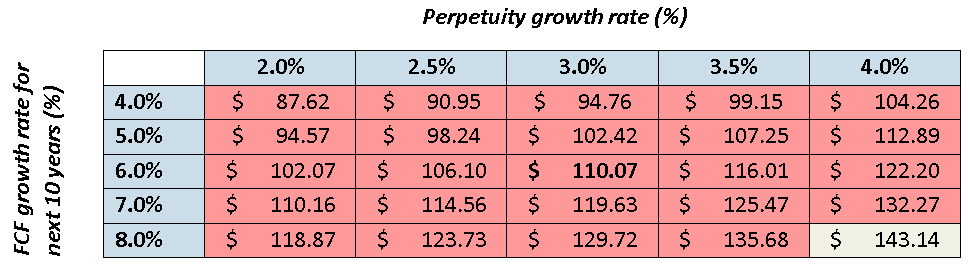
DCF analysis for the bear case (Author)
The mid-point fair value is $110.07 per share for a 10.0% ROI. In this scenario, Apple shares would be significantly overvalued as the current price is around 20.8% above this fair value.
Why I think the bear case is most likely
The current stock price is roughly between the bull case and bear case mid-point fair values. As I said in the investment thesis, I believe that the bear case scenario is most likely to happen based on the currently available information. In the following, I will provide arguments for my standpoint.
- The law of large numbers: as companies grow bigger and their products and services mature, growth is likely to slow down. Each percentage of revenue growth represents a larger number of revenue every year. Over FY2021, Apple’s total revenue came in at $365.8 billion which is a huge amount of money. Keeping up double-digit growth would require tens of billions in additional revenue per year.
- Weaker consumer demand: with inflation skyrocketing, consumers may be forced to cut on discretionary spending. Smartphones are obviously essential in people’s daily lives, but consumers may prefer to wait one or two years before upgrading to a more expensive iPhone if their older model works just fine.
- Analysts agree with my bear case growth assumptions: if you go to the earnings estimates page on Seeking Alpha, you will see that analysts currently predict mid-single-digit revenue growth and EPS growth over the mid-term. This shows analysts acknowledge that growth has to slow down after years with a double-digit revenue CAGR. Interestingly, valuation multiples are still relatively high considering the predicted growth outlook.
- Share buybacks are likely to slow down in the long-term: Apple has bought back a ton of shares in recent years which has boosted earnings per share growth. Between FY2017 and FY2021, the number of shares decreased with a 5.3% CAGR. During Apple’s earnings call in February 2018, CFO Luca Maestri stated that Apple aims to become cash neutral over time. In Apple’s most recent Return of Capital sheet it can be seen that the net cash position has shrunk from $123 billion in FY2018 to $60 billion in the most recent quarter Q3 of FY2022. The company has not reached the targeted cash neutral position yet, but it is halfway there. This means buybacks will continue, but at a slower rate. In combination with the higher valuation, share repurchases will not contribute to earnings per share as much as they did in the past.
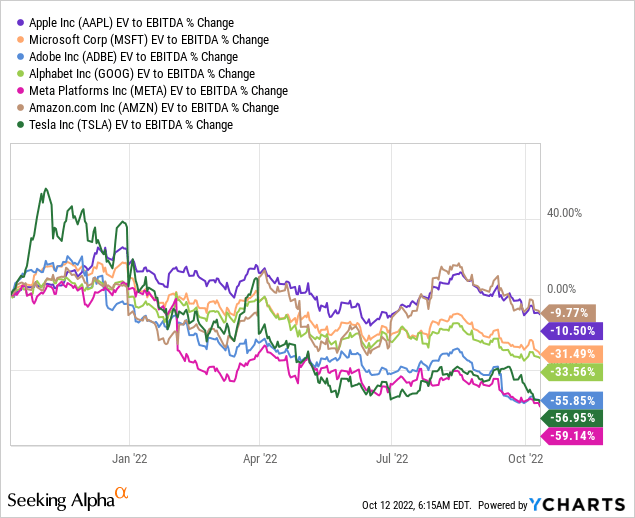
- Rising interest rates, contracting valuation multiples: Nowadays, interest rates are a hot topic in the global markets as rate projections are still on the rise. If rates increase, investors demand a higher return on their investment, which automatically results in decreasing valuation multiples. Taking a look at the following graph, Apple’s EV/EBITDA multiple has contracted significantly less compared to its peers (except for Amazon Inc). This might indicate that multiples have further downside if the financial outlook does not improve.
Upside risk
Like in my other articles on Seeking Alpha, I will address a few risks that come with my thesis. In this case, there are upside risks which may cause the bull case to play out instead of the bear case:
- New products could create new streams of revenue, driving total revenue growth. Back in June Apple announced its next generation of CarPlay software, diving deeper into its automotive ambitions. According to a McKinsey report, the car software market could grow with a 9.0% CAGR through 2030, and Apple could take a significant share of that pie. Moreover, there have been speculations about Apple introducing its own Apple Car in the future. Piper Sandler estimated a potential revenue stream of $50 billion by 2030 assuming a 1% market share. A more concrete possibility is the introduction of the AR/VR headset. According to Apple analyst Ming-Chi Kuo, Apple plans to ship approximately 1.5 million units in 2023. Assuming a sell price of $2,000, this could contribute $3.0 billion to total revenue at the introduction, with further growth in the future.
- Another risk of not buying Apple at the current price levels is that despite the macroeconomic outlook, valuation multiples will stay the same or even expand. As Services become a more and more dominant source of revenue, Apple’s overall margins will keep expanding. Therefore, investors may be willing to pay a higher multiple for the stock.
Final thoughts
Let me stress once again that Apple is an amazing company, and I have nothing against it. The business keeps rolling out great products every year which drive excellent financial performance. If the company can introduce new products and service categories, I believe its moat will keep growing wider.
The point is: I am looking for wide moat businesses at an attractive price, and Apple’s stock price is not attractive for me as of now. I believe that investors should always consider a bear case scenario. By doing so, you automatically keep a margin of safety on your investment. Currently, there is too much discrepancy between the stock price and my bear case fair value. I therefore rate the stock a ‘hold’, and I recommend investors to wait for further downside before adding Apple shares.
Be the first to comment