

Francesco Scatena/iStock via Getty Images
Everyone loves an early inflation. The effects at the beginning of an inflation are all good. There is steepened money expansion, rising government spending, increased government budget deficits, booming stock markets, and spectacular general prosperity, all in the midst of temporarily stable prices. Everyone benefits, and no one pays. That is the early part of the cycle. In the later inflation, on the other hand, the effects are all bad. The government may steadily increase the money inflation in order to stave off the later effects, but the later effects patiently wait. In the terminal inflation, there is faltering prosperity, tightness of money, falling stock markets, rising taxes, still larger government deficits, and still roaring money expansion, now accompanied by soaring prices and ineffectiveness of all traditional remedies. Everyone pays and no one benefits. That is the full cycle of every inflation.
– Jens O. Parsson from Dying Of Money
Introduction
After turning pound-the-table bullish on Apple (NASDAQ:AAPL) shares in May of 2016 with the public article on Seeking Alpha titled, “Apple: Cheapest Valuation In A Decade,” I started to turn bearish the last couple of years. First, let’s take a visual look back at the outperformance of Apple shares since that May 13, 2016, article.
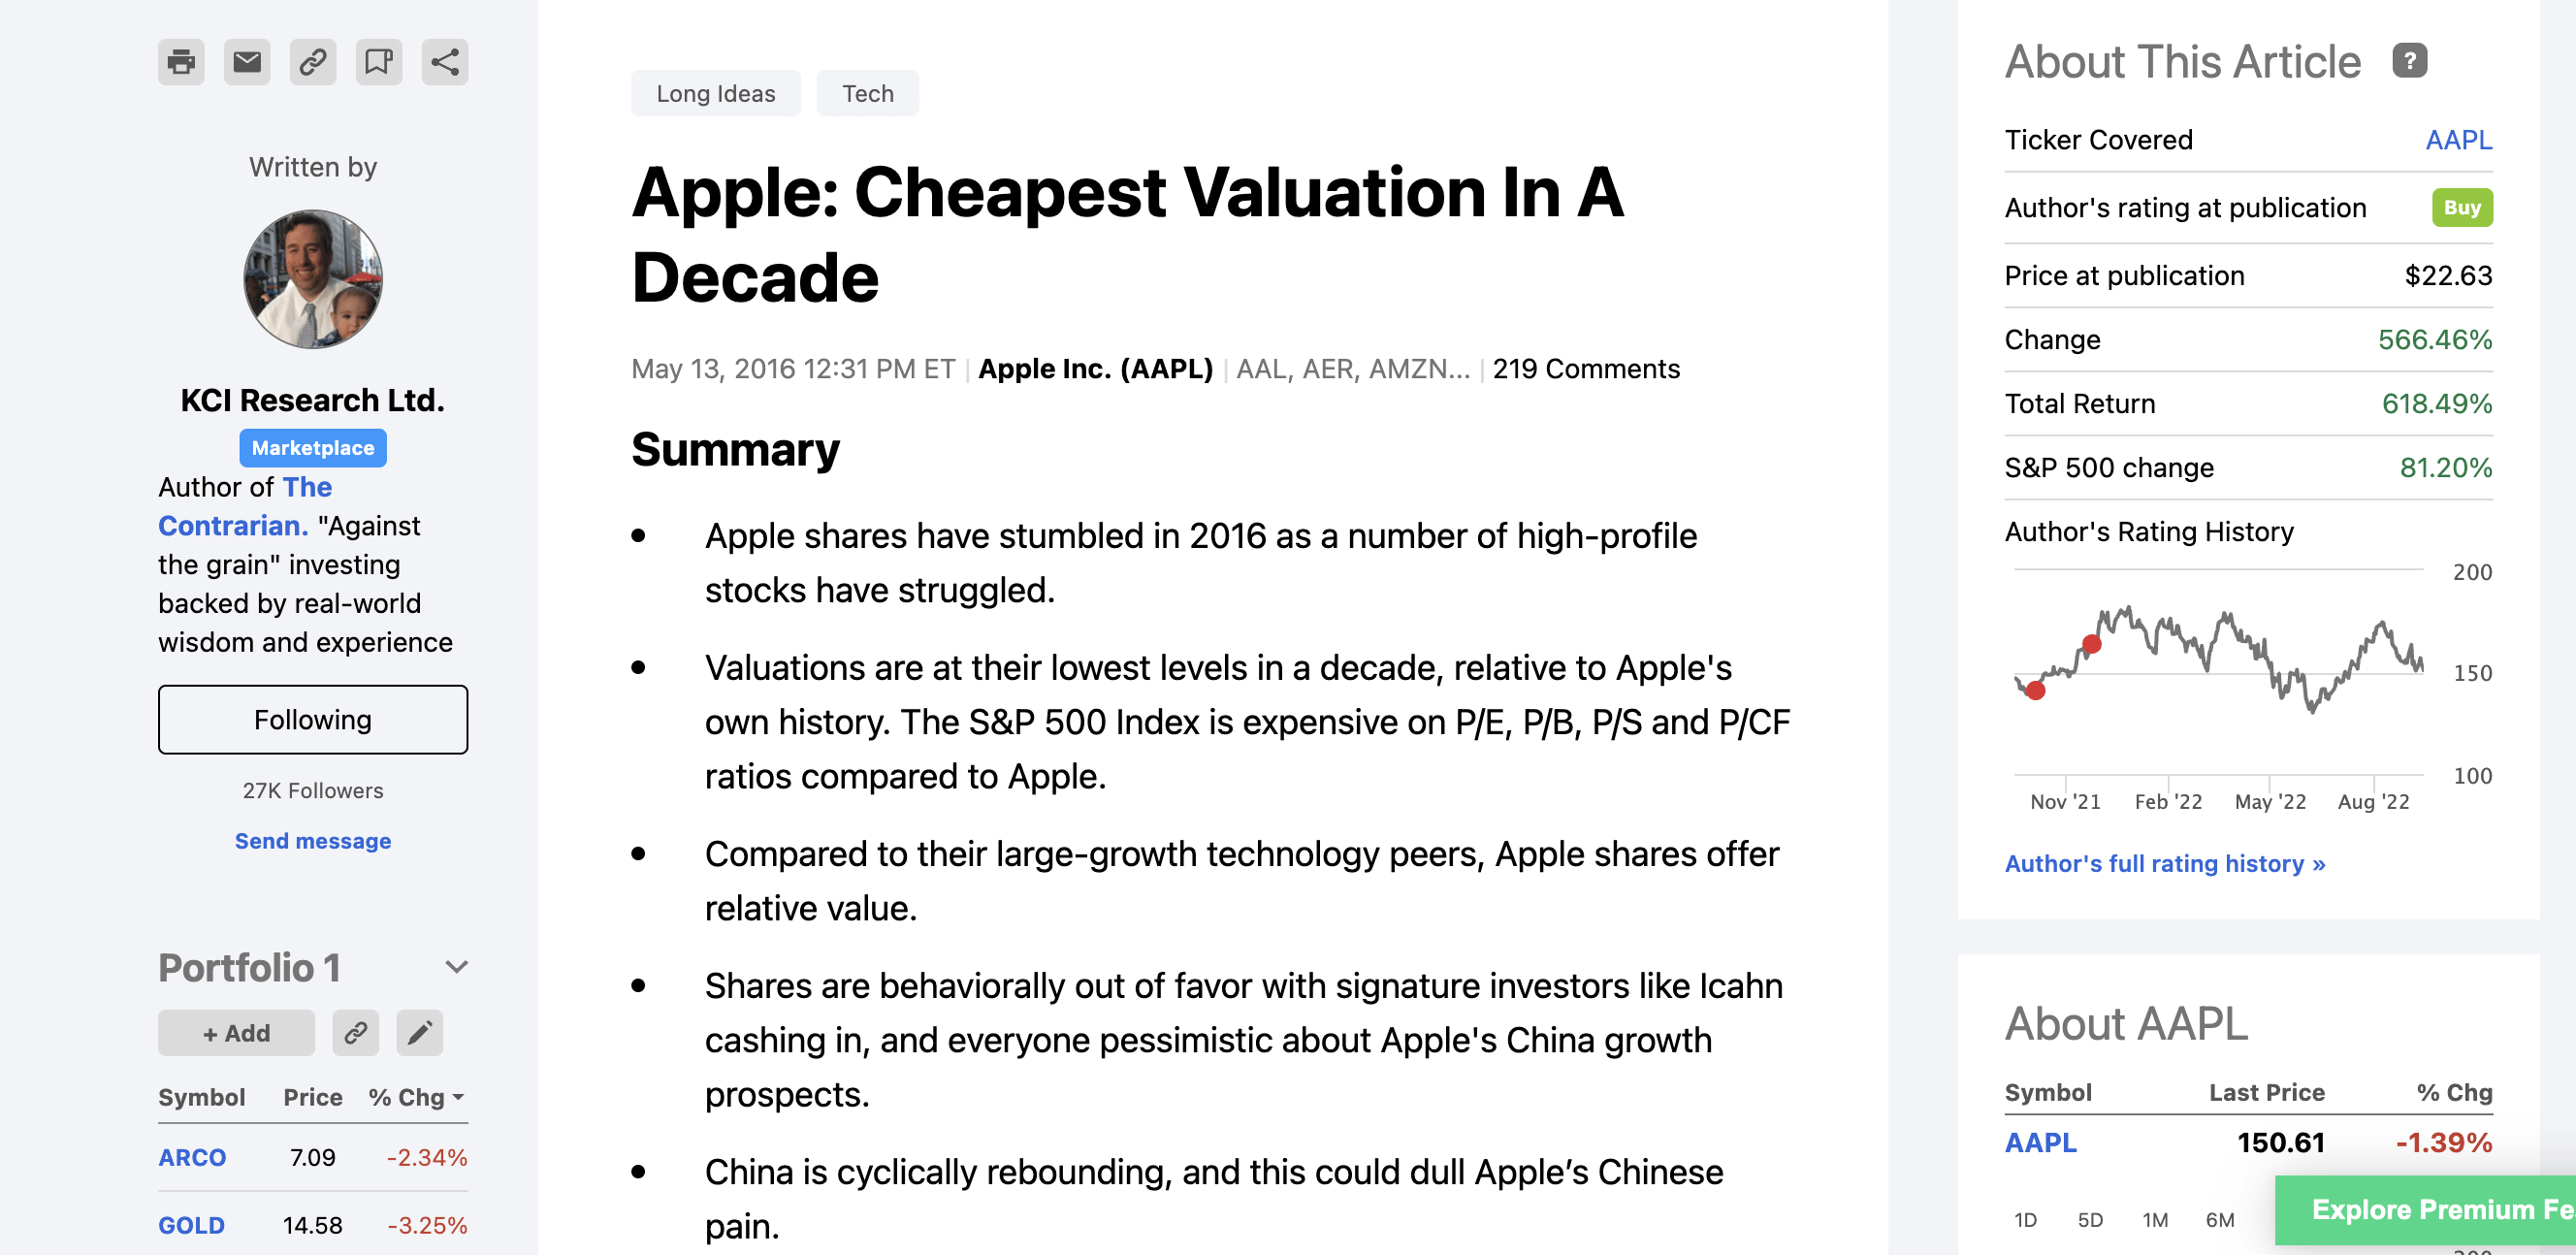
Author’s May 13th, 2016 Seeking Alpha Apple Article (Author, Seeking Alpha)
Looking at the above screenshot from my May 2016 article, Apple shares have had a total return of 618.5%, vs. a 81.2% return for the S&P 500 Index (SP500). Obviously, massive outperformance by Apple shares.
Interestingly, this outperformance by Apple shares on a relative basis has even continued since I turned pound the table bearish on Apple, which I did with my Dec. 2, 2021, article titled, “Apple: The Last Domino To Fall In A Market House Of Cards.” For a visual perspective, see the snapshot of performance since that article’s publication.
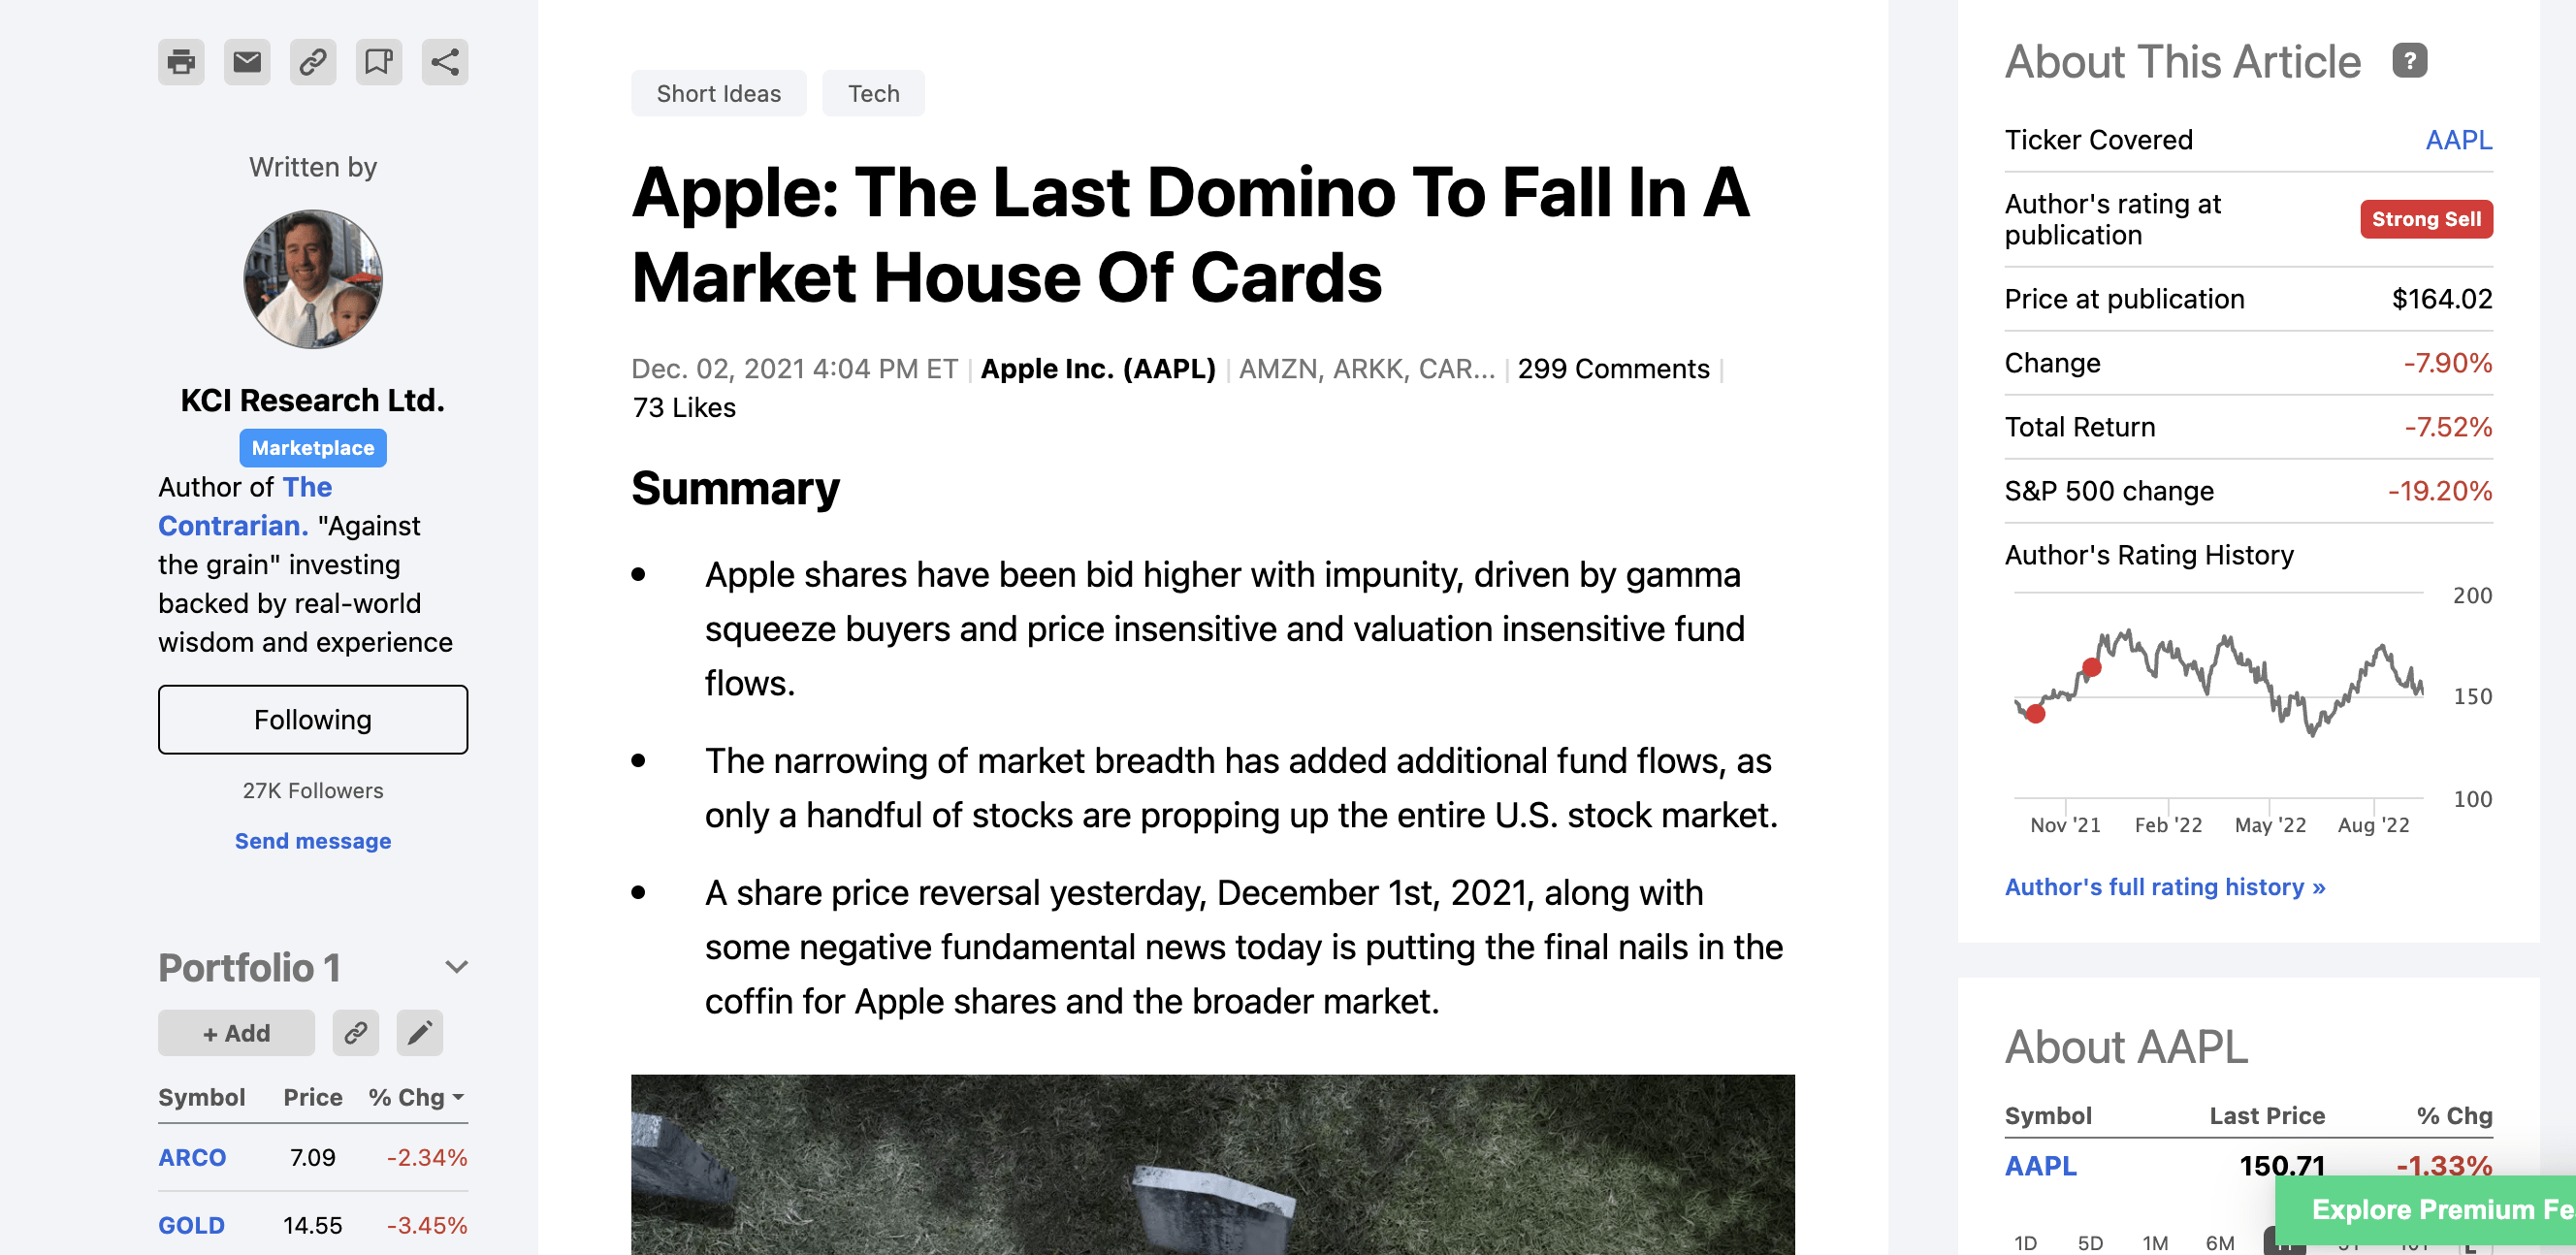
Author’s December 2nd, 2021 Seeking Alpha Apple Article (Author, Seeking Alpha)
Since my December 2nd, 2021 bearish article on Apple, Apple’s shares are down, with a total return of negative 7.5%, yet they have outperformed the broader market, as investors have congregated in a handful of seemingly bellwether securities, encouraged by the outperformance, and the ownership of legendary investors like Buffett.
Ironically, this was the exact same behavior we saw in the 2000-2002 bear market, with Cisco Systems (CSCO) being a notable example of a stock that held up extremely well for a period of time, however, then it collapsed. Given that Apple has a roughly 3% free cash flow yield today, and 2-year Treasury Yields are above 4%, the safe-have status of Apple, and other low free cash flow yield stocks, is being challenged. The end result from an investor perspective is to not be too complacent, and mentally prepare for a further drawdown.
Apple Shares Are Holding Up Relatively Well
Looking at a daily chart of price action, Apple shares are considerably above their June 2022 lows, even though the broader equity market, as measured by the SPDR S&P 500 ETF (SPY) is approaching its summer lows.
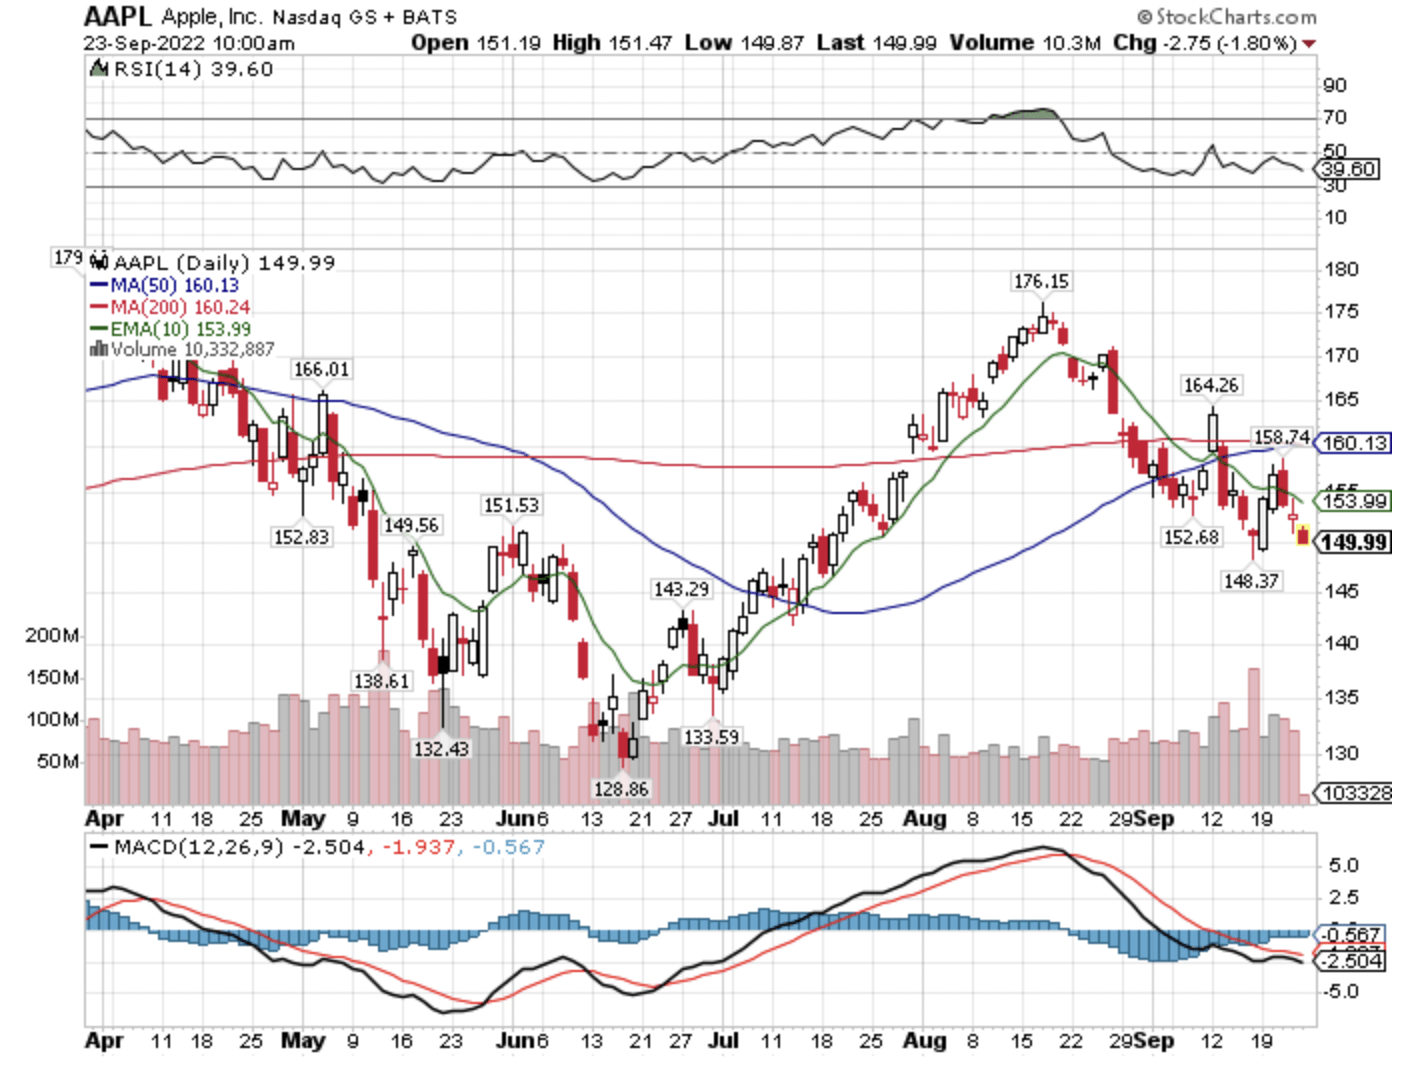
AAPL Daily Price (Author, StockCharts)
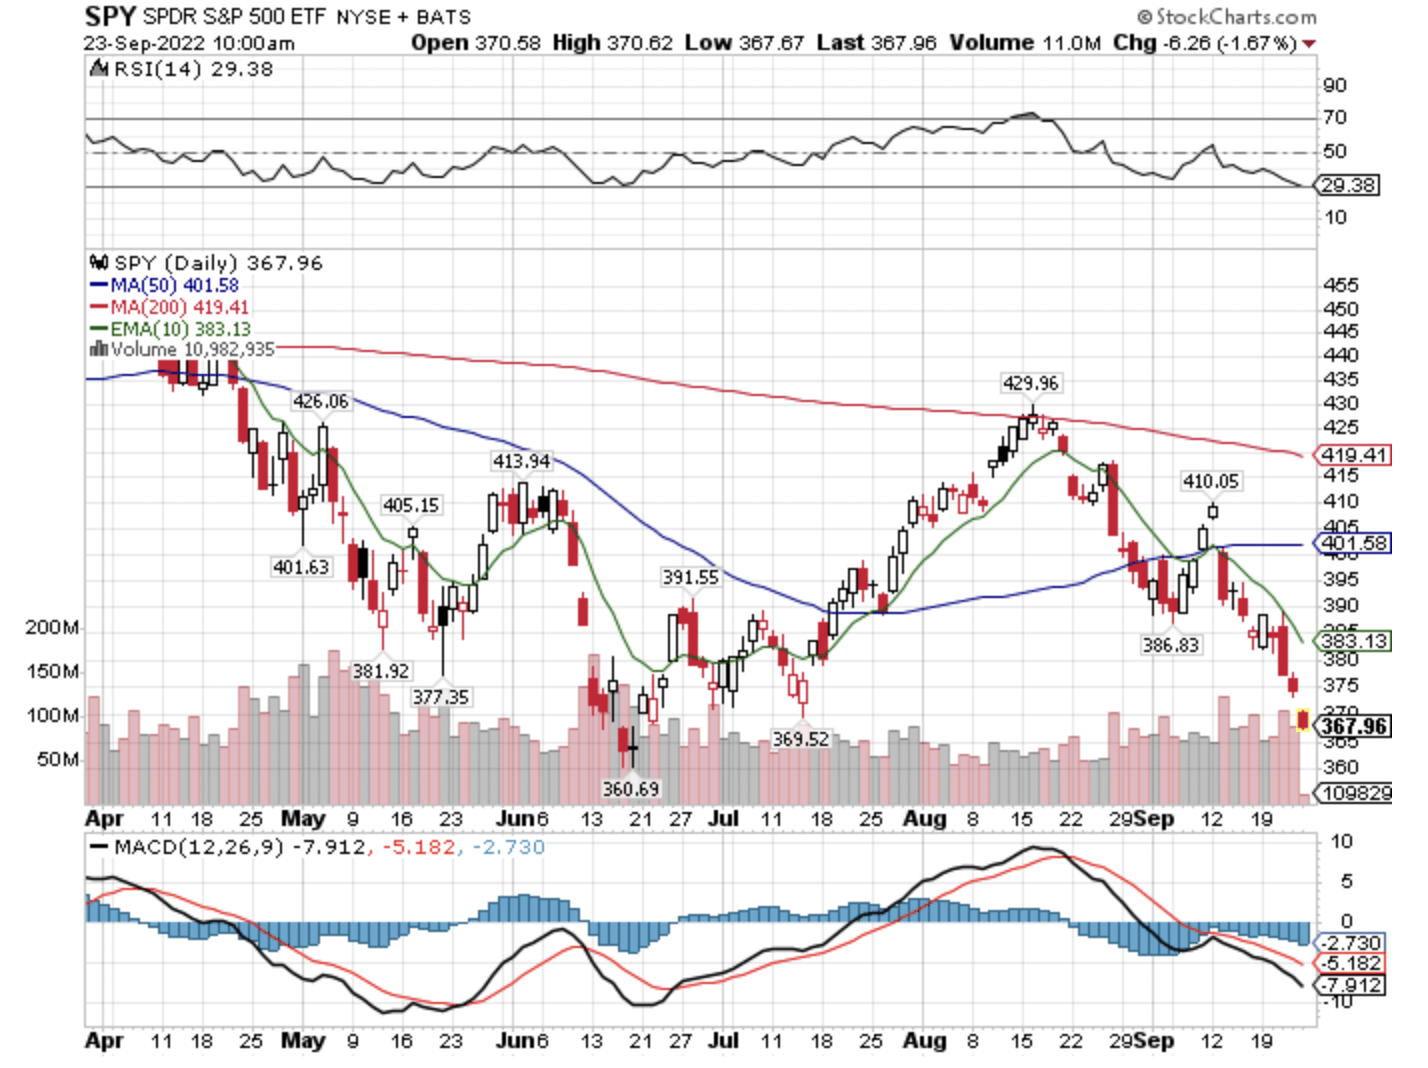
SPY Daily Price (Author, StockCharts)
Simply put, there’s catch-up potential to the downside, especially when the buy-the-dip mentality transitions to fear, which has not happened yet from my vantage point.
Weekly and Monthly Perspectives
Taking a step back, and looking at the weekly chart of Apple gives a longer-term perspective.
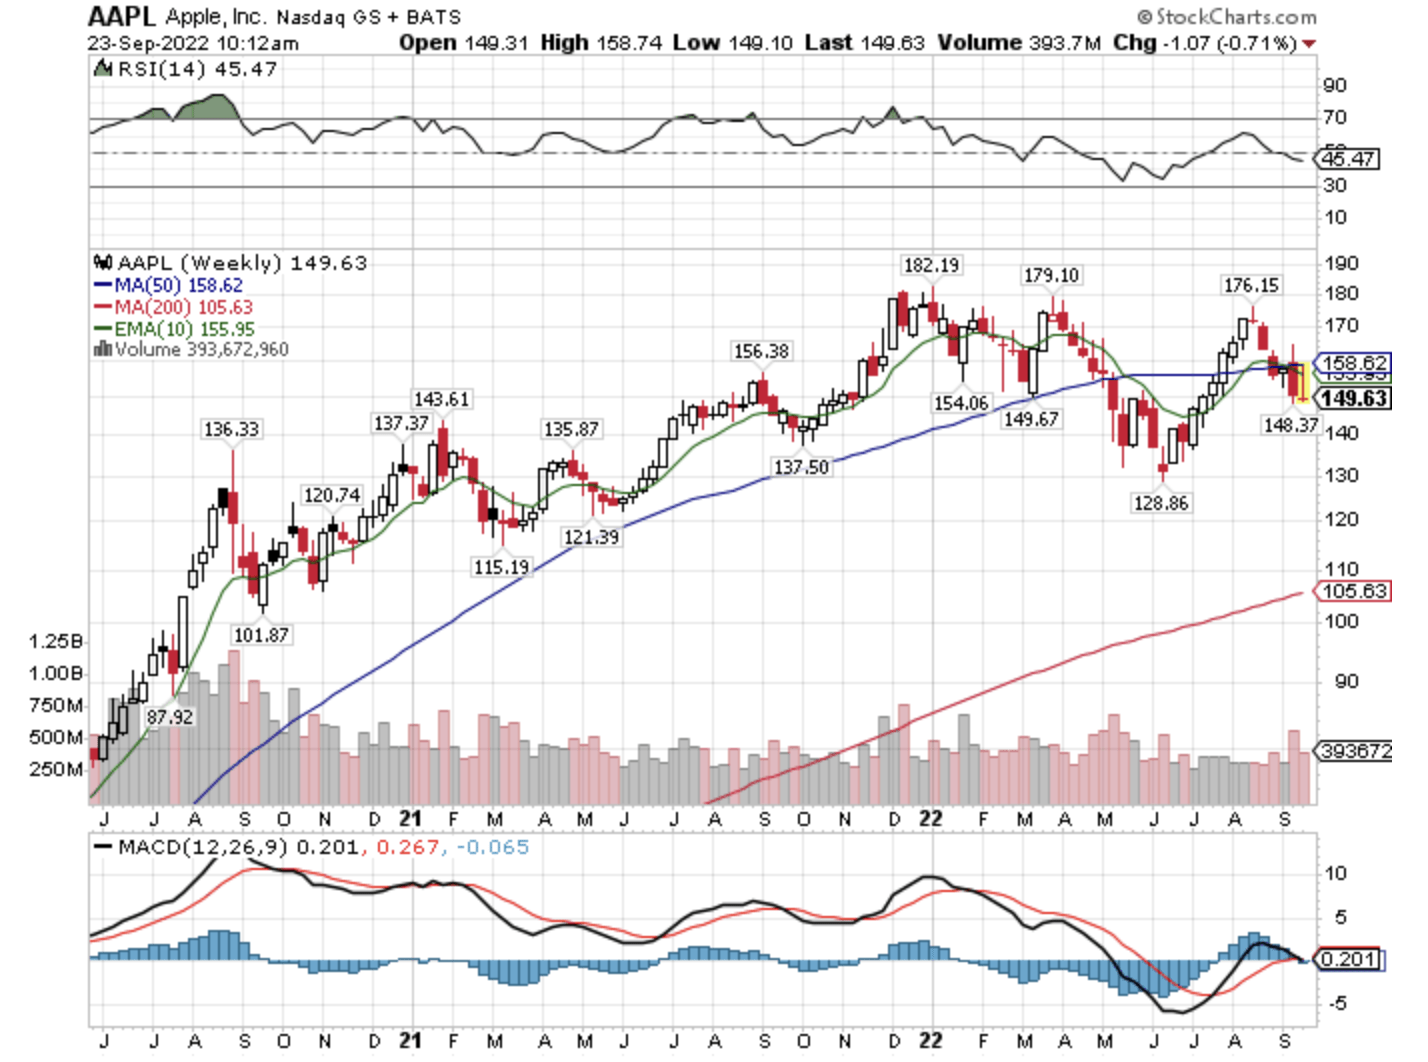
AAPL Weekly Price (Author, StockCharts)
Clearly we have turned down again, with five of the last six-week divergence vs. the June 2022 lows is still evident.
Looking at an even longer-term perspective, on a monthly chart Apple shares seem to be just now rolling over.
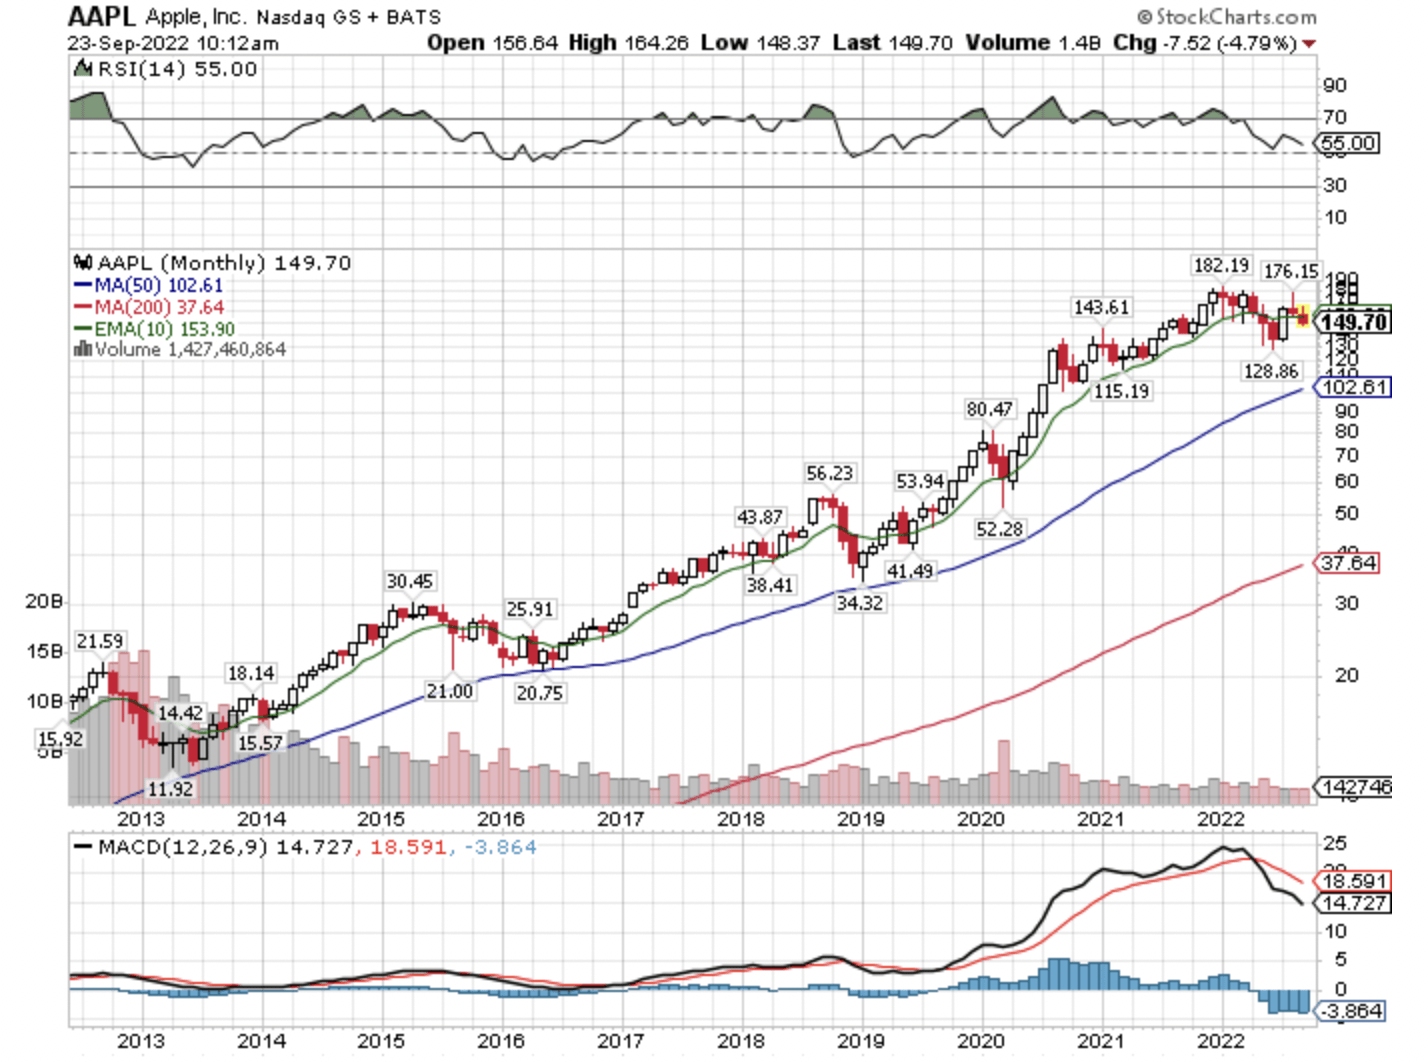
AAPL Monthly Price (Author, StockCharts)
Compare and contrast the monthly price performance of Apple shares to FedEx (FDX), which of course warned about its own profit shortfalls alongside a potential global recession earlier this month.
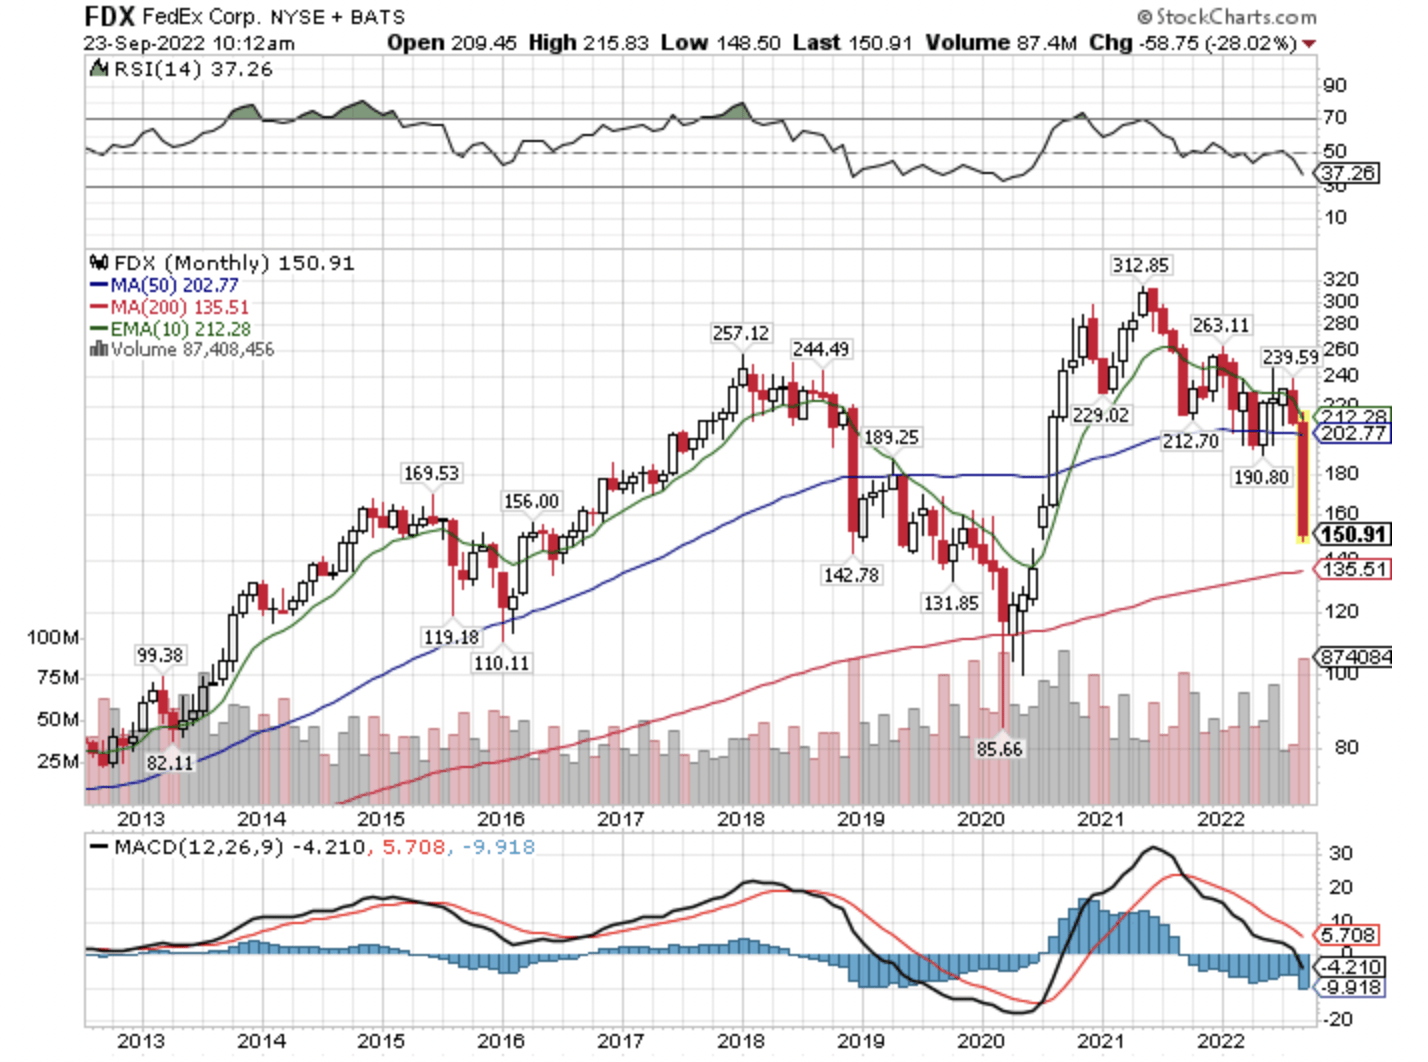
FDX Monthly Price (Author, StockCharts)
FedEx is much deeper into its current bear market, and they are a very different business than Apple, however, if we’re entering a global recessionary environment, then Apple might have some of its own earnings obstacles to overcome in the future.
Free Cash Flow Yields Remain Very Poor
The following section pulls from research I originally took a deep dive on and wrote about extensively in the second half of 2021, however it’s particularly relevant today, as 2-Year U.S. Treasury Yields are now trading north of 4%, creating a real viable alternative to comparatively paltry free cash flow yields for investment dollars.
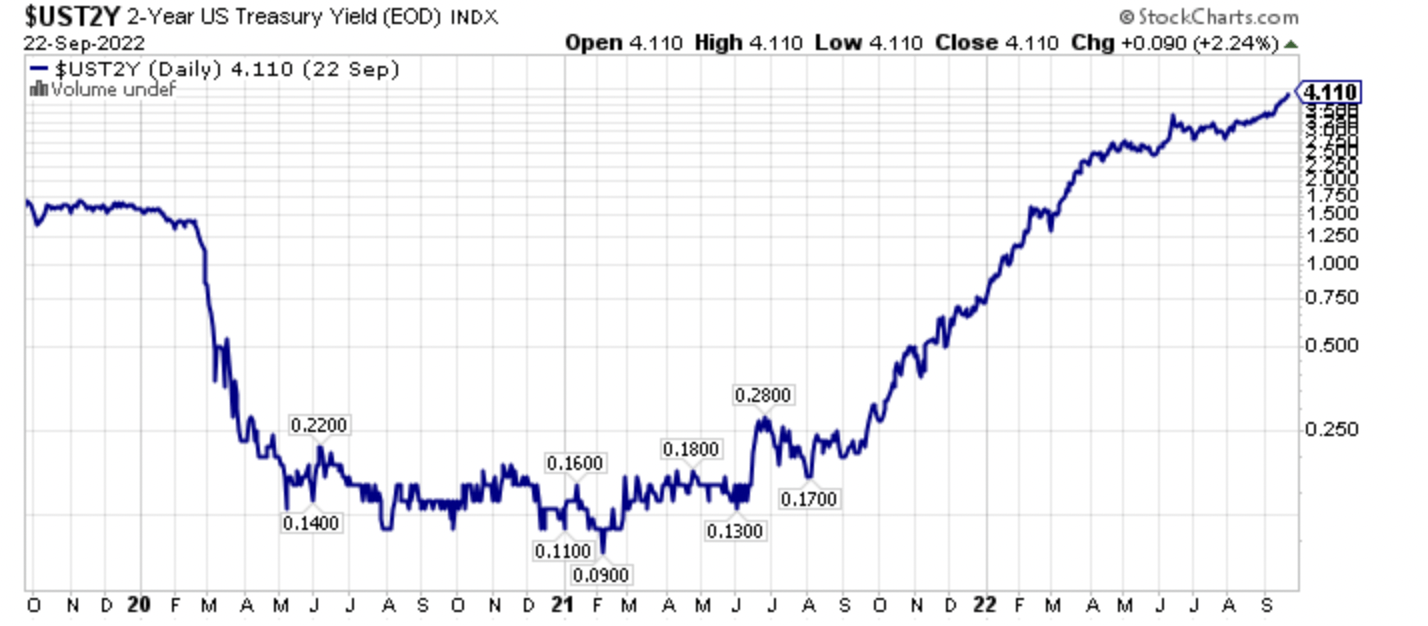
2-Year Treasury Yields (Author, StockCharts)
For a long time, I have been hypothesizing that the U.S. stock market has morphed into a disinflationary/deflationary asset. This is becoming more evident over time, specifically when you look at the free cash flow yields of the largest stocks in the Invesco QQQ Trust (QQQ) and the SPDR S&P 500 ETF. Starting with the largest company, Apple, which I have written about in-depth over the years, here are the free cash flow yields of the 10 largest companies in the S&P 500 Index for 2021, and estimated free cash flow yields for 2022 and 2023.
- Apple – 2021 4.0% Free Cash Flow Yield
- Microsoft (MSFT) – 2021 2.0% Free Cash Flow Yield
- Amazon (AMZN) – 2021 1.2% Free Cash Flow Yield
- Alphabet (GOOGL) (GOOG) – 2021 5.2% Free Cash Flow Yield
- Facebook (META) – 2021 2.3% Free Cash Flow Yield
- Berkshire Hathaway (BRK.A), (BRK.B) – 2021 5.5% Free Cash Flow Yield
- Tesla (TSLA) – 2021 0.4% Free Cash Flow Yield
- Nvidia (NVDA) – 2021 0.7% Free Cash Flow Yield
- JPMorgan Chase (JPM) – 2021 4.2% Free Cash Flow Yield
- Johnson & Johnson (JNJ) – 2021 5.2% Free Cash Flow Yield
To provide a comparison, let’s look at the 2022 estimated free cash flow yields.
- Apple – 2022 Estimated 3.8% Free Cash Flow Yield
- Microsoft – 2022 Estimated 2.5% Free Cash Flow Yield
- Amazon – 2022 Estimated 2.8% Free Cash Flow Yield
- Alphabet – 2022 Estimated 5.1% Free Cash Flow Yield
- Facebook – 2022 Estimated 3.5% Free Cash Flow Yield
- Berkshire Hathaway – 2022 Estimated 5.3% Free Cash Flow Yield
- Tesla – 2022 Estimated 0.4% Free Cash Flow Yield
- Nvidia – 2022 Estimated 1.6% Free Cash Flow Yield
- JPMorgan Chase – 2022 Estimated 4.5% Free Cash Flow Yield
- Johnson & Johnson – 2022 Estimated 5.9% Free Cash Flow Yield
For a further comparison, let’s now look at 2023 estimated free cash flow yields.
- Apple – 2023 Estimated 3.8% Free Cash Flow Yield
- Microsoft – 2023 Estimated 2.8% Free Cash Flow Yield
- Amazon – 2023 Estimated 4.5% Free Cash Flow Yield
- Alphabet – 2023 Estimated 5.3% Free Cash Flow Yield
- Facebook – 2023 Estimated 4.1% Free Cash Flow Yield
- Berkshire Hathaway – 2023 Estimated 5.3% Free Cash Flow Yield
- Tesla – 2023 Estimated 1.1% Free Cash Flow Yield
- Nvidia – 2023 Estimated 2.0% Free Cash Flow Yield
- JPMorgan Chase – 2023 Estimated 5.0% Free Cash Flow Yield
- Johnson & Johnson – 2023 Estimated 6.5% Free Cash Flow Yield
Working through these free cash flow numbers, which I developed from my own modeling, and then comparing these to Credit Suisse (CS) and Morningstar (MORN) models, it should be noticeable that the free cash flow yields here are nothing to write home about. In fact, the largest 10 companies in the S&P 500 Index are projected to routinely earn low single-digit free cash flow yields.
A developing issue today is that not only are these projected free cash flow yields lower than comparable 2-Year Treasury yields, however, as FedEx showed, there’s a high probability that earnings estimates will be cut aggressively if we enter a recession, and the already low projected free cash flow yields will prove to be too optimistic.
Closing Thoughts – Be Wary Of Taking A Bite Out Of Apple Right Now
No doubt about it, Apple has been a fantastic stock since 2016, and really for far longer than that now. Apple shares have far outperformed the S&P 500 Index since 2016, and many long-term investors would never think of parting with their appreciated Apple shares. Going further, even in this slow developing bear market, where I have advocated that most investors would be better hiding in cash, Apple shares have held up better than the broader market.
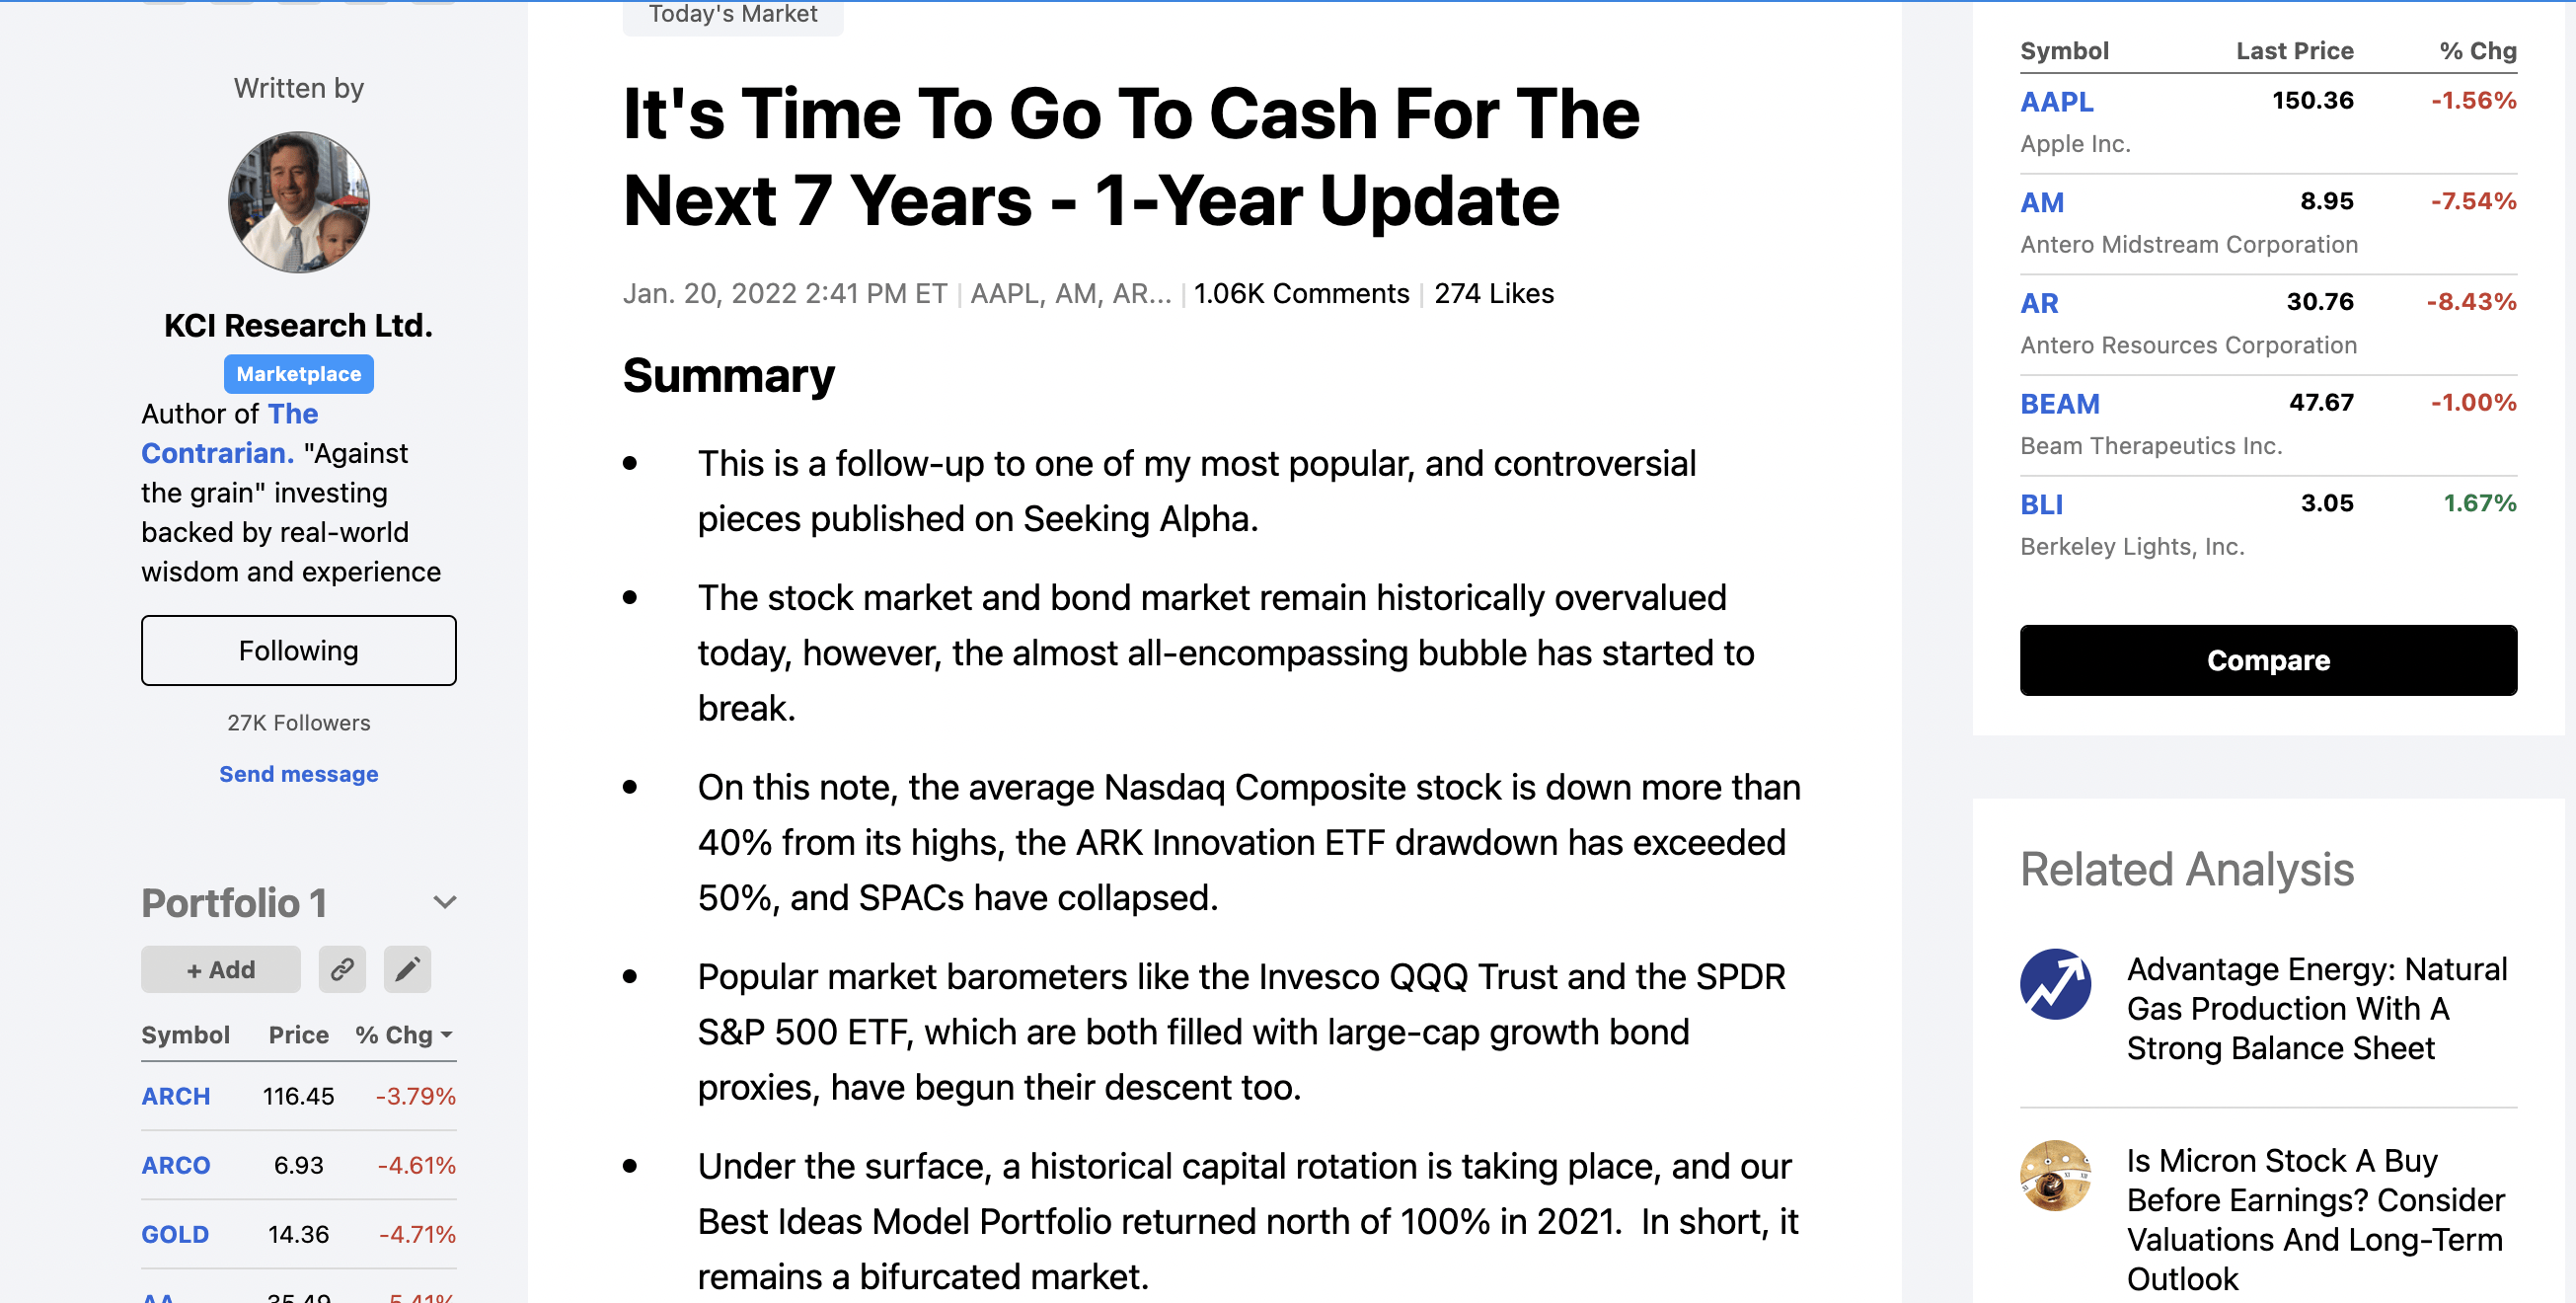
Author’s January 20th, 2022 Seeking Alpha Article (Author, Seeking Alpha)
A strong bear market ultimately, though, brings even the last stalwart stocks to their knees, and we saw this with Cisco, and the other holdouts in 2000-2002, and we are likely to see that with Apple shares today.
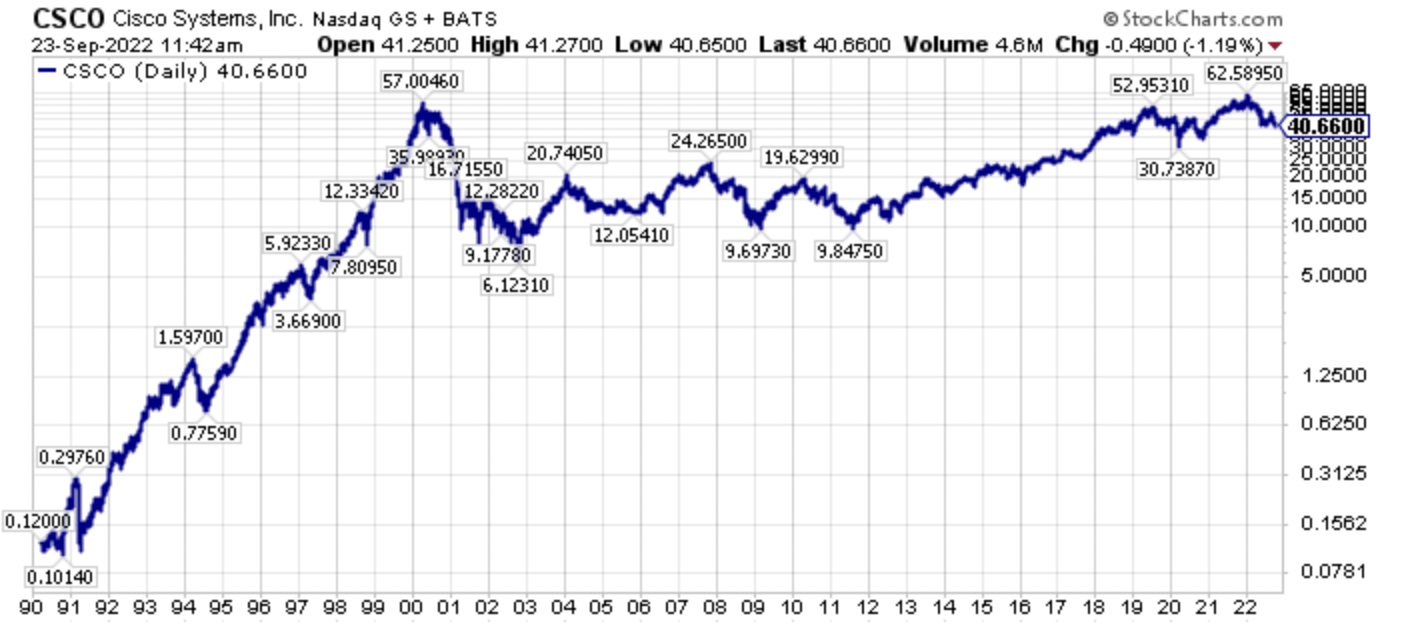
CSCO Long-Term Stock Price (Author, Seeking Alpha)
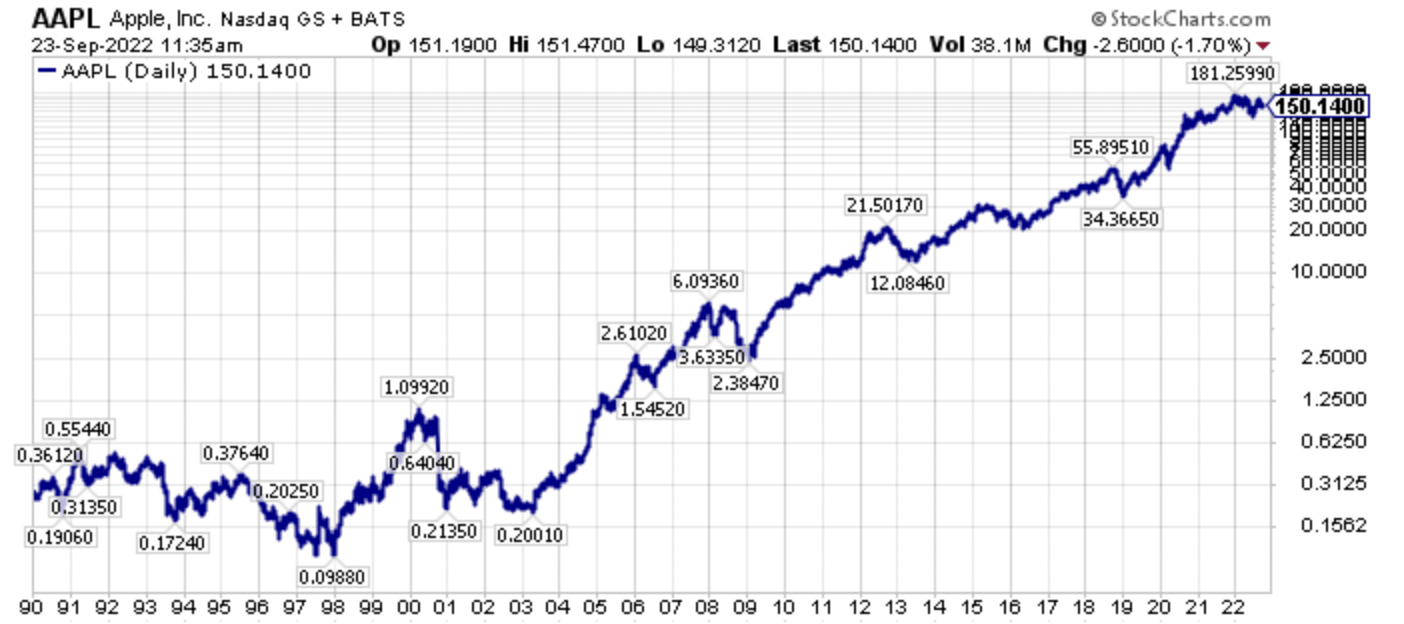
AAPL Long-Term Stock Price (Author, StockCharts)
Given that Apple’s free cash flow yields are under prevailing 2-Year U.S. Treasury Yields today, and that’s before a potential earnings estimate cut from a global recession, investors of all stripes should be aware that Apple could be the last shoe to drop before the current bear market runs its course. Going further, given the elevated heights of Apple shares today, that last shoe dropping could have a long way down to go.
Wrapping up, quietly at first, and now more rapidly as the capital rotation has broadened in scope, we have seen a passing of the baton of market leadership. Once Apple falls from its leadership perch, perhaps this passing of the baton will be clearer, however market phase changes like this take a long time, meaning years in the process. Will there be ebbs and flows to this process? Unequivocally yes, meaning expect relative pullbacks as investors reposition, and investors of all stripes try to re-orientate around the inflection point that is occurring real time.
At this juncture, most investors are simply just becoming aware of the ongoing bear market and the leadership transition that has been taking place since the broader equity markets bottomed in March of 2020, though relative and absolute price action this year in 2022 has certainly opened more eyes.
Recognizing this changing backdrop after years of study, including being too early, I have been pounding the table on the extremely out-of-favor commodity equities for several years now, and I still think we’re in the early innings of what will be a longer-term secular bull market, albeit with significant volatility. Personally, I think we will supersede the capital rotation that took place from growth-to-value during 2000-2007, which also coincided with the last secular commodity bull market which ran from 2000-2008.
Investors skittish of commodity equities should research cast aside financials as they also will benefit from a renewed steepening of the yield curve, which is probably forthcoming following the eventual Fed pause and pivot, whenever it occurs, which could even be a year out at this juncture.
Understanding the bigger picture, then having an understanding of the bottoms-up fundamentals has been the key to outperformance, and this is a path that has not been easy with those participating confirming this reality. However, the road less taken is sometimes the better one, and I firmly believe that today, as traditional stocks, bonds, and real estate continue to offer very poor starting valuations, though they’re better than at the start of this year where I opined it was better to be in cash for the next seven years, and very poor projected future real returns from today’s price levels. More specifically, the out-of-favor assets and asset classes, including commodities and commodity equities and out-of-favor specific securities, are where the historic opportunity has been, and that’s where it still stands, from my perspective.
Be the first to comment