

Firn/iStock via Getty Images
Introduction
Apple Inc. (NASDAQ:AAPL) stock has had a troublesome tryst with technicals as of late. The company’s share price has been moving lower in a downward broadening channel (bearish megaphone pattern) throughout 2022. While some investors may see Apple trading ~20% below its all-time highs as a great dip buying opportunity, others may be concerned about further downside risk in the stock. The megaphone pattern often results in significant moves (to the upside or downside depending on the bullish or bearish nature of the megaphone), and hence, investor caution here is warranted.
WeBull Desktop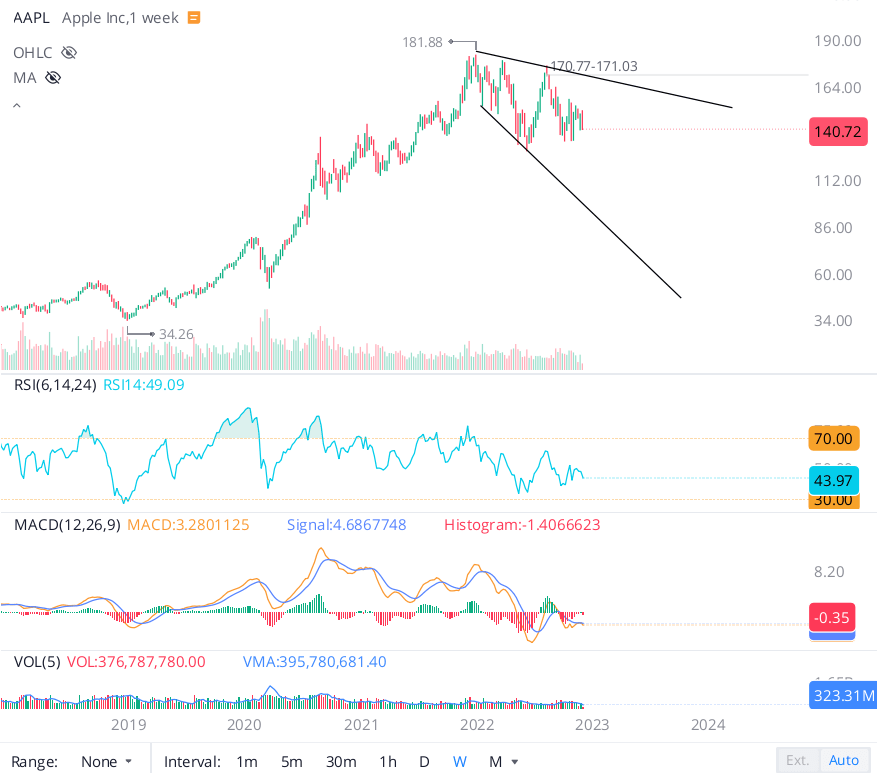
Despite a challenging macroeconomic backdrop and extremely tough comps, Apple’s business performance has remained steadfast so far this year. However, things may be about to change soon, with recent production issues in China (i.e., strikes at Foxconn’s plant in China and subsequent scale-up problems) estimated to create a shortfall of ~5-20M iPhones, which would, in turn, lead to lower sales and profits. While these fluctuations are temporary in nature, the need for Apple to diversify its supply chain away from China has become obvious, and this transition could lead to lower margins in the future. But I digress.
In this note, we will focus solely on Apple’s technical chart to gauge the next big move in Apple’s stock.
What Is Mr. Market Telling Us About Apple’s Stock Through This Megaphone Pattern?
As I said earlier, Apple’s stock chart is showing a bearish megaphone pattern, which could portend to outsized moves to the downside – like the one we saw in S&P500 (SPY) back in 2008-09. Back in mid-2008, SPY was sitting ~20% off its highs and displayed a similar pattern to what we see currently in Apple’s stock. What followed next for S&P500 was a -50% decline!
WeBull Desktop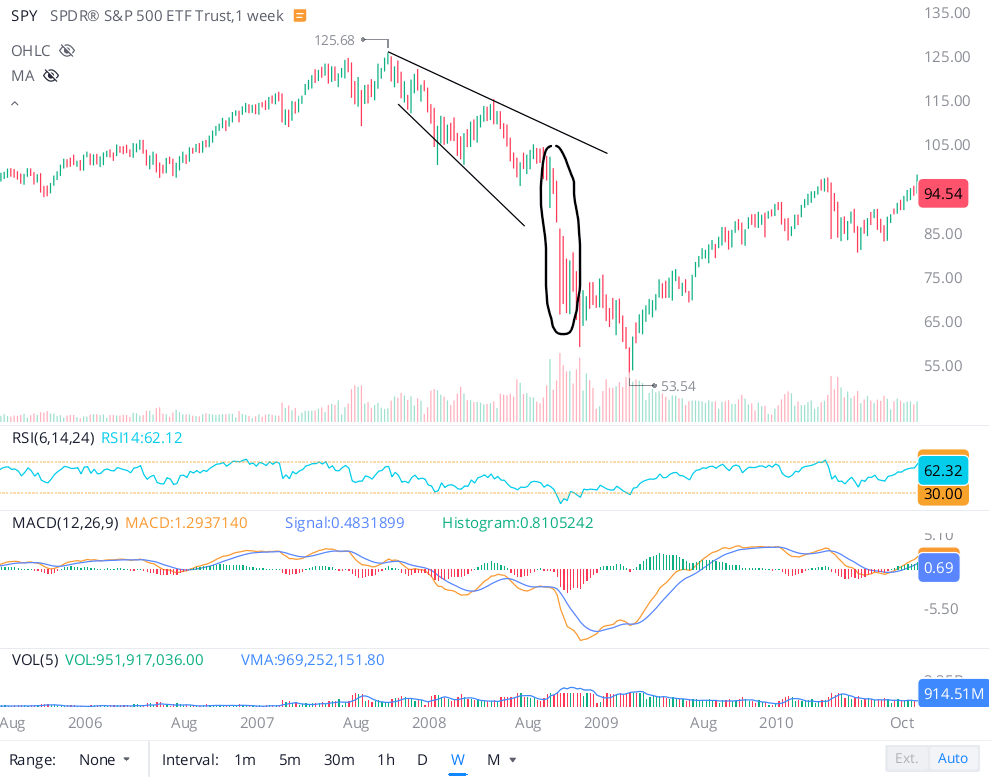
Now, I am not saying that Apple will slide down by 50% from current levels just because S&P500 did so back in 2008-09. All I am saying is that such a megaphone pattern could result in a significant move to the downside. Now, let us look a little deeper into Apple’s chart.
Within the bearish megaphone pattern, Apple has formed a symmetric triangle pattern in recent weeks. The symmetric triangle pattern in stocks is when the prices of a security move in a symmetrical fashion. The prices will move higher and lower, but the overall trend will be sideways. This occurs as the buyers and sellers battle for control of the security. The symmetric triangle pattern in stocks is a consolidation pattern that usually forms during a downtrend. The pattern is made up of two trendlines, one downward sloping & one rising, that converge as the price action within the pattern tightens. Once the price breaks out of the triangle, it typically moves in the direction of the previous trend, which in this case, is downwards. Theoretically, the next big move in Apple’s stock should be to the downside on a breakdown of this symmetric triangle pattern.
WeBull Desktop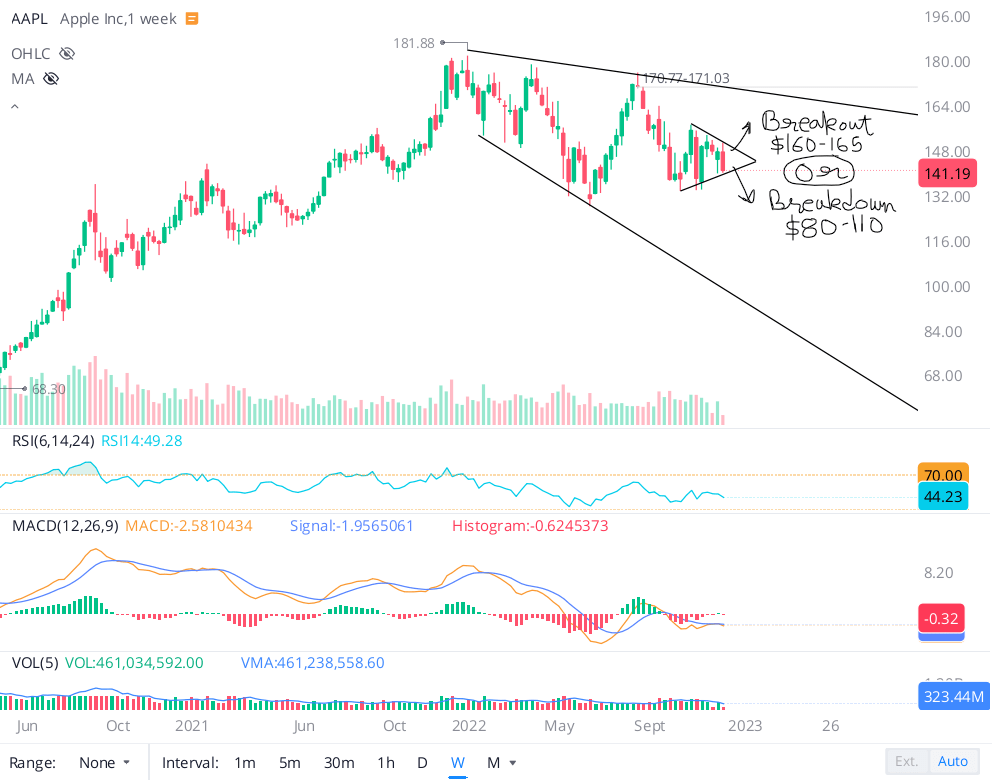
Now, technical analysis is all about probabilities, and Apple could break down from here or break out to the upside and run higher! As investors or traders, it is our responsibility to evaluate the risk/reward of given setups and make informed investment decisions.
In Apple’s case, a breakout to the upside from the $150 level could send the stock rallying up to $160-165, i.e., the upper trendline of the downward broadening channel. On the other hand, if Apple’s stock suffers a breakdown of the $134 level, it could quickly slide down to the $80-110 zone. Clearly, the downside risk is far greater than the upside potential in the near term.
Alright, it’s time to zoom into the chart and see what’s going on underneath the surface. As you can see below, all of Apple’s recent local peaks have been rejections from the 200-DMA level, which is acting as strong resistance for the stock. This is a bearish signal indicating that Apple’s stock lacks momentum.
WeBull Desktop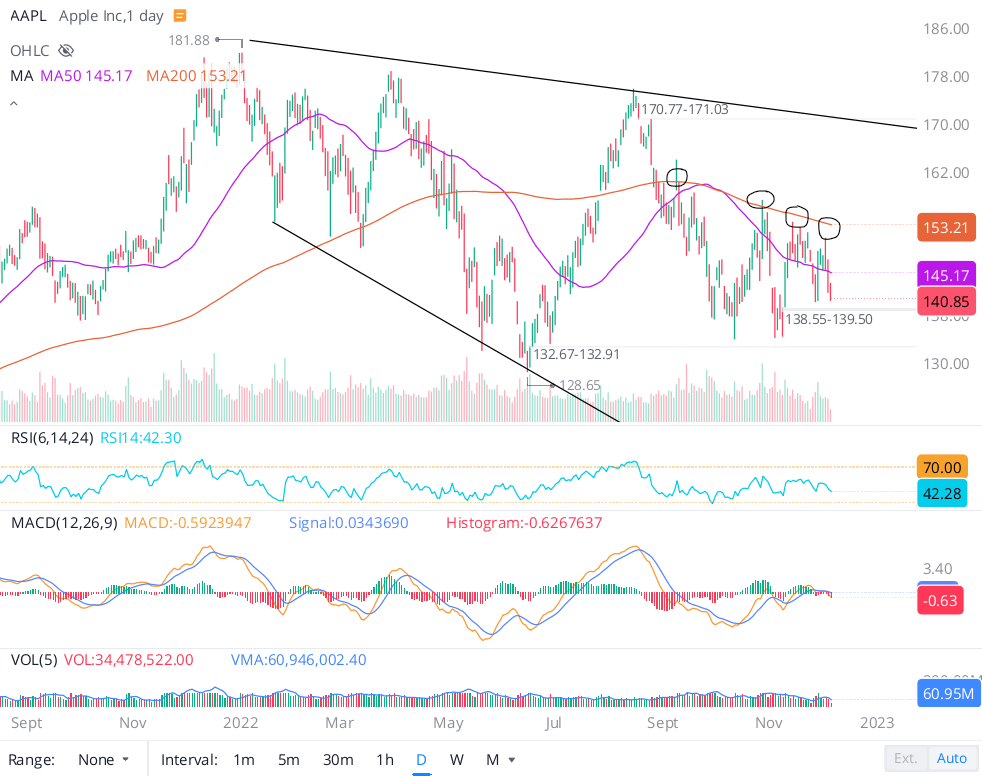
In my view, the resolution of the symmetrical triangle pattern is likelier to be a breakdown to the downside than a breakout to the upside. Technically, the near-term (< 12 months) outlook for Apple’s stock is bearish.
Conclusion: Avoid Buying Apple’s Stock
As an investor, I like to buy and hold companies for the long haul, and Apple is an incredible business to own. That said, I have reservations about its current valuation, as shared in multiple articles in the past. Apple is one of the strongest consumer discretionary businesses on the face of this planet; however, it ain’t a recession-proof business or stock and shouldn’t be priced like a utility (as it’s being priced right now).
Today’s technical analysis exercise showed that – Apple’s stock is ripe for a big near-term move within the bearish megaphone pattern formed on the chart. A breakout to the upside from the symmetrical triangle pattern (~$150 level) could send Apple’s stock soaring up to ~$165-170. On the other hand, a breakdown of the $134 level could send the stock tumbling down to the $80-110 zone. Clearly, the risk/reward here is tilted in favor of bears. Also, we saw that Apple’s stock had been rejected from the 200-DMA level multiple times in recent weeks, and that’s a bearish signal.
If you follow my work, you know that I do not take short positions in individual stocks, and I am not going to start now (especially with Apple). However, I see a precarious technical setup in Apple’s chart, and I wouldn’t buy here. The conclusion of today’s technical analysis is in alignment with my fundamental view on Apple’s stock, which can be found in this note: Is Apple Stock A Good Pick If The Economy Enters A Recession?
Key Takeaway: I rate Apple “Avoid/Neutral/Hold” at $141.
Thanks for reading, and happy investing. Please share your thoughts, questions, and/or concerns in the comments section below.
Be the first to comment