

Shahid Jamil
Apple Inc (NASDAQ:AAPL) has had quite the year so far, both in terms of stock valuation and market reach. The company is a veritable repository of case studies on marketing and promotions for products in a space that is hotly contested globally.
Given the facts and trends in the year so far, the net recommendation for the company’s stock would be heavily dependent on both investment horizon and investor objectives.
Apple Revenues: Segment and Trends
As per the company’s financial statements, the share of net sales (i.e., revenue) disaggregated by region as well as product type is shaping up to be largely the same as that seen in the company’s FY 2021 results:
Source: Created by Sandeep G. Rao using data from Apple’s Financial Statements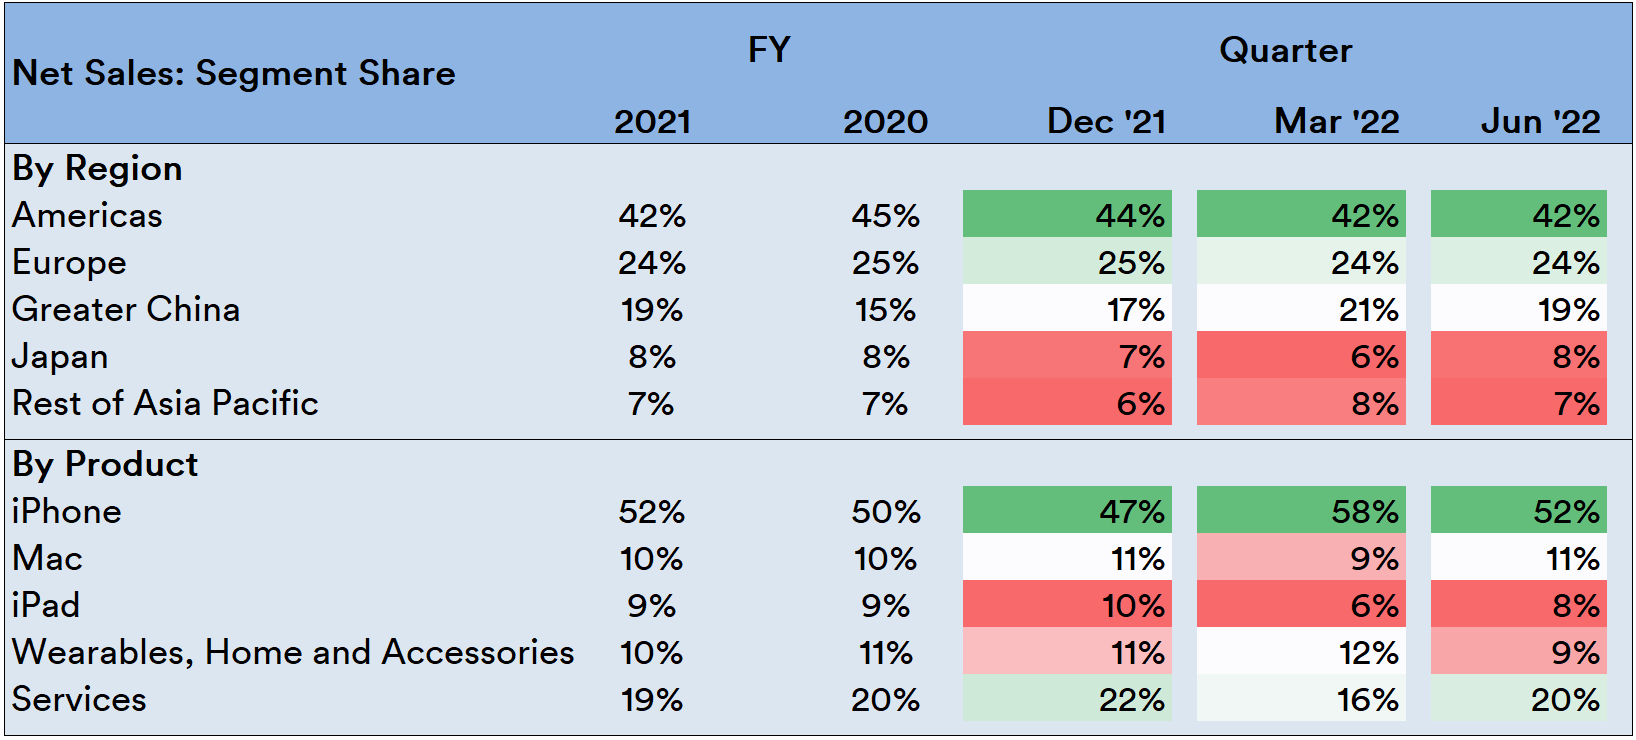
Two observations that become eminently clear are:
- The Americas is the biggest driver for revenue. All of Asia (i.e., China, Japan, and the rest of the Asia-Pacific region) together don’t come close to the revenues from the Americas. This implies that Apple continues to remain an “American” story.
- Outside of the iPhone, no other product comes close to having as much relevance to being a revenue driver for the company. This implies that Apple continues to remain a “smartphone” company.
In terms of trends seen both in Year-on-Year (YoY) as well as the quarter-on-quarter (QoQ) since the last FY results, the picture gains additional detail:
Source: Created by Sandeep G. Rao using data from Apple’s Financial Statements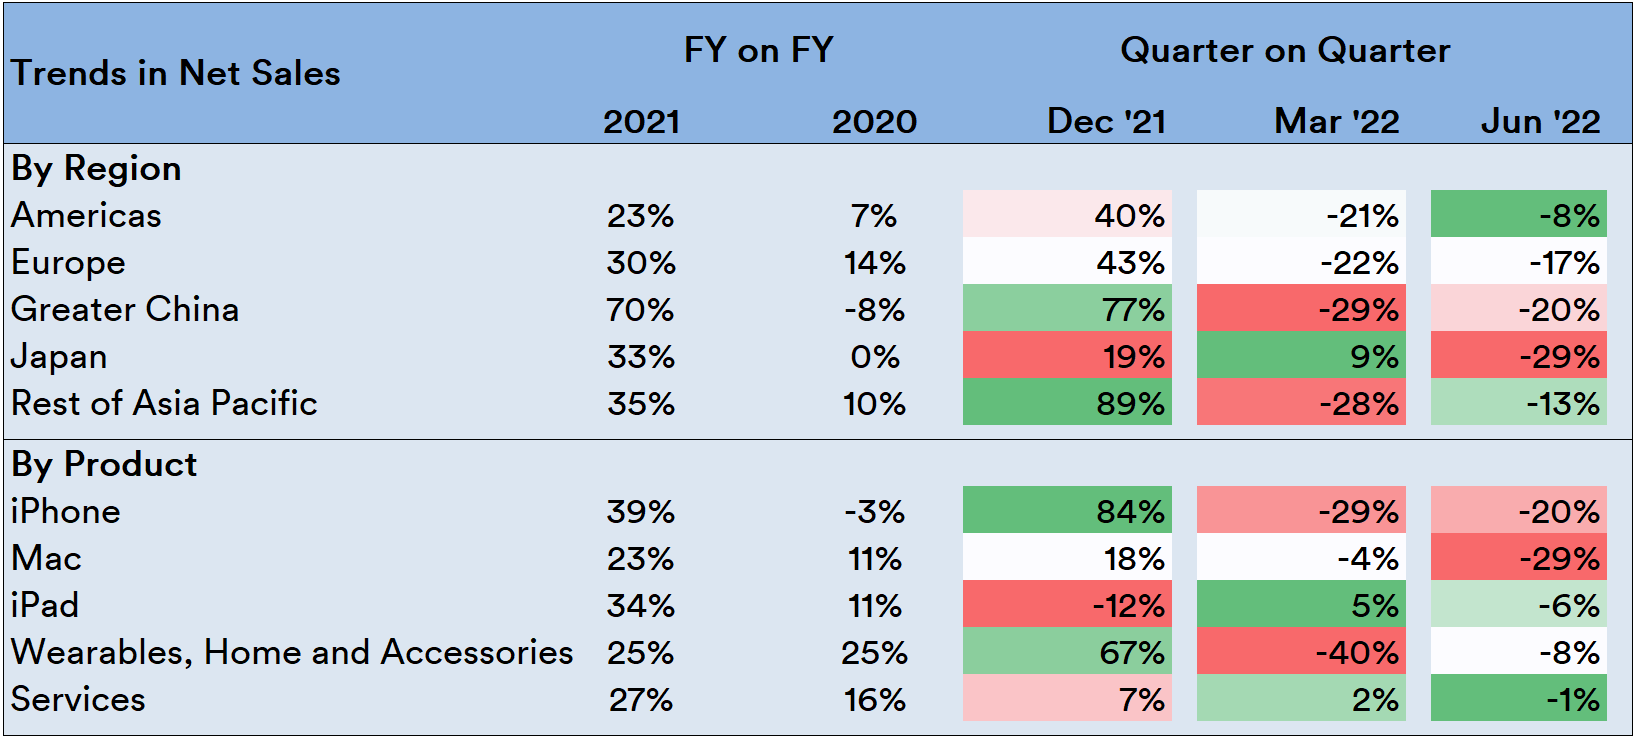
Three additional facets gained from this are:
- While all of Asia (particularly China) was the driver for explosive revenue growth in FY 21, the region now shows increasingly ominous revenue decline in the Year Till Date (YTD).
- While Europe trends towards a decline as well, the Americas is the only region showing the least decline in the previous quarter.
- Revenue trends in two products that traditionally accounted for nearly 60-65% of all its revenues – the iPhone and Mac – have witnessed a solid collapse in revenue with other product segments not picking up the slack.
Total net sales in the three quarters since last FY’s results stand at being 16.9% lower than the previous FY. Ordinarily, as trend analysis studies in articles in the past have shown, this would have been enough to suggest that it’s a safe bet that the company could break even with this FY and perhaps even show a modest gain. However, this doesn’t imply that the forward outlook is going to be similar – at least in terms of unit sales.
The Gap Between Cost and Price
The company’s iPhone line has nearly always maintained a high markup relative to the cost it incurs from its contract manufacturers. For instance, it has been estimated that the company’s previous model – the iPhone 13 – has at least a 75% base markup.
Visualization by FourWeekMBA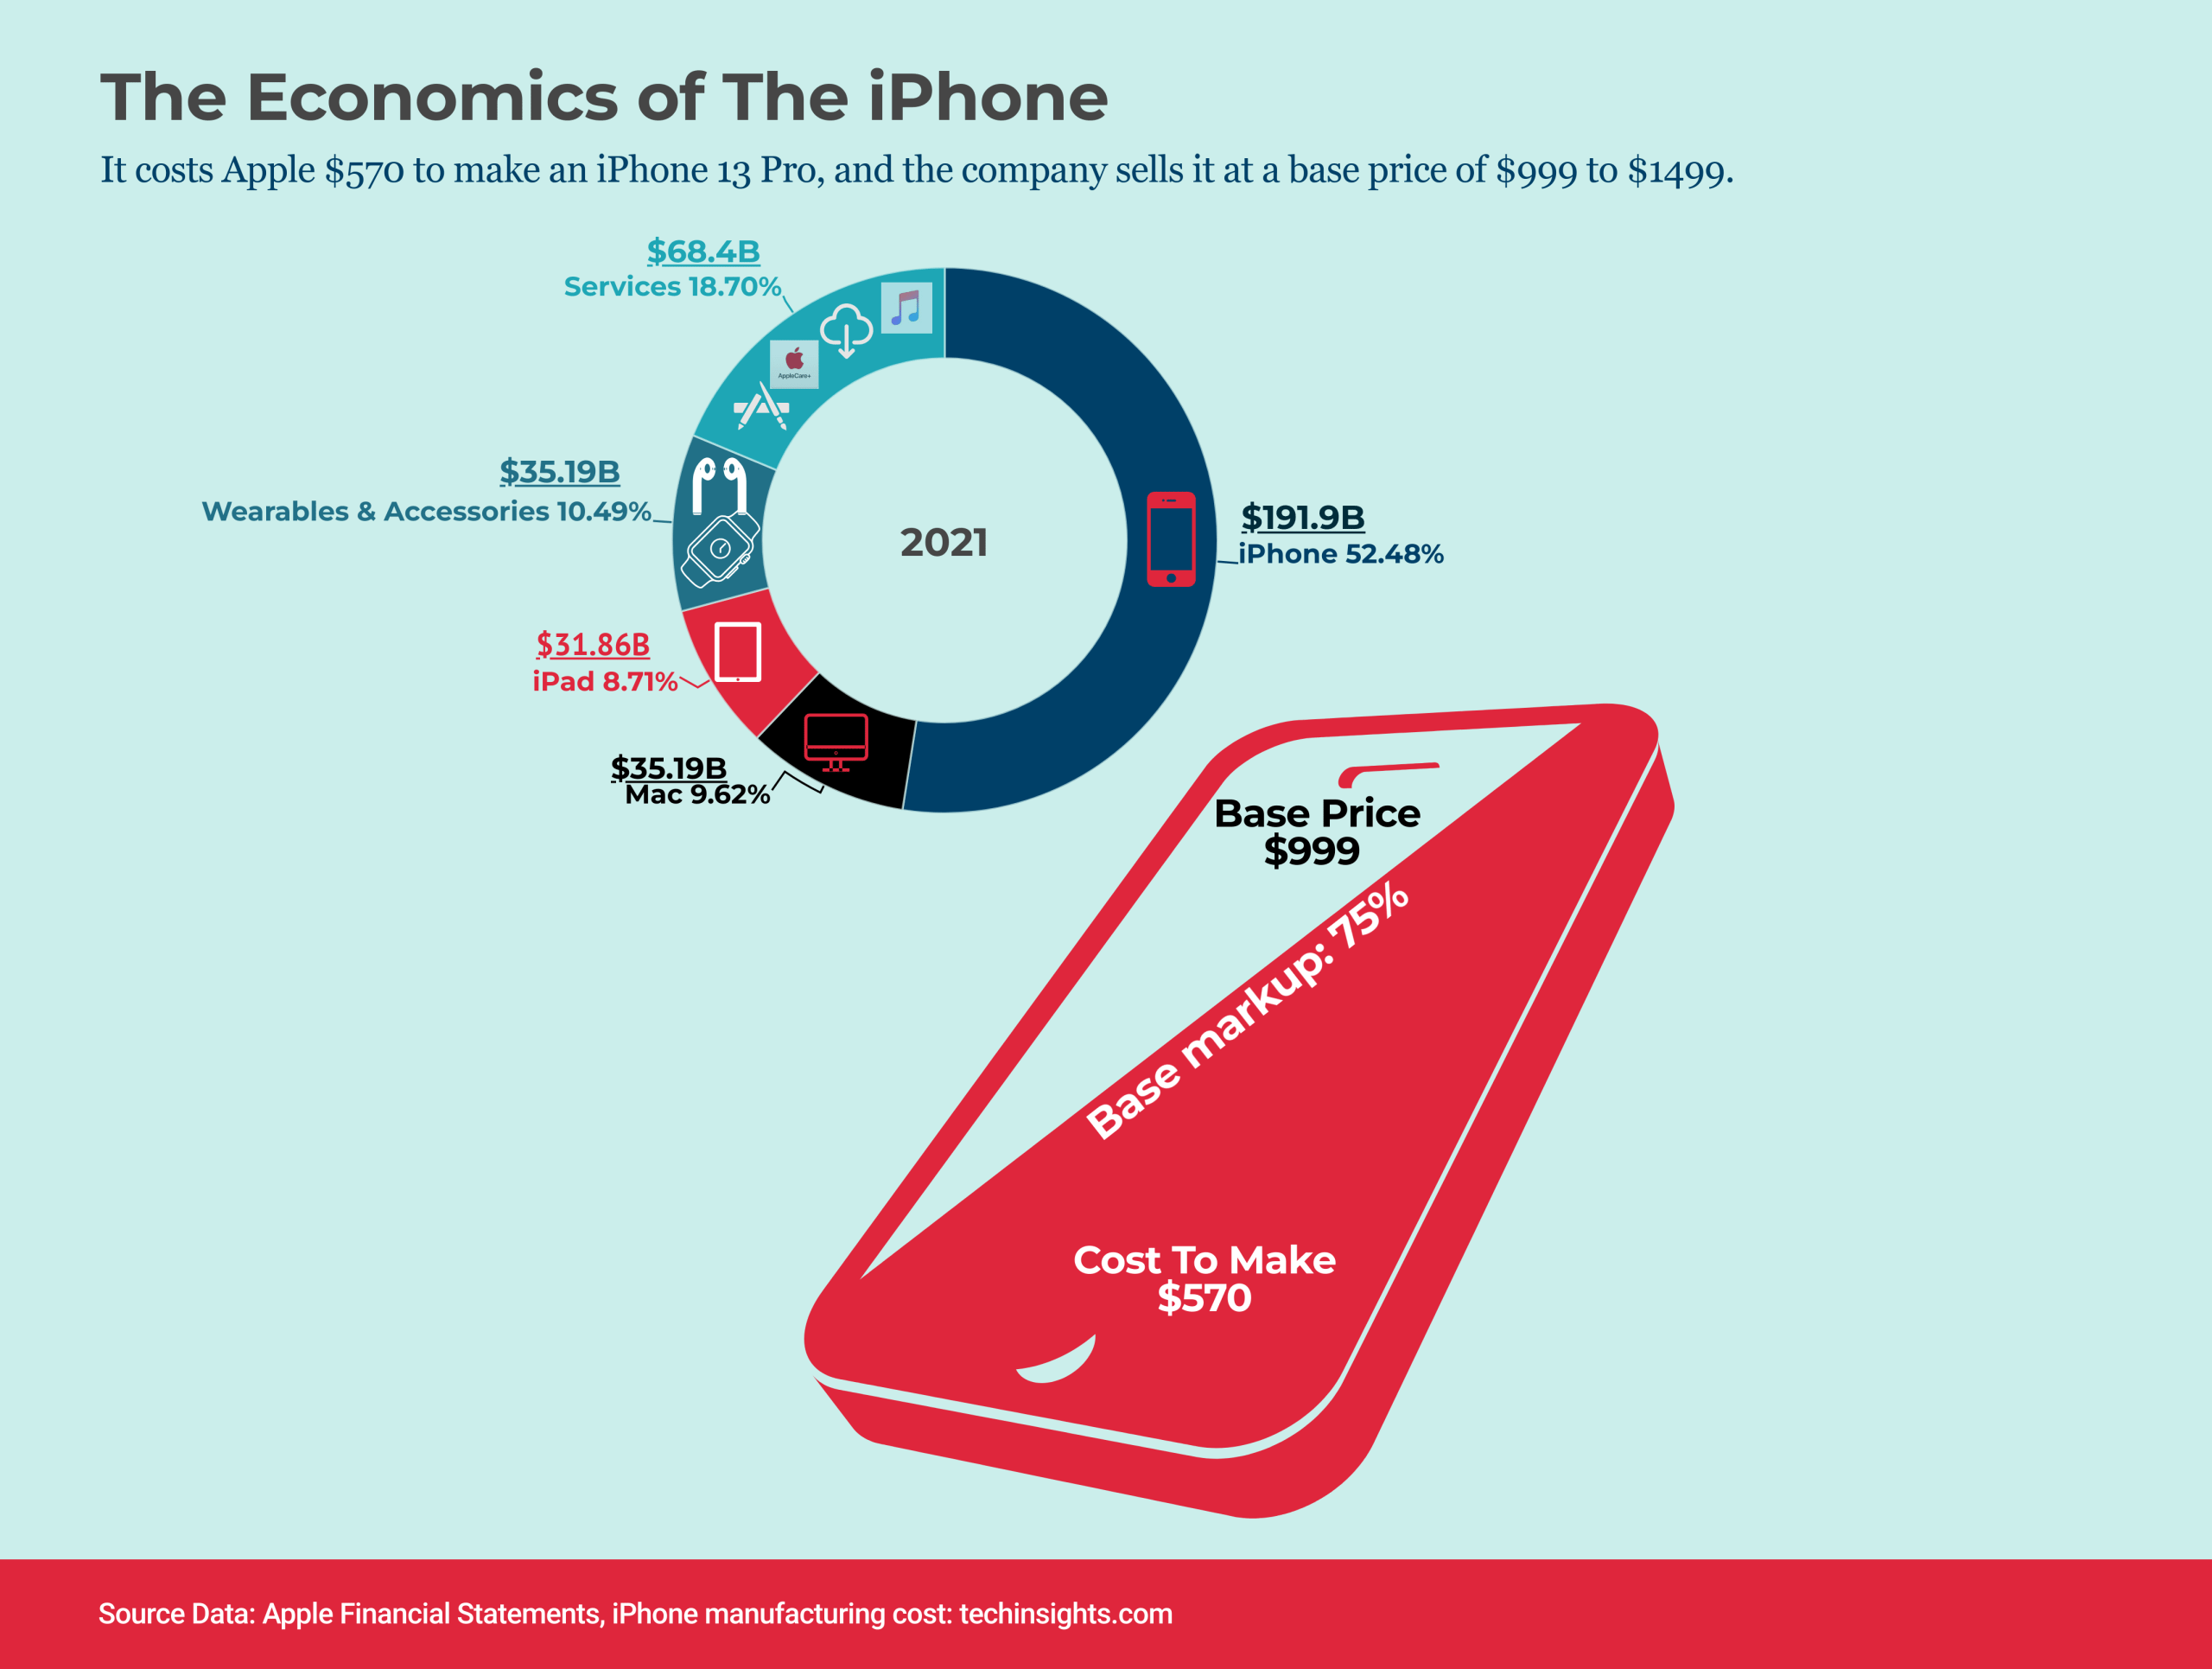
In another prior model – the iPhone X – it was estimated that the cost relative to price was the lowest among its top competitors (including its own predecessor):
Source: Tech Insights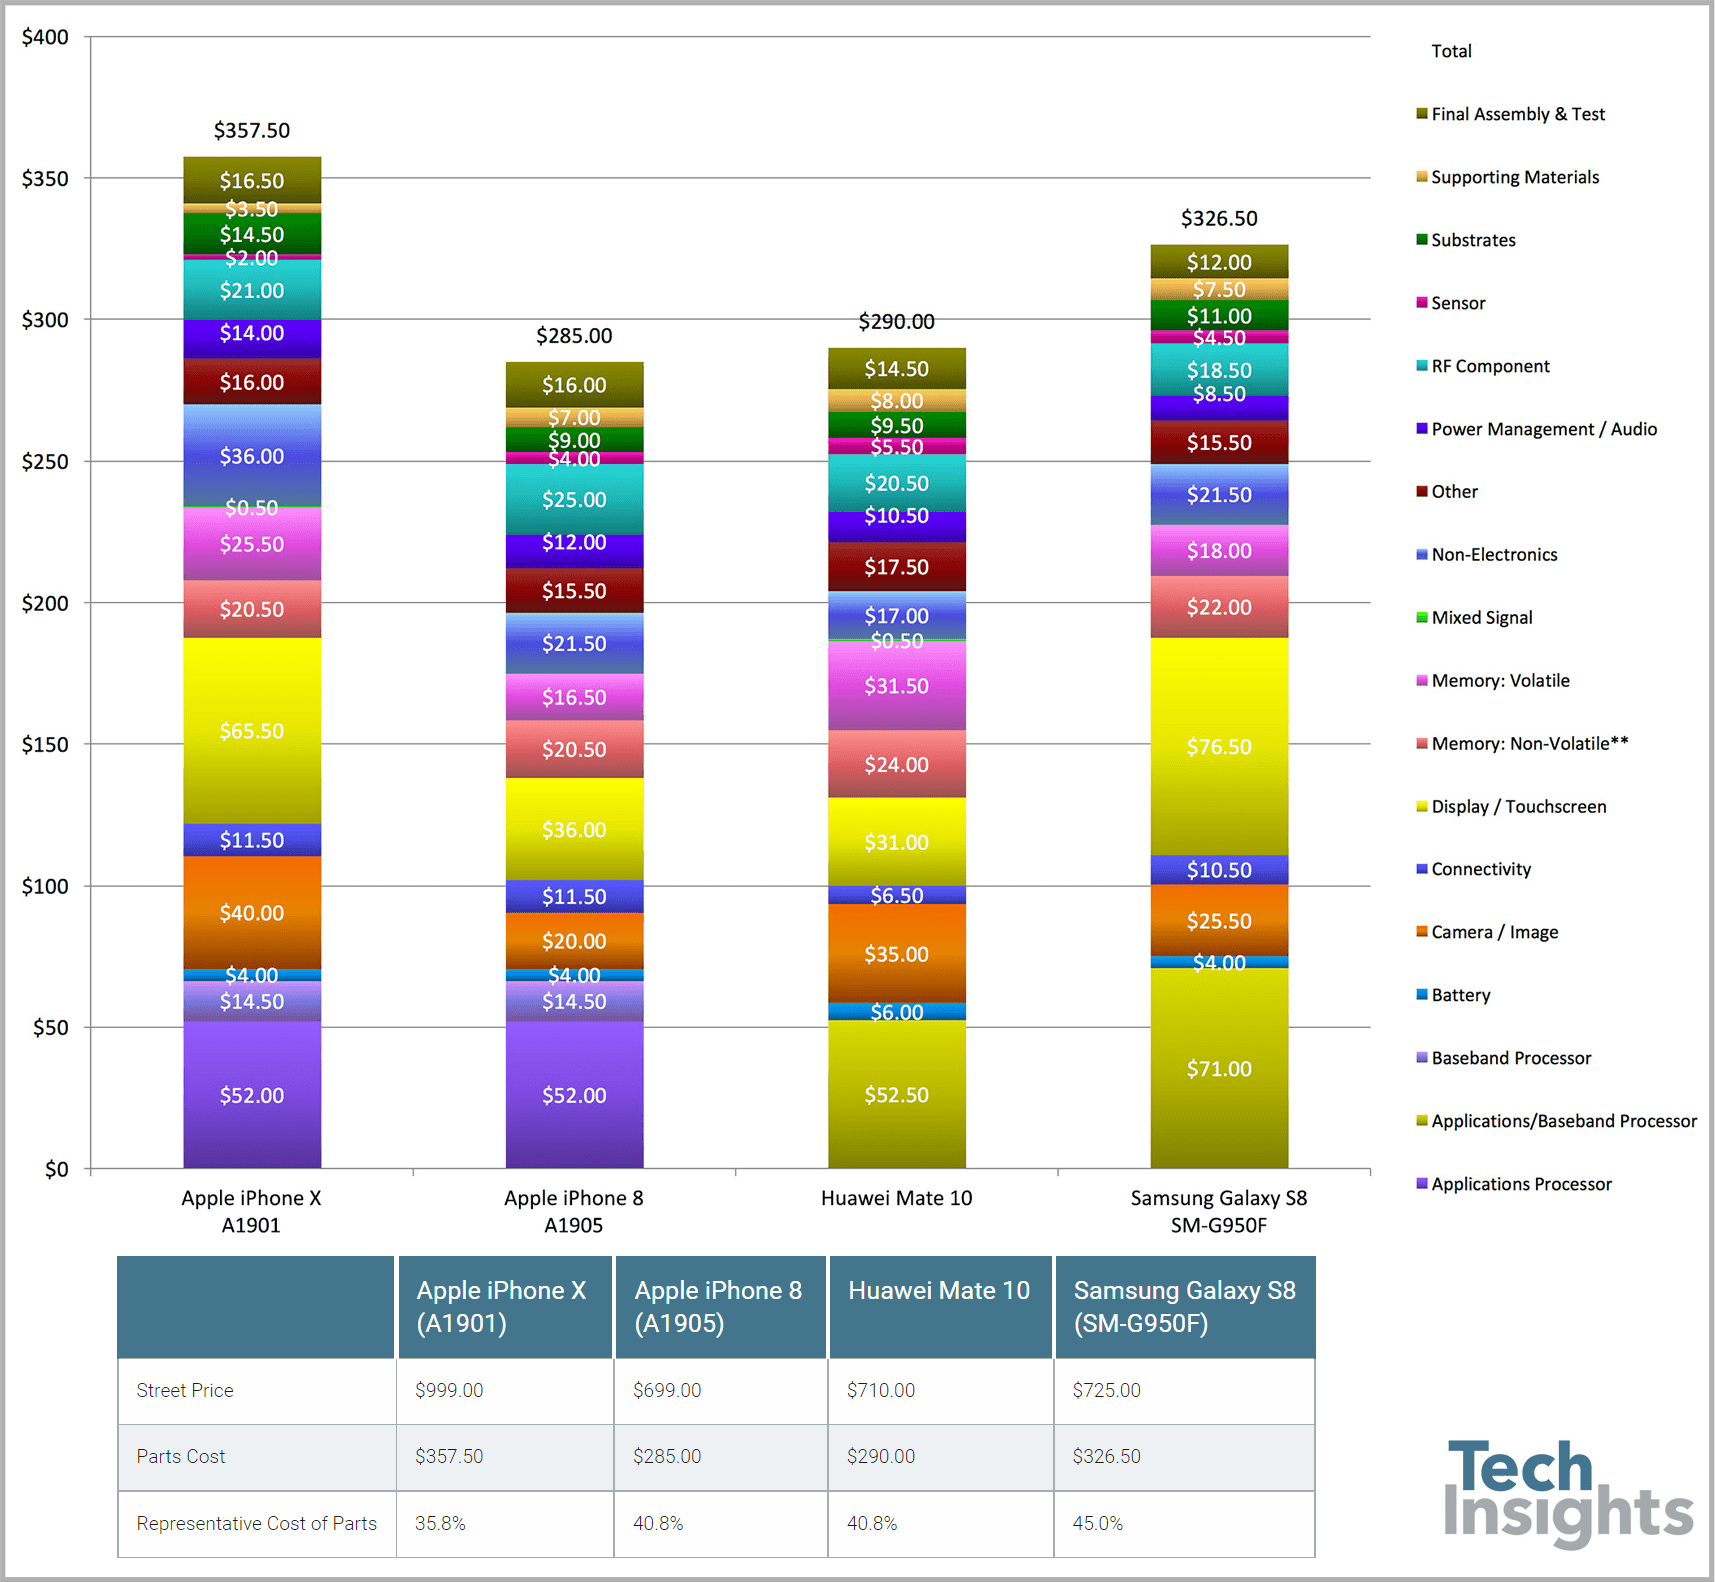
It’s a fair bet that the iPhone 14’s competitors – both present and future – would show a similar level of disparity in terms of the “cost-price gap.”
The higher price point doesn’t necessarily imply a better or feature-rich experience, as the company’s bête noire Samsung (OTCPK:SSNLF, OTCPK:SSNNF) – and comparable product manufacturer – is fond to point out. For example, in September 2012, Samsung ran an ad with the headline “It doesn’t take a genius” in major newspapers all across the Western Hemisphere touting its product’s features relative to those of the iPhone 5:
Sources: Samsung, FoneArena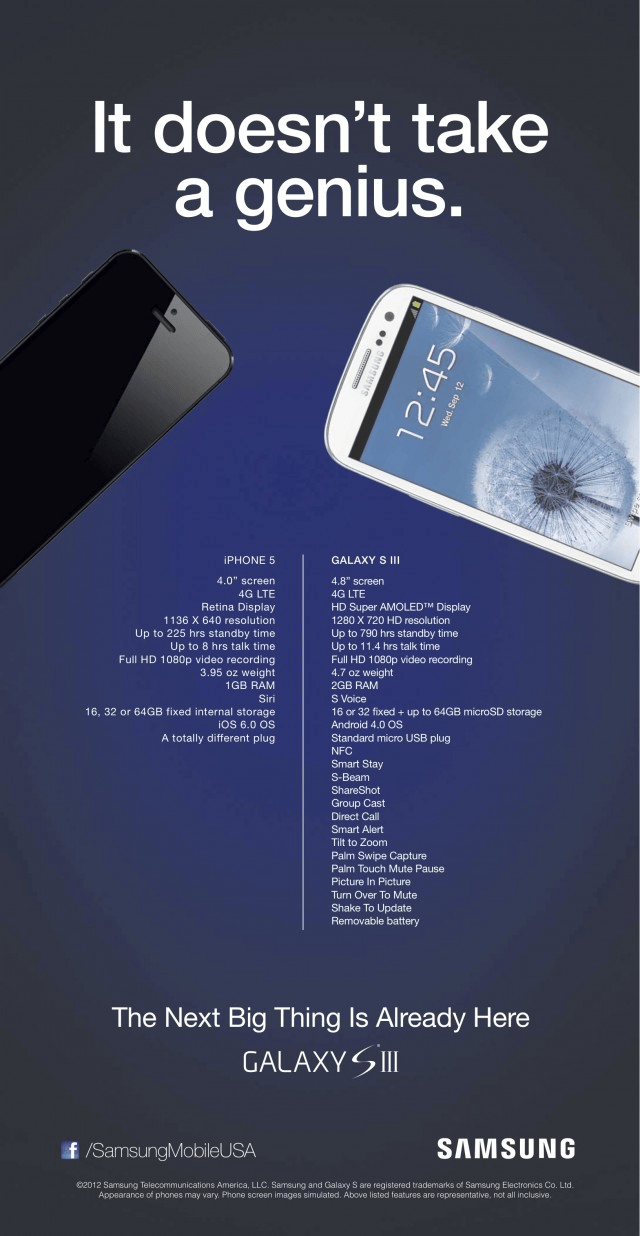
Almost exactly 10 years later, Samsung ran a series of social media campaigns about the iPhone 14’s big upgrade – the 48-megapixel camera:
Source: Samsung Mobile US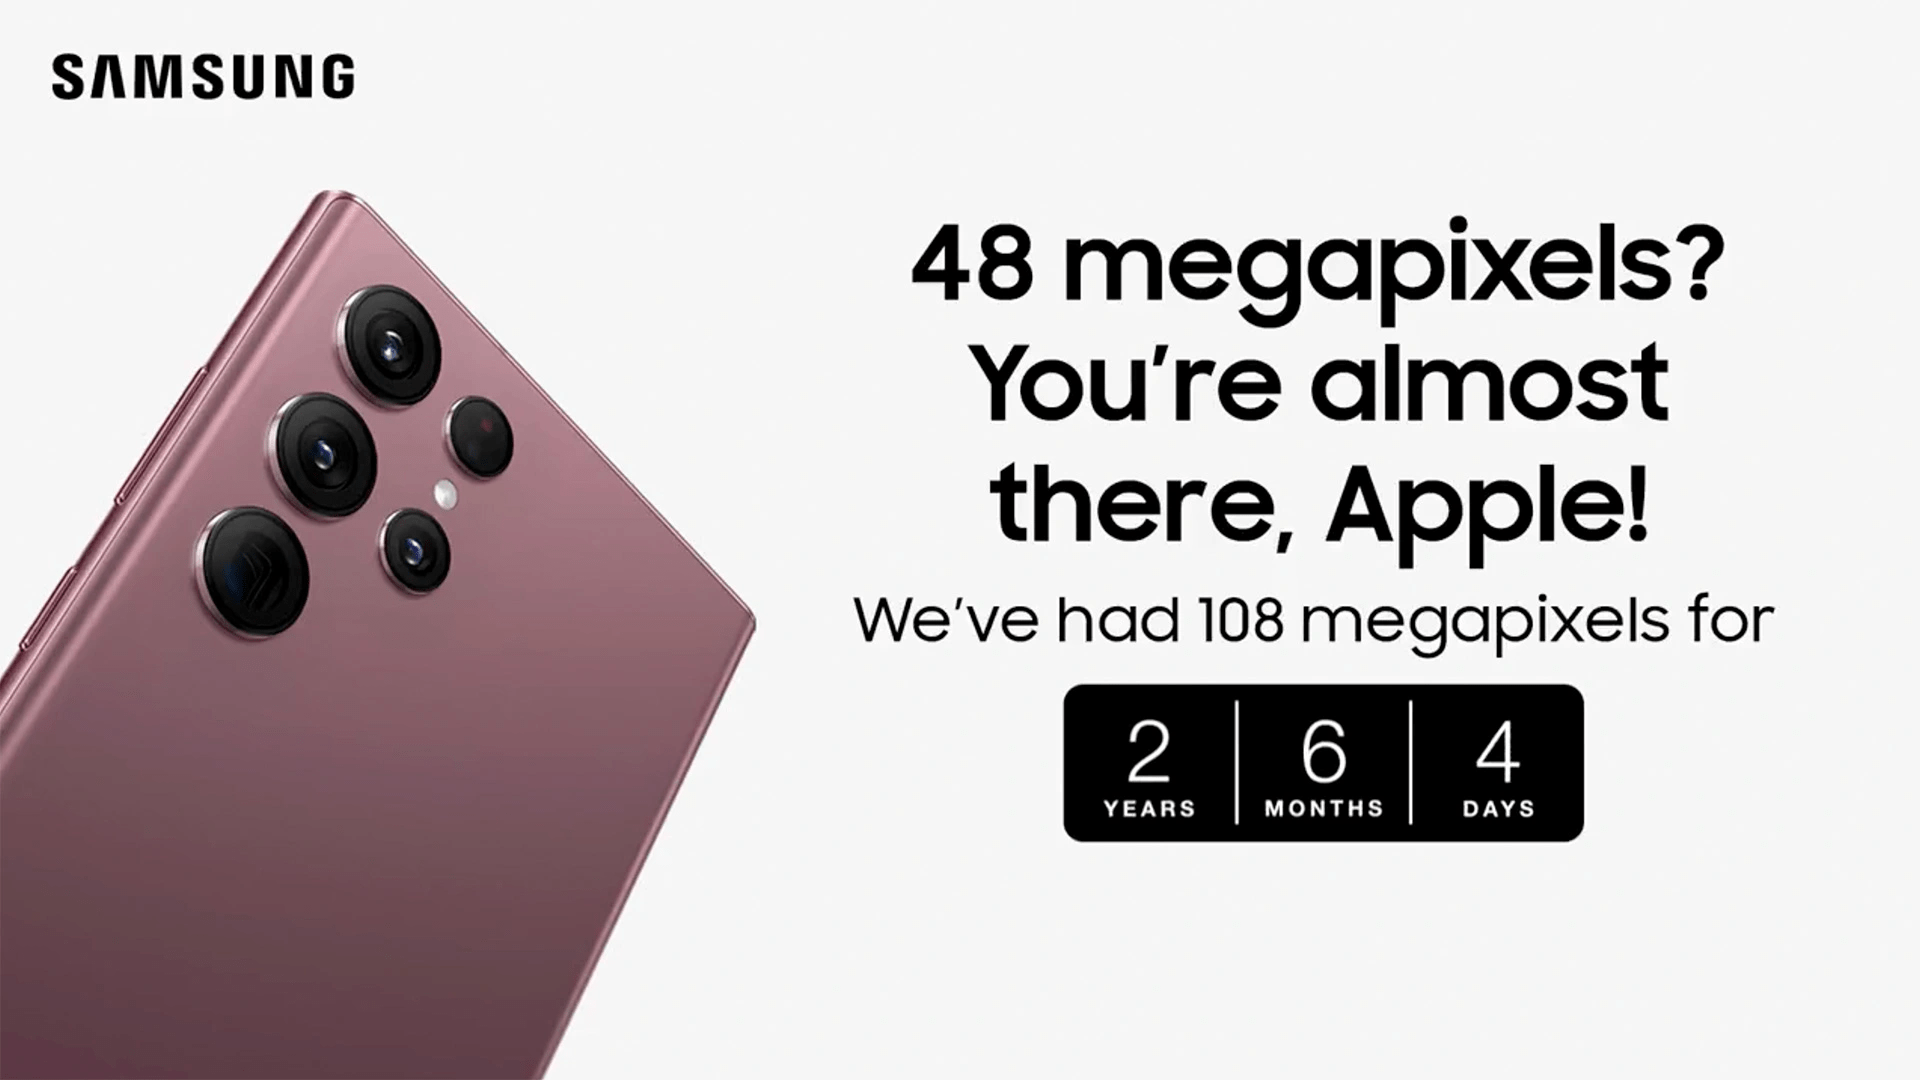
Apple’s Resilient Market Presence
Given that the company doesn’t necessarily produce “best-in-class” smartphones relative to their price points, the question of market resilience (at least in the U.S.) can be estimated in historical terms.
Firstly, the company’s excellent relationship with telecom service providers meant that the product’s high costs were “belayed” across a two-year period for the buyer. Historically, this meant that the provider would earn a little more than the phone’s upfront cost over a two-year period while locking the customer into a contract for that period. In exchange, the company is able to transfer the “payment default risk” off its books. Recent initiatives, however, have drawn the two-year payment plan’s costs largely on par with that of the upfront cost across all carriers, including the company’s in-house store.
Secondly, the company’s PR campaigns have fostered a unique sense of “social equity” among the buying public over the years. This sense of “social equity” from the mere act of owning a device has led to some rather amusing consequences: over the years, media outlets have highlighted surveys indicating that iPhone users in the U.S. prefer not to date Android phone users. For example, a survey by Match.com confirmed this in 2017 while a survey by Decluttr confirmed it again in 2018 (a result that was even picked up by Bloomberg). In 2022, a survey by British price comparison platform MoneySuperMarket (which also received significant mentions in digital media) on dating sites across the Western Hemisphere where the device used by a profile is shown indicate that Apple users get more matches than Android users.
Quick Note: Surveys are only as good as their sampling techniques and ripe for all sorts of interpretation. Example: in 2022, app-based motor insurance startup Jerry found that Apple users tend to be poorer, have lower credit scores and are worse drivers than Android users. All the surveys mentioned were done on relatively smaller scales and aren’t as carefully designed as those executed by, say, the Pew Research Center.
The prevalence of this imputation of “social equity” is a masterclass series in “branding” that business school graduates, startup founders, “tech gurus” and influencers have studied and emulated ever since it became apparent that not being the “best-in-class” doesn’t necessarily exclude one from being able to lead in a race.
The third point is rather intuitive: switching devices is a relatively easier experience if the new device has the same operating system. iOS is exclusive to iPhones while Android users have a wide range of phone makers to choose from. Thus, it’s more likely that an existing iPhone user will switch to another iPhone. It bears noting that this is largely a matter of perception: given that the “range of use” for most smartphone users is rather standardized, the learning curve for device switching in either direction is essentially flat.
The choice of “paying more” for “less” isn’t necessarily a choice that most customers would be comfortable with in more recent times.
Global Smartphone Shipments
It has been estimated that, as of Q2 2021, the company’s share in global smartphone shipments have shrunk back to nearly Q1 2021 levels:
Visualization by Counterpoint Research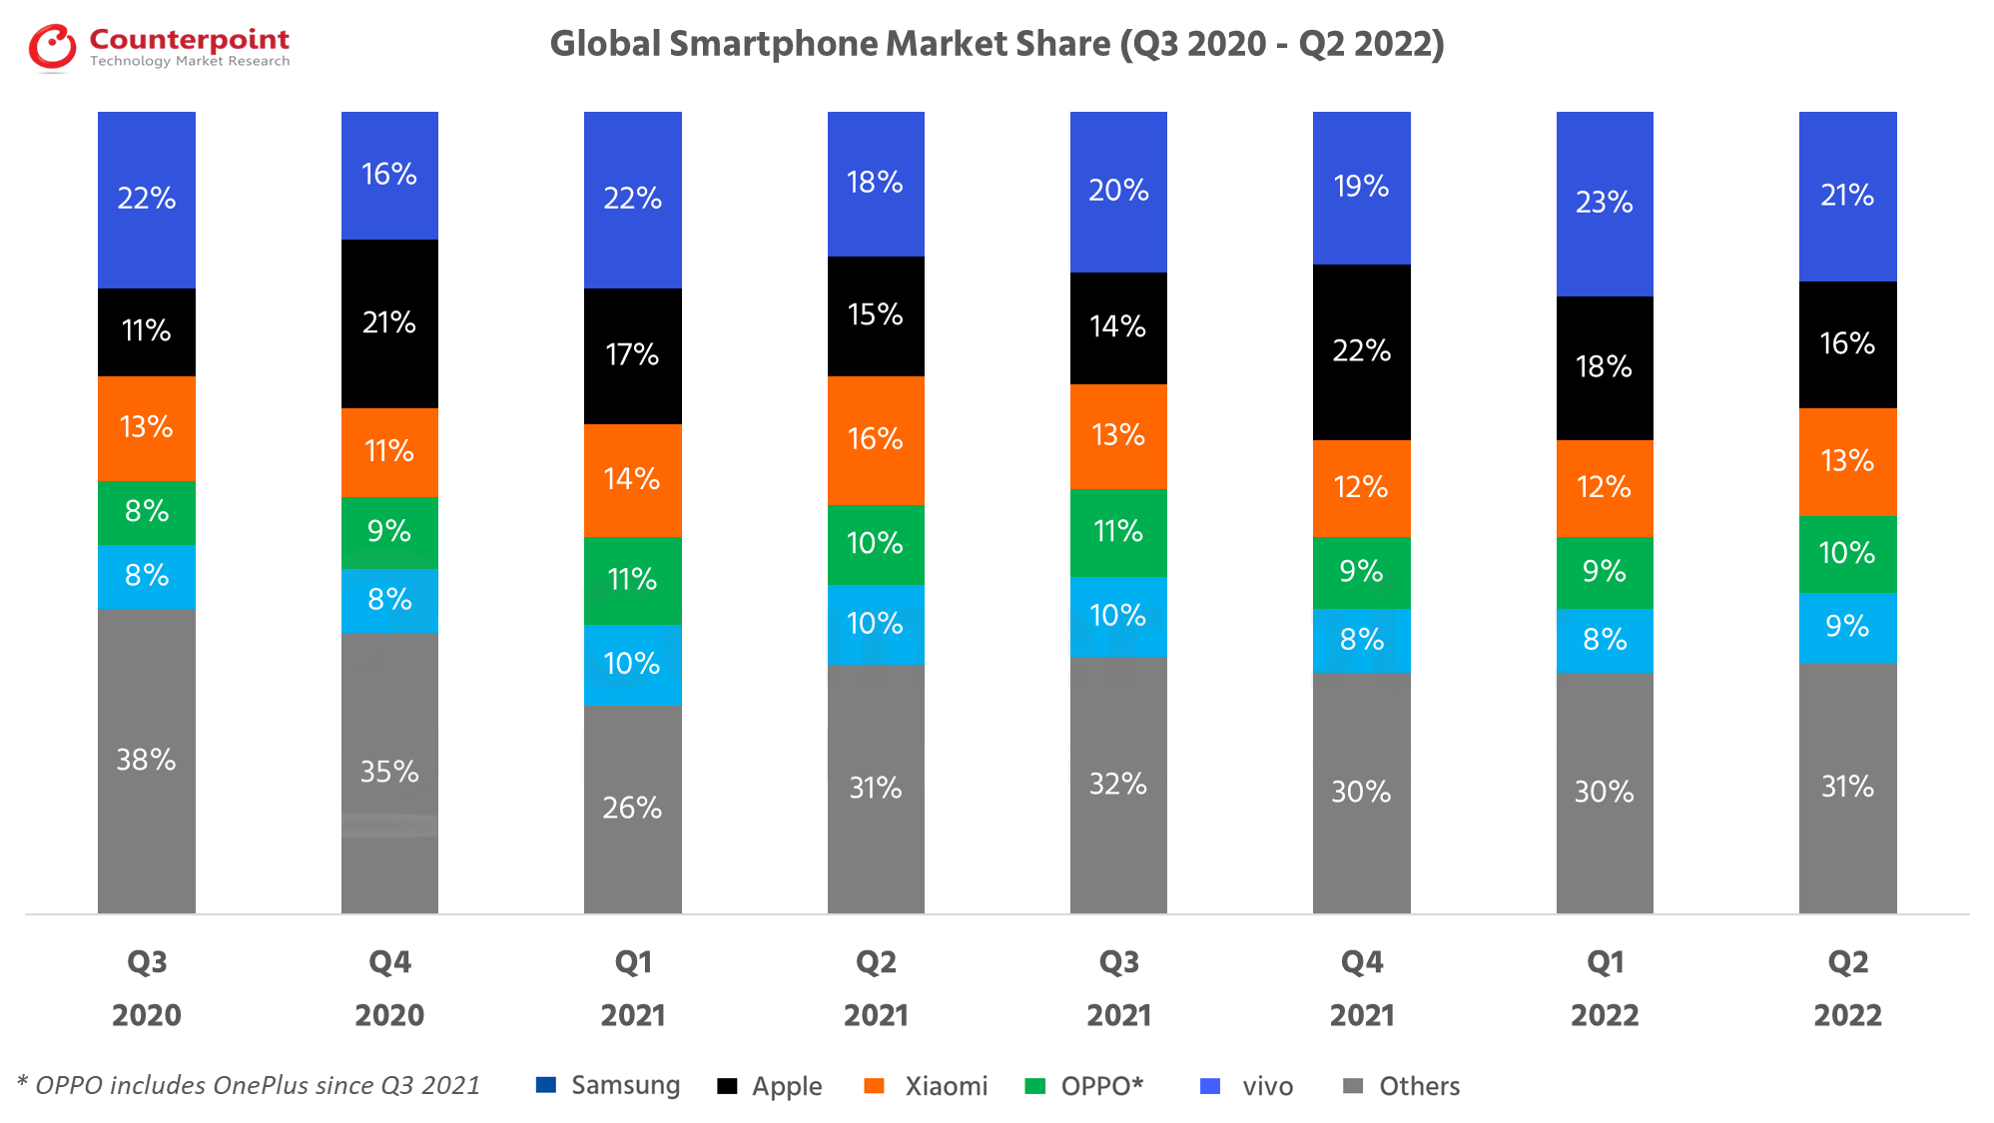
In the U.S., the company’s market share has shrunk back to Q3 2021 levels, with Samsung being a net beneficiary in recent times:
Visualization by Counterpoint Research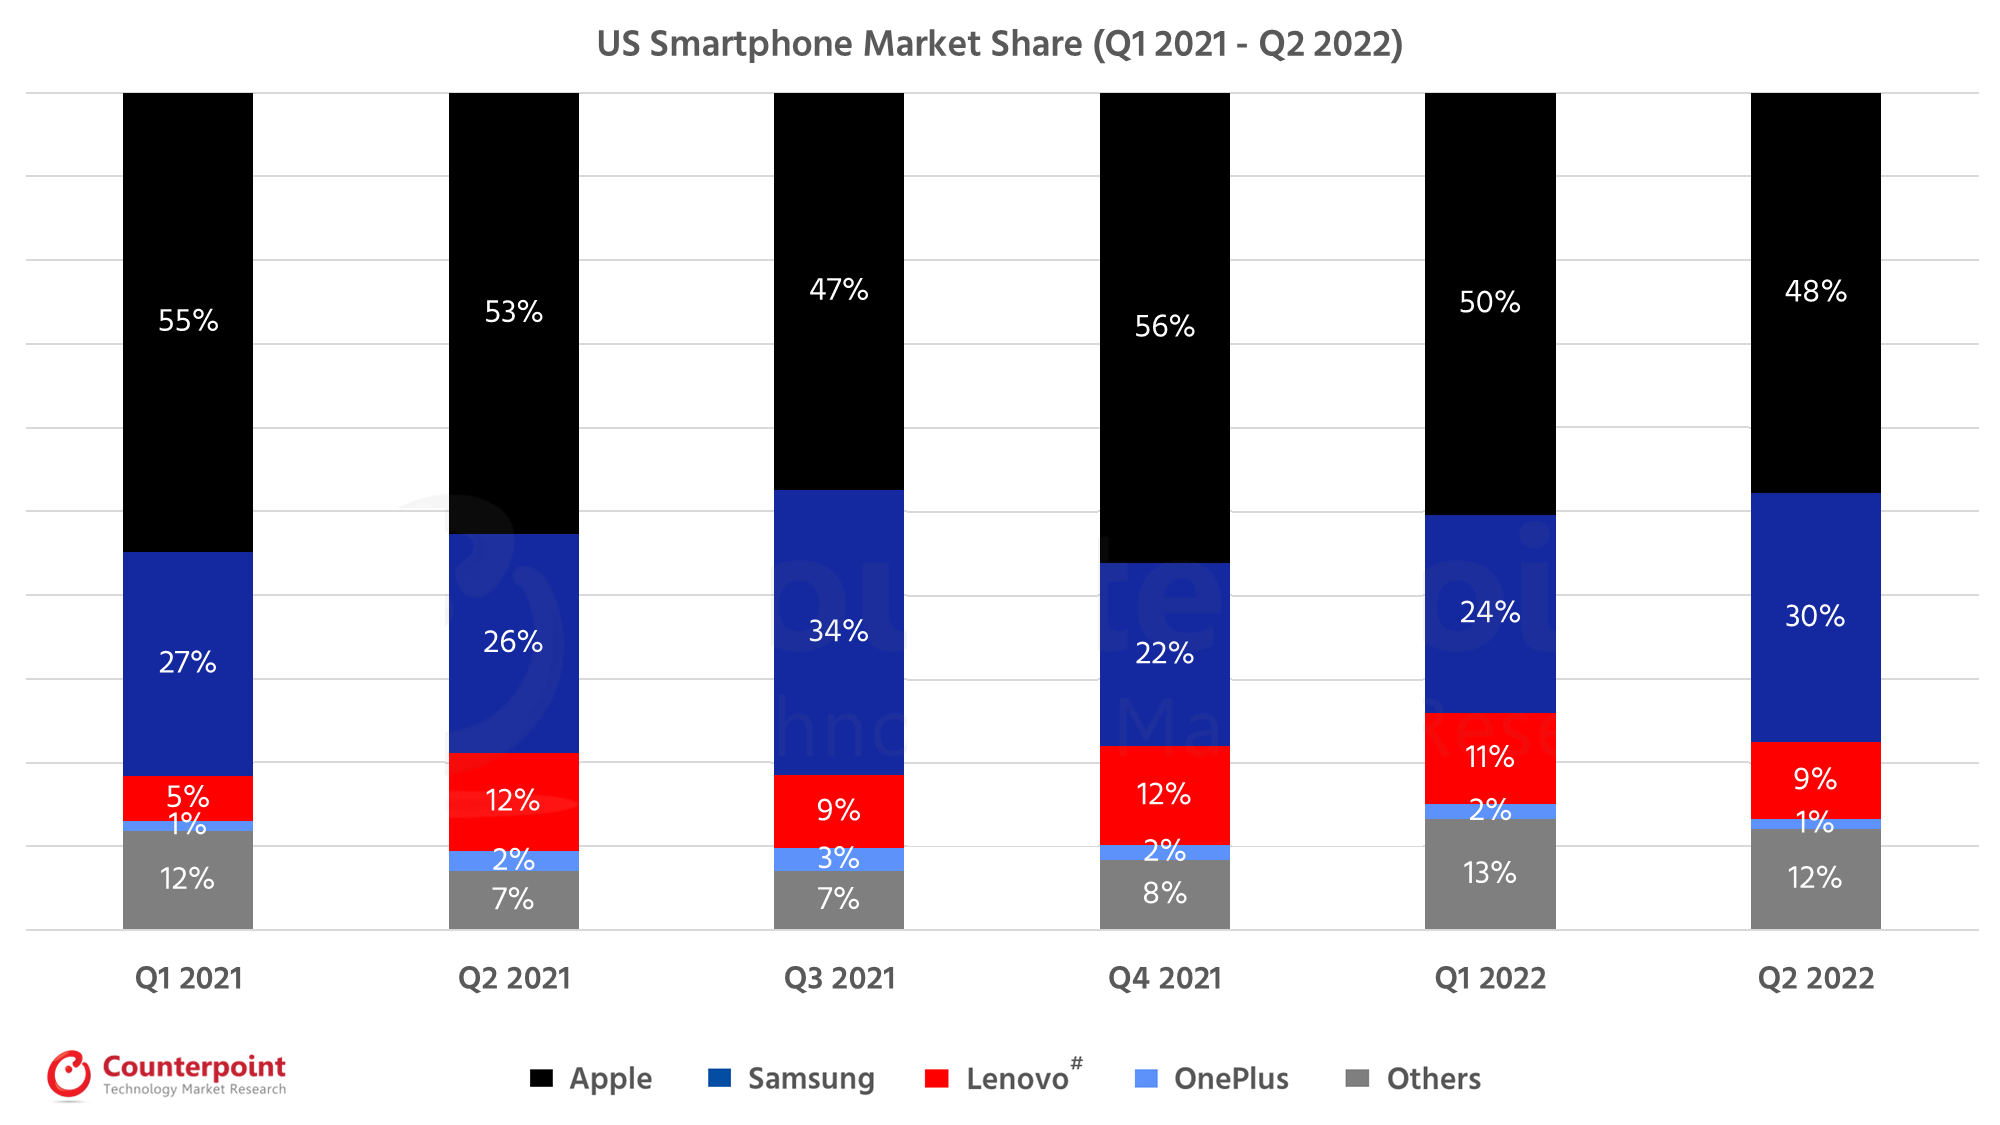
However, it bears noting that smartphone shipments have been falling in the YTD:
Source: Counterpoint Research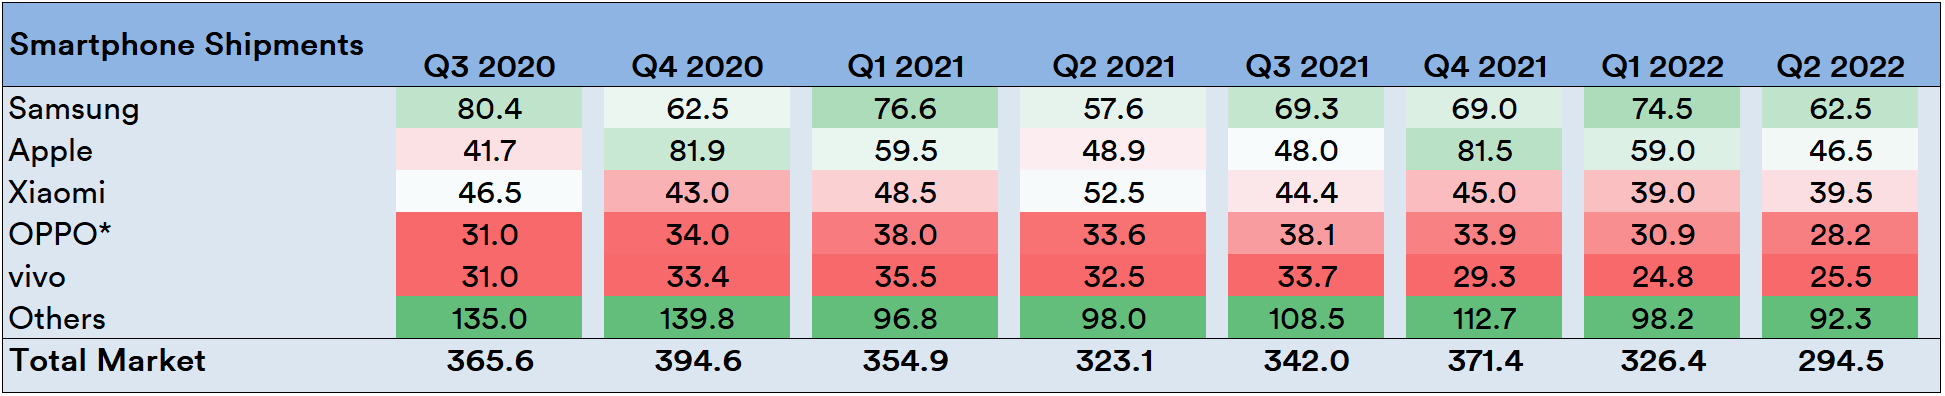
The quarter-wise “heat map” indicates that neither Apple nor Samsung have maintained a constant winning streak in comparative performance.
In terms of pricing, Apple products globally and predominantly compete against a set of products offered by Samsung and Xiaomi. In the QoQ trends in the YTD until Q2 2022, Apple has had a precipitously larger fall in shipments relative to the other two global rivals:
Source: Created by Sandeep G. Rao using data from Counterpoint Research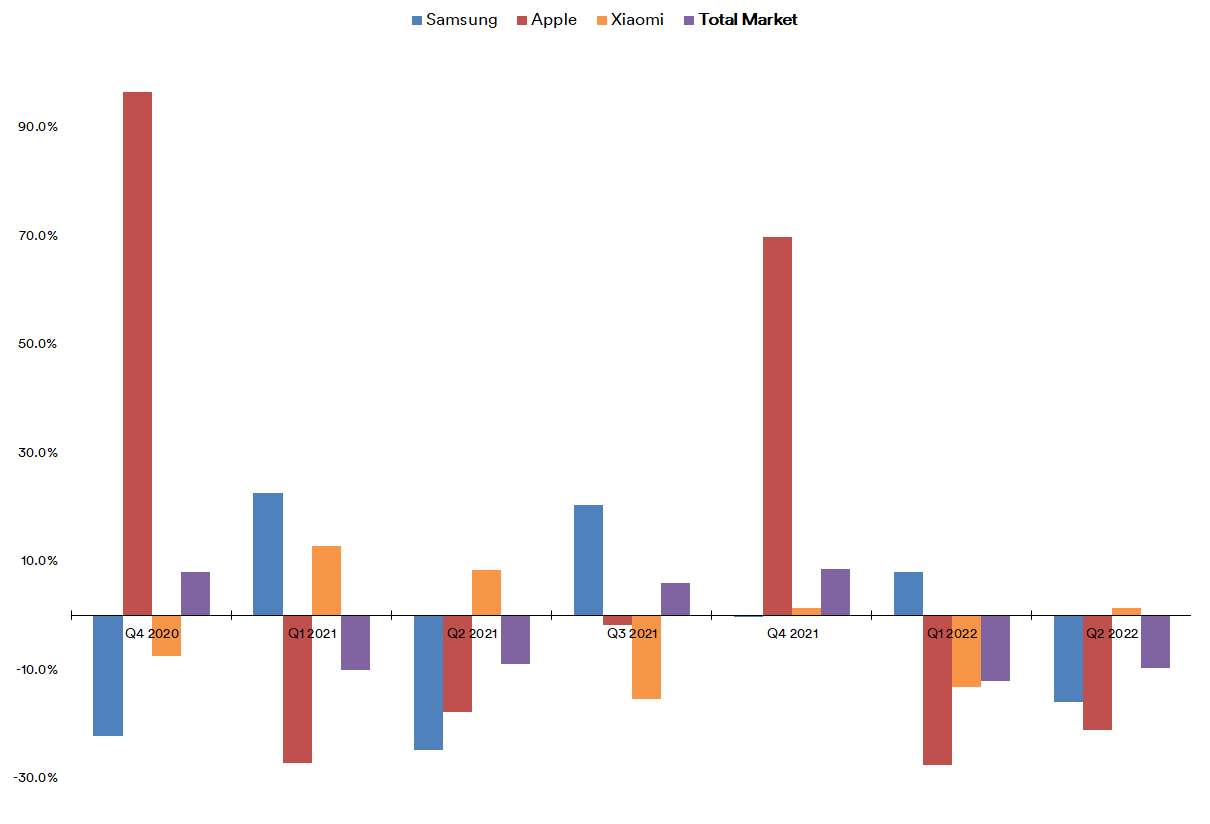
As the previous article on the macroeconomic outlook indicated, there is an increasing tendency among the U.S. buying public to not spend, given inflationary effects and rising debt (and loan defaults which the Federal Reserve considers to be “masking potential distress”). Paying “more” for “less” for the sake of “social equity” doesn’t make for a whole lot of economic sense right now.
Price Ratio Trends: Select
There’s a very good reason why the company’s stock should be considered a “bellwether” indicator for the S&P 500 (SPY) and vice versa. Lets simply consider the Price to Earnings (PE) Ratio of the two in recent years:
Source: Created by Sandeep G. Rao using data from GuruFocus and Zacks’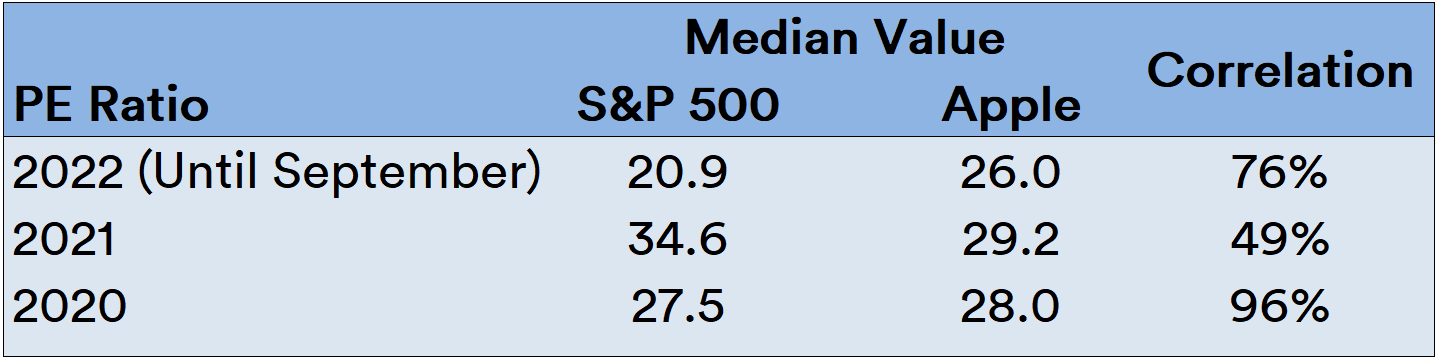
The median value is a reasonable “baseline” for longitudinal trends when coupled with correlation of observations. While observations can indeed go north or south of the median, the correlation will advise on its degree of “correctness.”
With this in mind, 2020 was a stalwart year: the implied P/E Ratio of both the index and the company’s stock were nearly identical with a very high correlation. The buying spree observed in the company’s products in 2021 imputed a much higher median on the company’s stock price and upended the correlation with the index, thus imputing an “overvaluation” effect. In the YTD, this effect is winding down and correlation displays a “steady increase” effect in more recent observations.
Source: Created by Sandeep G. Rao using data from GuruFocus and Zacks’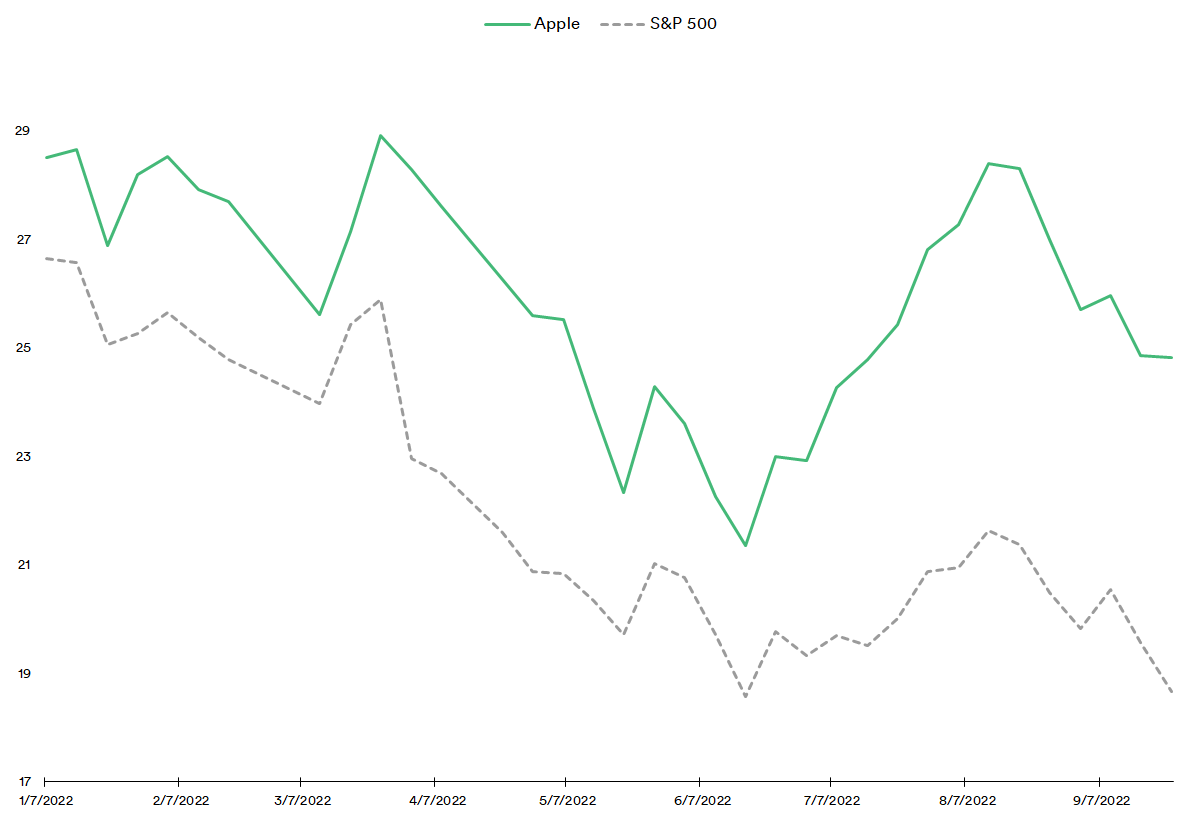
What also needs bearing in mind is that the S&P 500’s P/E Ratio is nowhere close to the historical average built up over the course of the 21st century and much farther away from the lows seen in the financial crisis of 2008.
Source: currentmarketvaluations.com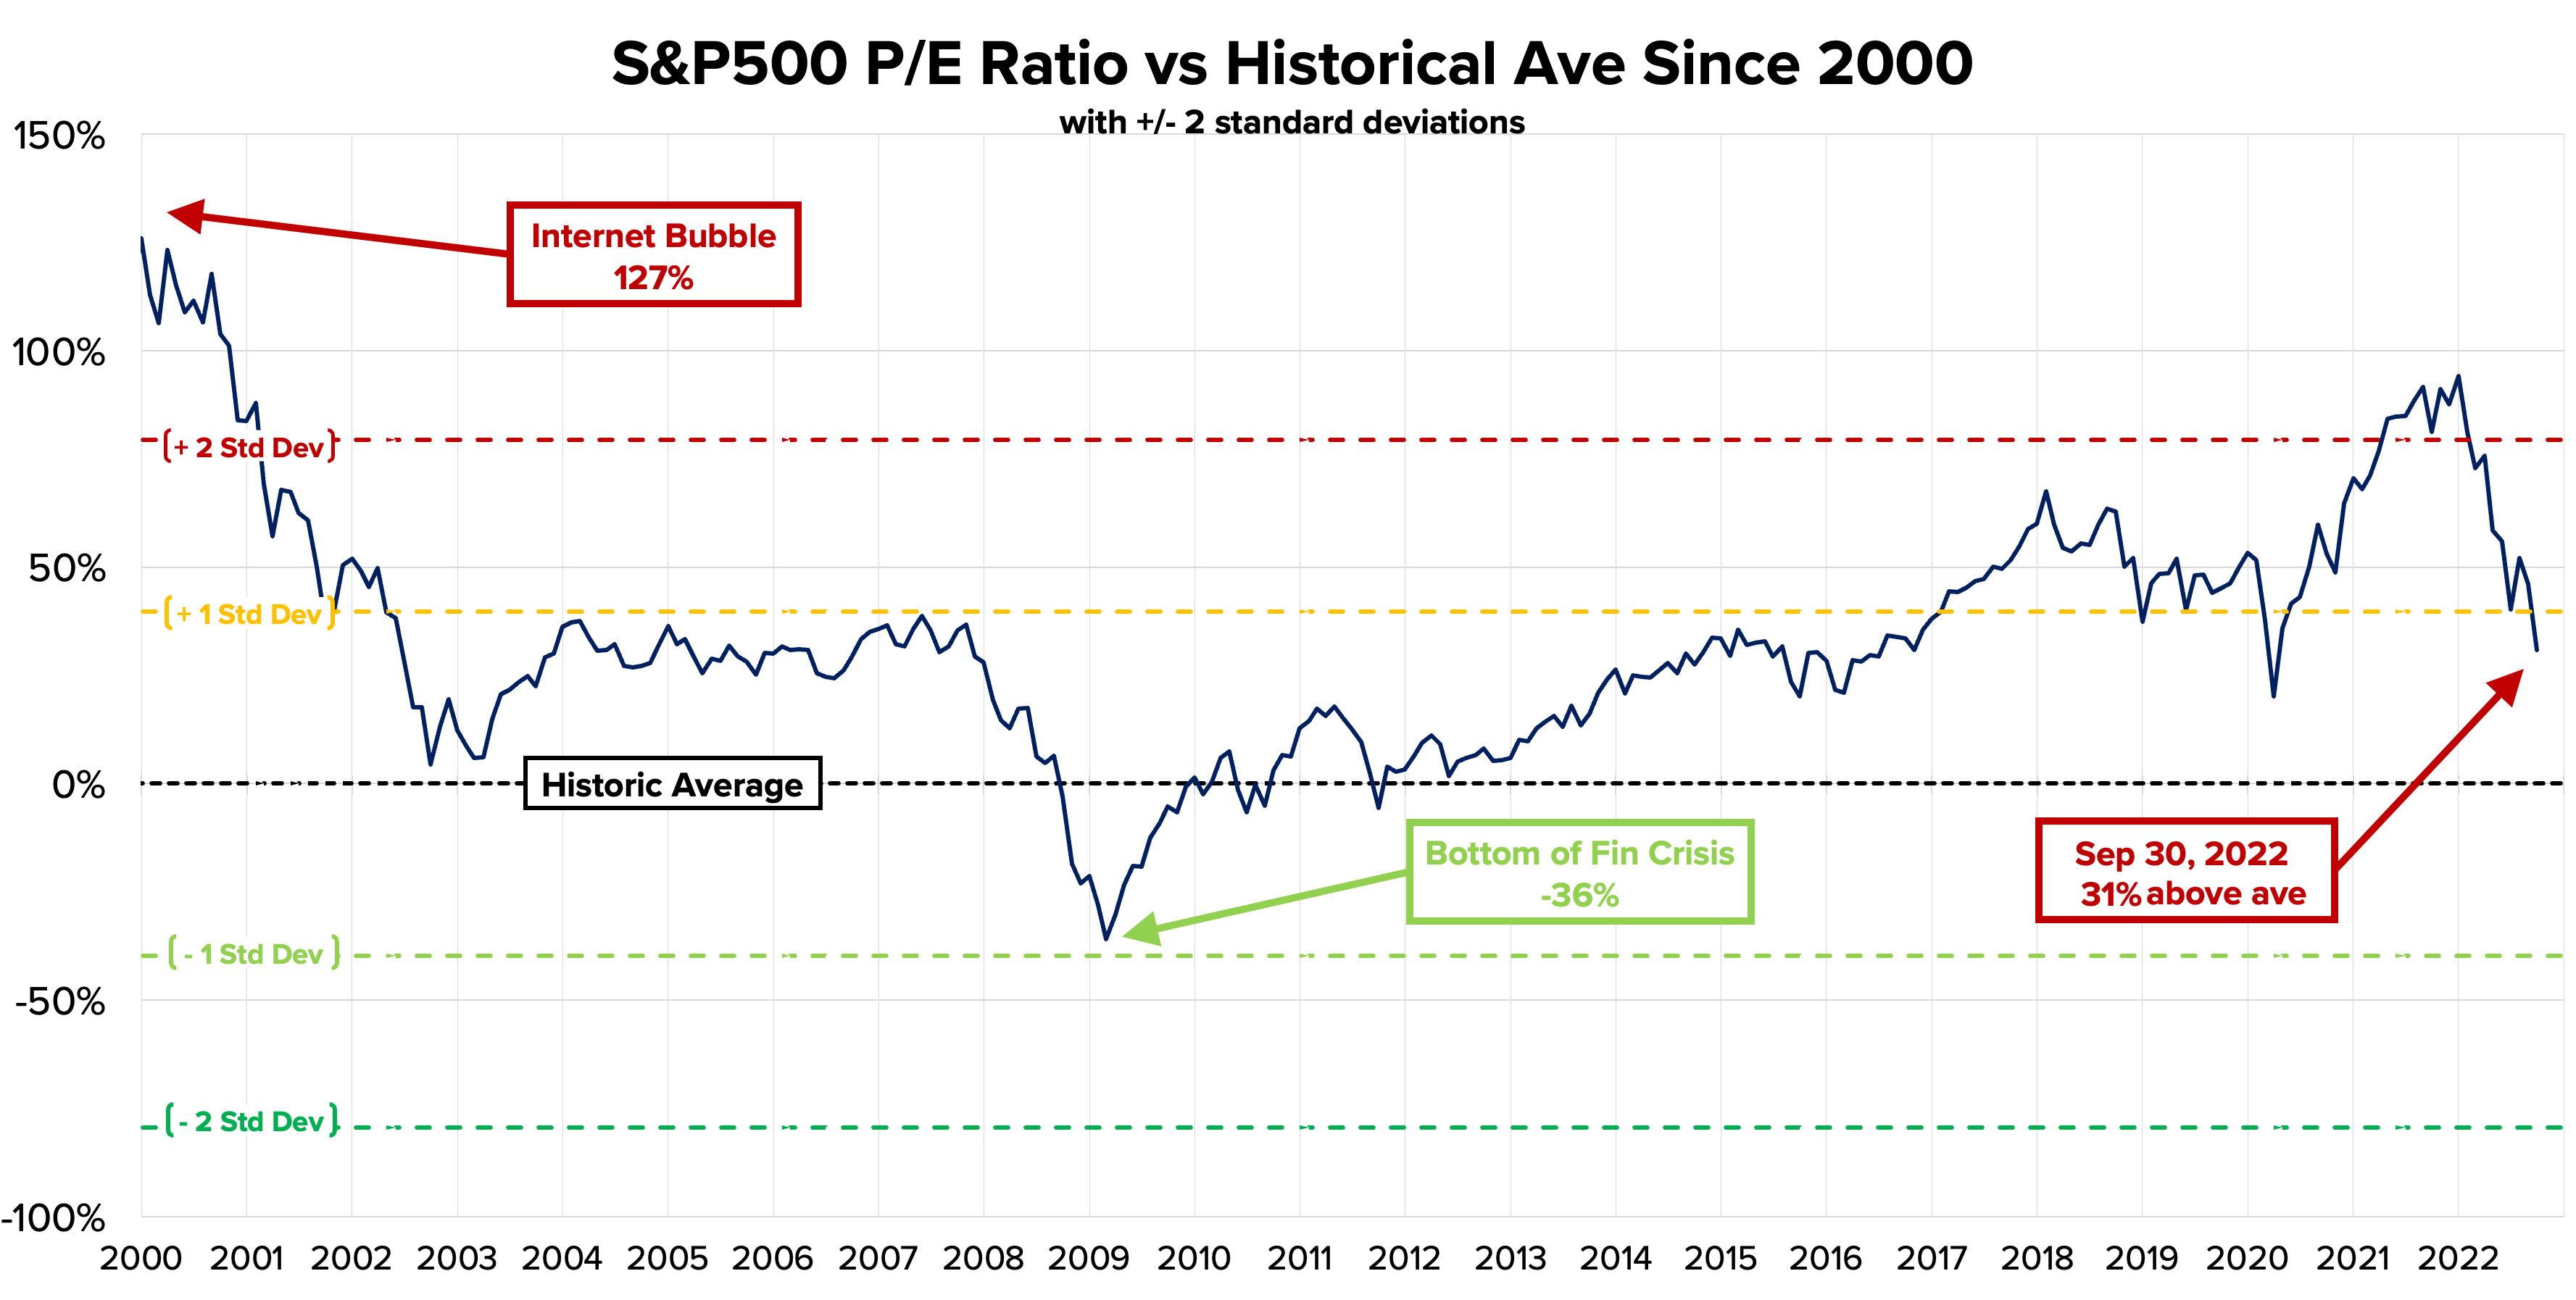
In other words, given the company’s historic “bellwether” status with the S&P 500 and the fact that the underlying factors affecting consumption haven’t received adequate remedy yet, there is no reason to assume that the bottom is apparent just yet – either with the index or the company’s stock.
Conclusion and Recommendations
Given trends in revenue shares, Apple is currently inching towards being more of an “American smartphone” company than a “global hardware and media” company. However, the two-tiered revenue segment study does indicate that, even with lower-trending sales volumes, the higher product price commanded by the products implies a potential for at least matching previous FY revenues if there continues to be a buy-in on the “brand” by a reasonably smaller set of customers. This means that the company can – at least in theory – continue to attract a “creamier layer” of buyers as the price increases. Increasing exclusivity is par for the course in brand-building.
If this were to happen, this likely wouldn’t bode well with analysts in investment houses; they would be obliged to model the company’s valuation with different comparators and, thus, a very different earnings outlook. However, the company seems to be banking on entering emerging markets with “budget” models: aggressive sales and promotional campaigns centered on revamped models of its SE stable – which haven’t been very encouraging in the U.S. – have enabled it to capture 3% of the Indian smartphone market in Q2 this year. However, India – like most other countries in South/Southeast Asia in general – is home to a mature customer base with highly variegated requirements, leading to a vast plethora of pricing bands for “gaming” handsets, “media” handsets (i.e., phones with good streaming or audio capabilities) and so forth. As a result, Apple’s “budget” handsets fall into the “ultra-premium” category in India and most other parts of Southeast Asia.
Banking on sales volumes from emerging markets might not be the best prognostication for forward-looking growth in sales for Apple. In the present, however, there’s an interesting project that the company is working on: the “Titan” Electric Car project, which some sources expect to be launched in partnership with an established automaker in 2024 or beyond. It can be considered a safe bet that this project won’t necessarily lead to a mass-market offering. In any case, a bullish outlook based on this project in the present day would be premature.
As the previous article stated, investment houses are beginning to estimate an actual “technical” recession (as opposed to a mere “testing of lows”) will roll into the U.S. sometime around the second half of next year. Investment houses aren’t consistently right but they do adjust for new data – both qualitative and quantitative. An evolving view in a number of closed-distribution reports indicate that the notion of a U.S. recession is increasingly feasible and stateable. Given this, a recommendation to “buy” for investors looking to secure gains over a 12-month horizon cannot be made in good conscience at the present.
On the other hand, the company has historically shown very solid line item discipline. There’s ample argument that the company’s recent cutback of production targets while banking on higher-margin iPhone 14 Pro model sales over that of budget models makes the stock more of a “value” stock than a “growth” stock. However, “value” stocks tend to not be as overvalued as “growth” stocks. For investors looking to hold the stock for a period in excess of a year and beyond, this might be a decent candidate for consideration.
For investors looking to buy in regardless, it’s an even bet that there will be ample opportunities to “buy the dip” during the inevitable “retesting of lows” upcoming over the next few months. However, a return of the valuation highs seen in (let’s say) 2021 isn’t a provable given.
Overall, there’s ample cause to adopt a “wait and watch” approach. Hence, the recommendation is to “Hold.”
Be the first to comment