Sean Gallup/Getty Images News
Investment Thesis
As inflation accelerates and the rhetoric of central bankers tightens, analysts are revising their forecasts for personal consumption expenditures. The decrease in PCE will largely affect the upper mid and premium segments of the technology hardware market in which Apple (NASDAQ:AAPL) operates. The decline in production orders for the iPhone SE due to weak demand is one sign of a possible slowdown in sales. In addition, there are risks of lower profitability due to a decrease in the share of services in the company’s total revenue and macro factors. Although the decline in consumer spending and high inflation are challenges common to many industries and companies, they are not reflected in the current price of Apple. The company is trading slightly below its all-time high. According to our DCF valuation, the company is trading near its fair price. We rate shares as a Hold.
Growth Challenges
If in June 2021 11 out of 18 members of the Federal Open Market Committee expected that in 2023 the interest rate would be only 0.5 percentage points higher, then in March of this year the central bank predicted that by the end of 2023 the rate would reach 2.75%, which means 11 hikes of a quarter of a percentage point each. Investors always keep in mind that tightening monetary policy leads to an increase in the discount rate and to a decrease in the net present value of the future cash flow that the company generates. However, an equally important consequence of the hawkish policy is the reduction in personal consumption expenditures, which has a particularly strong effect on cyclical industries. Apple operates primarily in the upper mid and premium segments of the technology hardware market, which are quite cyclical.
After an explosive 2021, a slowdown in growth is expected, but it might be more significant than previously expected. The iPhone unit accounts for $192 billion in sales or 52.5% of the company’s total revenue. At the end of March, market research firm TrendForce lowered its smartphone production forecast for 2022 from 1.38 billion to 1.366 billion units. Recently it became known that Apple has reduced production orders for the iPhone SE due to weak demand. In addition, Mark Liu, TSCM’s Chairman, said there is a decline in demand for smartphones, PCs, and TVs in emerging markets, especially in China.
A similar situation might be with the Mac unit, the second segment of the company, which accounts for $37.4 billion, or 10.2% of revenue. The main driver of the unit is the new M1 processor. However, before the pandemic, the segment grew unevenly, and this trend is likely to continue.
Created by the author, based on 10-K
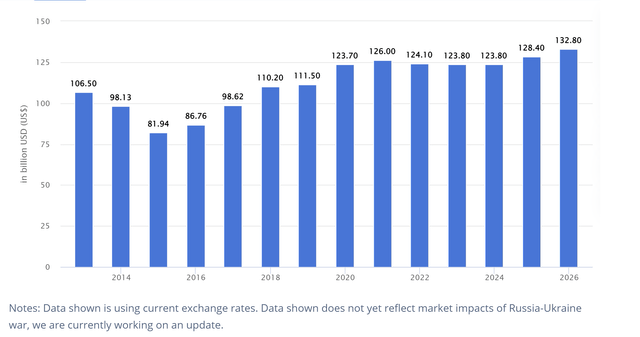
According to Statista’s analysts, total laptop market revenue will decline from $126 billion to $124.1 billion in 2022 and remain flat until the end of 2025.
Profitability Challenges
In recent years, one of the key drivers of Apple’s growth and profitability has been the growth in the share of the highly profitable services segment, whose gross margin reached 69.7% versus 35.3% in the product segment. The share of the segment has been growing steadily since 2016, however, in 2021, the share decreased to 21.3% from 21.8% a year earlier. At the end of the first quarter of 2022, the share of the segment decreased to 15.7% from 24% a year earlier. A further decline in the share of the services segment may lead to a contraction of the company’s gross margin.
Current macroeconomic factors may also put pressure on Apple’s profitability. This is a common challenge for companies producing complex global products. However, while other stocks have priced in macro risks, Apple is trading marginally below its all-time highs.
AAPL Stock Valuation
Our DCF model is based on several assumptions. We expect revenue to grow in line with the Wall Street consensus. Over the past eight years, gross margin has grown by an average of 0.52 percentage points per year, we expect this trend to continue. A similar methodology is used to forecast operating costs and hence operating margins. We expect D&A and capital expenditure as a percentage of revenue over the next seven years to be in line with the past five years’ average. In addition, we expect Apple to repurchase shares at the same volume as the average for the last nine years, which makes our model fairly optimistic. The terminal growth rate is 5%. The assumptions are presented below:
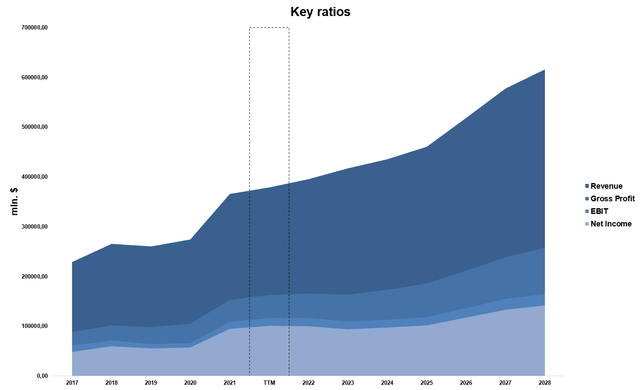
Based on the assumptions, the expected dynamics of key financial indicators are presented below:
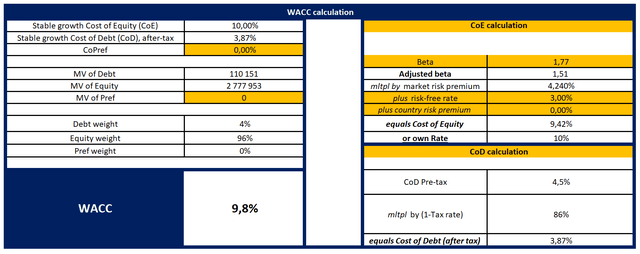
With the cost of equity equal to 10%, the Weighted Average Cost of Capital (WACC) is 9.8% as Apple has low financial leverage.
With a Terminal EV/EBITDA of 16.4x, the model projects a fair market value of $2,168 billion, or $185 per share. Thus, the current price does not provide enough margin of safety for buying.
You can see the model here.
Apple also looks expensive on multiples. Despite the expected tightening of monetary policy and the slowdown in revenue growth, the company is trading well above the average historical multiples.
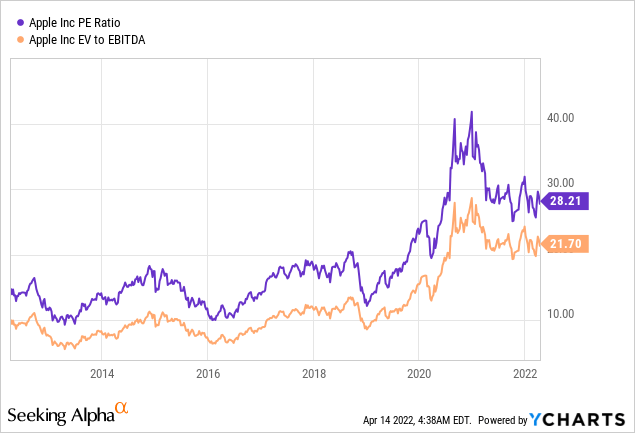
In terms of forward multiples, the company also looks quite expensive.
Conclusion
Over the years, Apple has demonstrated high growth rates and impressive profitability. The company could face headwinds in the form of slower revenue growth and lower profitability. However, Apple is still trading marginally below all-time highs. According to our assessment, the current price does not provide enough margin of safety for buying. We are neutral on AAPL.




Be the first to comment