

BeeBright/iStock via Getty Images
The investment thesis
I published an analysis on Apple (NASDAQ:AAPL) and Berkshire Hathaway (BRK.A) (BRK.B) on Dec 16, 2021, entitled “How To Own Apple At 12x PE Through Berkshire Hathaway”. The thesis of that article was that because of the discrepancies between accounting earnings and economic earnings, you can own Apple shares at a heavily discounted valuation through Berkshire Hathaway shares. Since that publication, as you can see from the following chart, indeed, both BRK and AAPL share prices went up while the overall market lost about 3.5%.
Seeking Alpha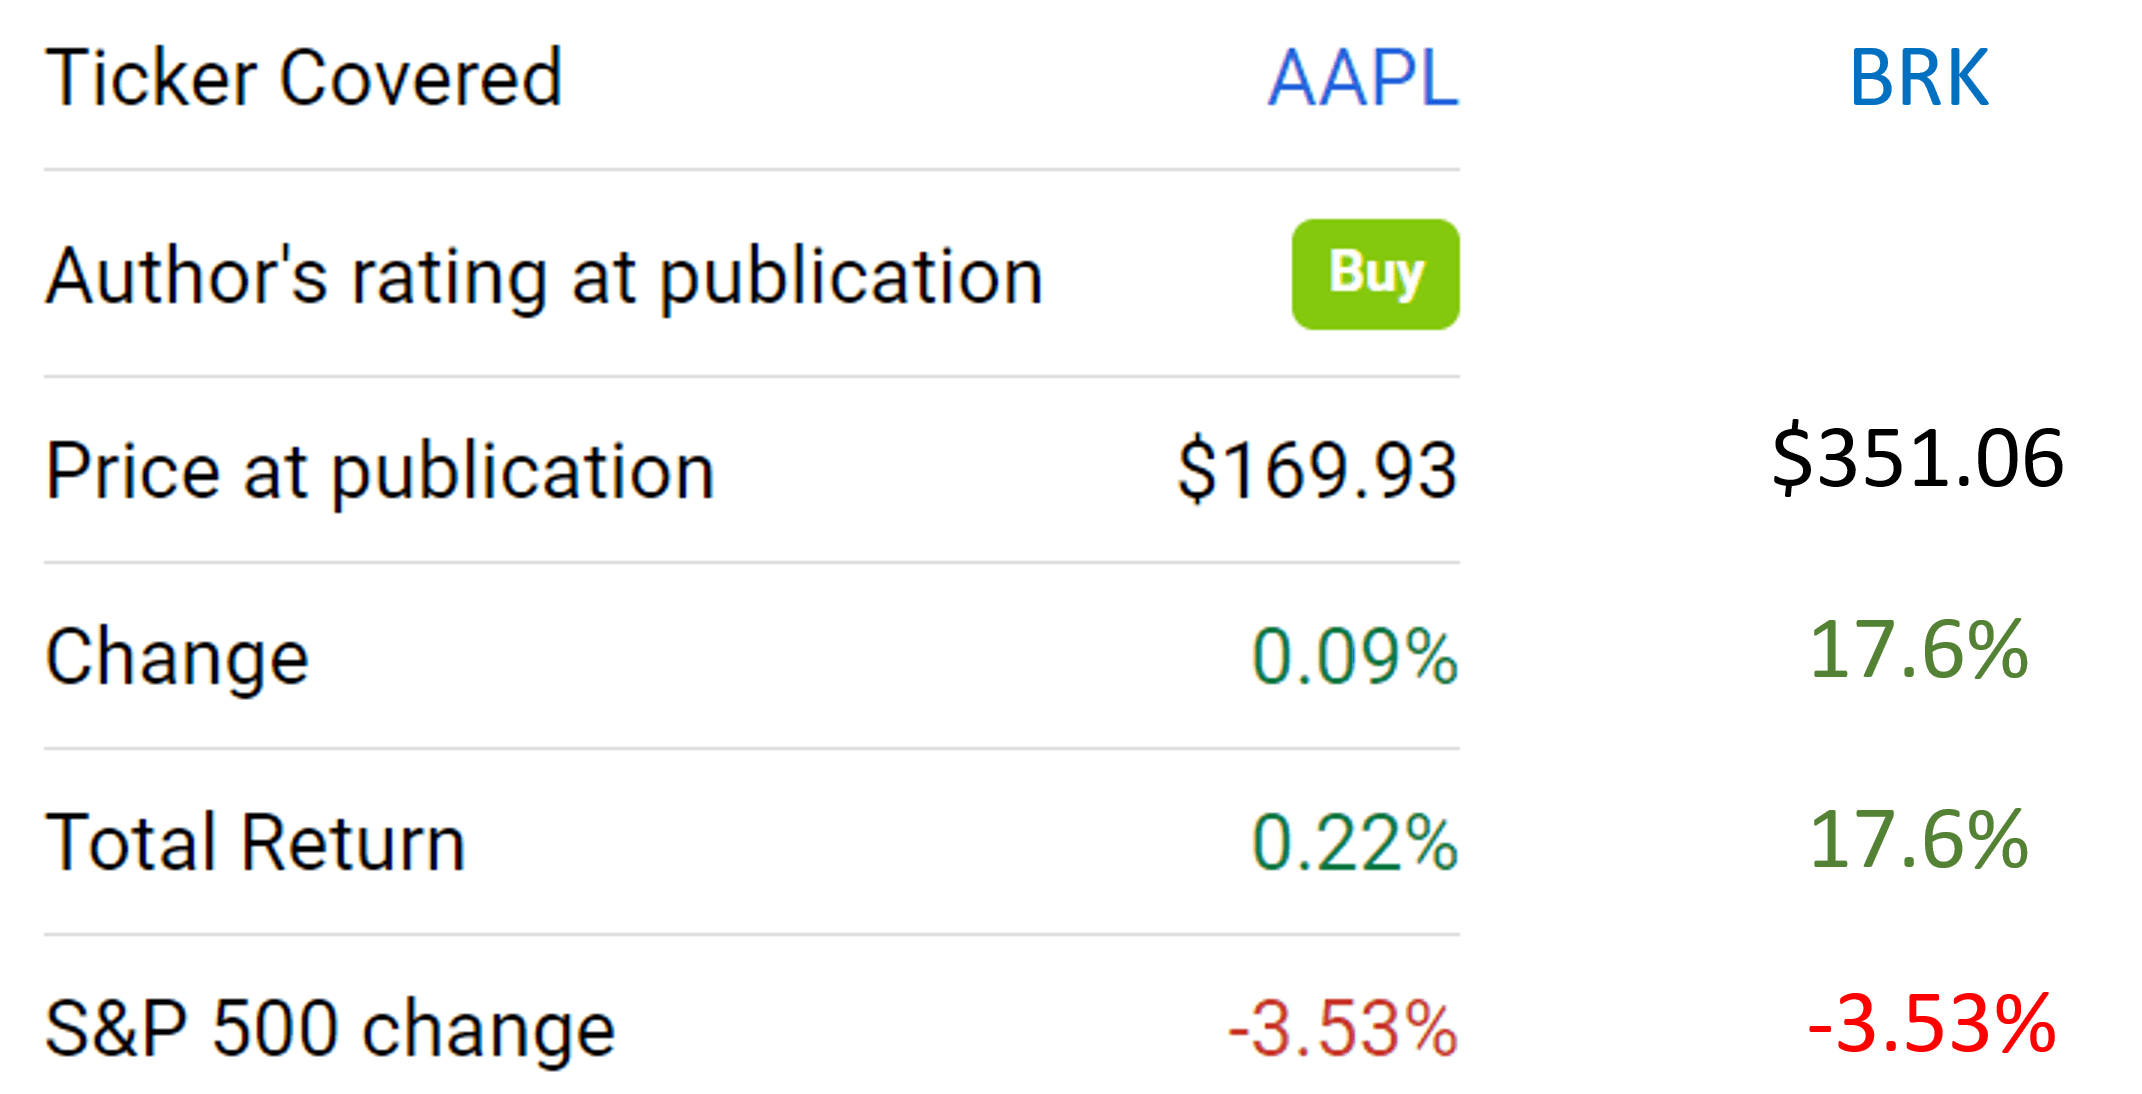
This article is an update to that previous coverage. The main updates are twofold:
- First, I will update the analysis with the new financial information available on both stocks. The new financial information, together with the changes in stock prices (especially the 17%+ price in BRK stock prices), merits an updated assessment.
- Secondly, I will discuss the implications of the share repurchases made by both companies since then. In particular, BRK bought back $6.9B of its shares in Q4 2021, and a total of $27B of its own shares in 2021. Such share repurchases are sizable enough to impact the ownership cost of AAPL shares and merit an updated assessment too.
You will see that the original thesis largely remains intact after these updates. Although, it has become a bit less attractive than my December coverage because of the valuation appreciation in BRK shares.
Before we dive in, let me also make two quick clarifications:
- All the subsequent analyses are made using numbers (price, earnings, book value, et al) based on per Berkshire Hathaway B shares (BRK.B), not Berkshire Hathaway A shares (BRK.A). There are certainly differences between the A and B shares in terms of voting power et al. But the focus of this article is on the economics side of the business. Given the fixed price ratio between these two classes (currently 1500:1), the analysis should apply equally well to the A shares too.
- All the financial data used in the rest of this article are either taken from the most recent Value Line reports, their most recent 10-K filing, or from Seeking Alpha. Given BRK’s sizable equity portfolio, the fact that the value of its equity portfolio fluctuates together with the overall market will inevitably create some uncertainties in the analysis, as to be mentioned again in the risk section.
Apple’s accounting EPS and owners’ earnings
The concept of owner earnings, to my best knowledge, is first detailed by Warren Buffett in Berkshire Hathaway’s annual report in 1986. Buffett defined owner earnings as follows (and the emphasis is added by me):
These represent (“a”) reported earnings plus (“b”) depreciation, depletion, amortization, and certain other non-cash charges…less (“c”) the average annual amount of capitalized expenditures for plant and equipment, etc. that the business requires to fully maintain its long-term competitive position and its unit volume…Our owner-earnings equation does not yield the deceptively precise figures provided by GAAP, since (“c”) must be a guess – and one sometimes very difficult to make. Despite this problem, we consider the owner earnings figure, not the GAAP figure, to be the relevant item for valuation purposes…All of this points up the absurdity of the ‘cash flow’ numbers that are often set forth in Wall Street reports. These numbers routinely include (“a”) plus (“b”) – but do not subtract (“c”).
Dissecting the maintenance CAPEx and growth CAPEx is, therefore, crucial to understanding the true economic earnings. However, as mentioned by Buffett, the owner-earnings equation does not yield the deceptively precise figures provided by GAAP, since (“c”) must be a guess – and one sometimes very difficult to make.
Under this background, the following table shows my best guess of AAPL’s maintenance CAPEx, growth CAPEx, and owners’ earnings. This analysis is performed by Bruce Greenwald’s method. Readers interested in more details could take a look at my earlier article and are highly recommended to take a look at Greenwald’s book entitled Value Investing. As shown in my last writing, AAPL’s owners’ earnings were about $5.8 per share. And it was higher than both its free cash flow and its accounting EPS. The reason is that the part of the growth CAPEx should not be considered an expense to the business.
In this writing, I will use the FW 2022 financials in this analysis. And as you can see, the picture gets even better. The owners’ earnings from AAPL will rise to about $6.7 per share from the $5.8 in my previous analysis. As a result, the valuation of APPL has become more attractive. Its PE is about 27x on an accounting basis, and only about 25x in terms of the owners earning PE.
As you can see here, by interpreting the true economic earnings, AAPL’s valuation is not as high as it seems on the surface already. And we will see next that its valuation is further discounted when owned through BRK.
Source: Author based on Seeking Alpha data.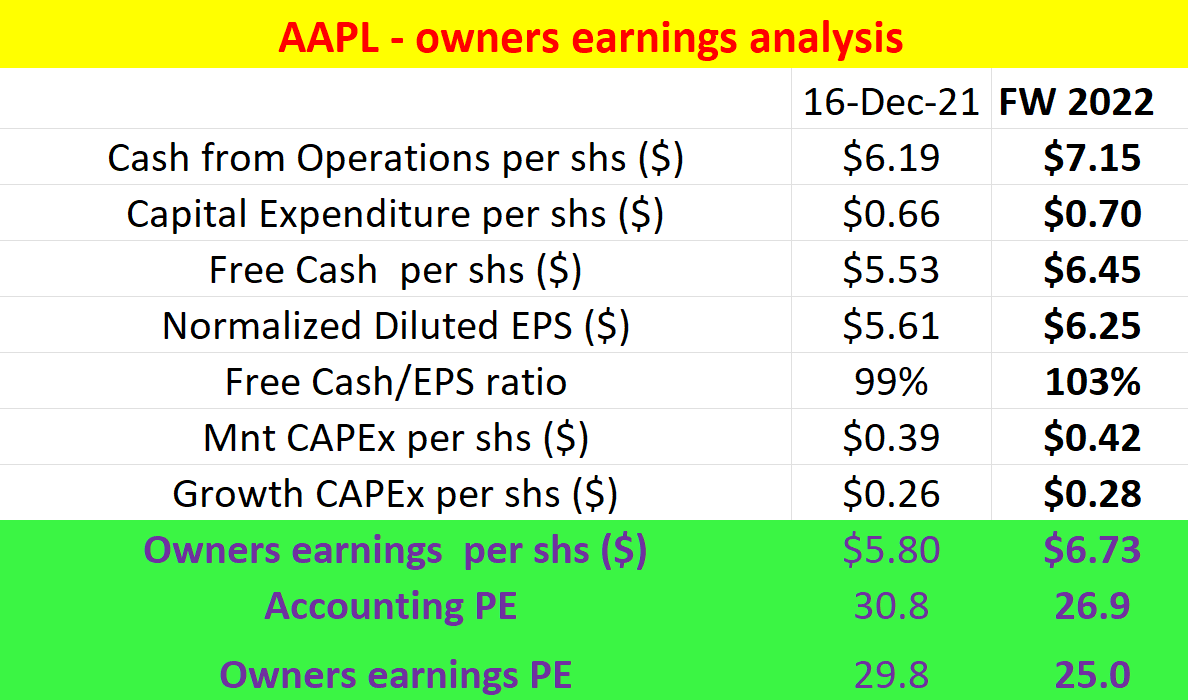
Berkshire financials and BRK ownership of AAPL shares
The following table shows a snapshot of the financials of BRK. As of my last writing, the business had a market capitalization of $649 billion (or $295 per share). Out of the $649B market cap, $293 billion is invested in an equity portfolio and $149 billion is in cash. And out of the $293B equity investment, AAPL was the largest investment, with more than 887 million shares and a total market value of about $125 billion. So if we take all the other equity investments except AAPL and the cash position out of the share price, BRK’s adjusted share price is $151.
As of this writing, BRK’s market capitalization has risen substantially to $777 billion due to the 17% price rally (or $351 per share), and its equity portfolio has rallied too. Now, out of the $777B market cap, $331 billion is invested in an equity portfolio and $147 billion is in cash. And out of the $331B equity investment, AAPL is still the largest investment. And again, if we take all the other equity investments except AAPL and the cash position out of the share price, BRK’s adjusted share price is $206.
So the end result here is that, if we pay today’s market price of $351 to buy 1 BRK share and immediately liquidate the cash and all other equity investments,
- we are essentially paying $206 for the AAPL shares AND all the BRK operating business segments;
- and each BRK share contains 0.40 AAPL shares (about 887 million AAPL shares out of about 2213 million BRK equivalent class B shares).
Source: Author based on Seeking Alpha data.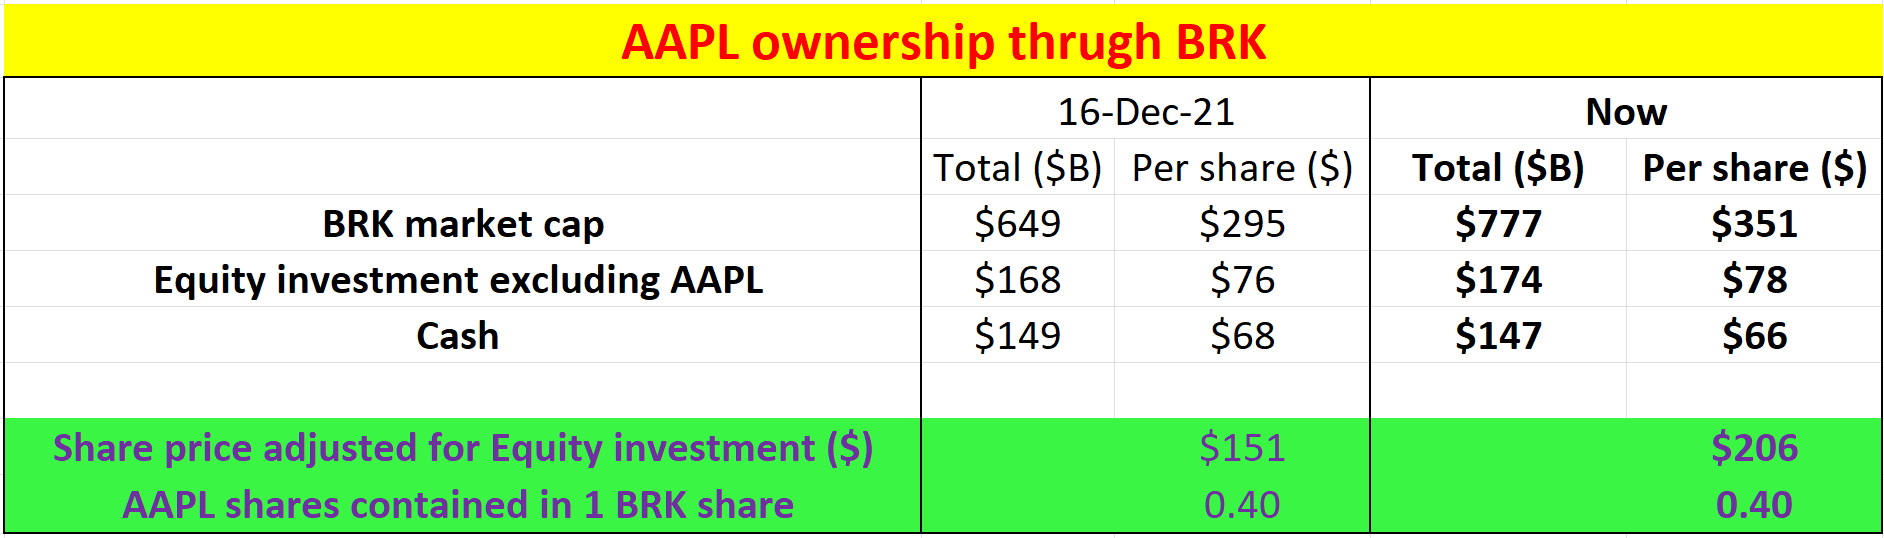
Berkshire Hathaway’s operation segments and Apple’s ownership PE
Now based on the above, let’s see the earning power that we are getting from the 0.40 AAPL share AND BRK’s operation segments in each BRK share. And the key missing piece here is the earning power from BRK’s operating segments.
Berkshire earned $21.9 billion of operating earnings in 2020 (the financials available at my last writing), or $10 per share. In contrast, in GAAP terms, Berkshire earned $42.5 billion in 2020, which includes 4 main components a) the $21.9 billion operating earnings already mentioned, b) a $4.9 billion of realized capital gains, c) a $26.7 billion gain from an increase in the amount of net unrealized capital gains that exist in the stocks, and d) an $11 billion loss from a write-down.
Since my last writing, new financial information has been released. However, they did not help too much to estimate BRK’s true earning power due to the accounting discrepancies. As you can see from the 2020 financials, out of the four major components, operating earnings were not even the largest item based on the GAAP standard. Such discrepancies between accounting and economic earnings really illustrate the deceptive nature of the commonly quoted GAAP earnings (and also the PE based on such earnings). On the one hand, they create large fluctuations in the reported financials. For example, BRK Q4 reported operating earnings rose 45% from the previous year. But on the other hand, when interpreted correctly or roughly correctly (to paraphrase Buffett, it’s always better to be approximately correct than precisely wrong), such discrepancies could create an opportunity for us.
So here is my attempt to be approximately correct in this analysis:
- Out of the four major accounting items reported in 2020, I will only ignore the other 3 and only keep the $21.9B earning from its major operations (mostly coming from insurance, railroads, and energy).
- Then I will assume a 5% growth for 2022, a bit lower than the consensus estimates of its top and bottom-line growth rates to be on the conservative side. This assumption will lead to about $10.4 per share of organic earning power from BRK’s operating segments in 2022.
Now as established before, if we pay today’s market price of $351 to buy 1 BRK share and immediately liquidate the cash and all other equity investments, we are essentially paying $206 to buy 0.40 AAPL shares and all the BRK operating business segments. Also as established before, 0.4 AAPL shares would provide an economic earning of $2.69 (=$6.73×0.4). So in the end, we are paying $206 to buy $2.69 of economic earnings from AAPL PLUS $10.4 of economic earnings from BRK’s operating businesses.
How you do the rest of the valuation is a matter of personal judgment now. If you take the aggregated average as I did in the following table, your average “ownership” PE of AAPL and BRK’s operation business is on average 15.7x – a bit higher than the 12.3x back in Dec 2021, but still significantly lower than the 27x PE based on accounting earnings.
If you value BRK’s operating earnings at 15x operating income – which is very reasonable in my view given the quality of the businesses, then these operating businesses would be worth $156 per share by themselves alone. And you would be paying $50 ($206-$156) for the 0.4 AAPL share with $2.69 of economic earnings behind it – i.e., at an ownership PE of about 18x, still far below the 27x accounting PE.
Source: Author based on Seeking Alpha data.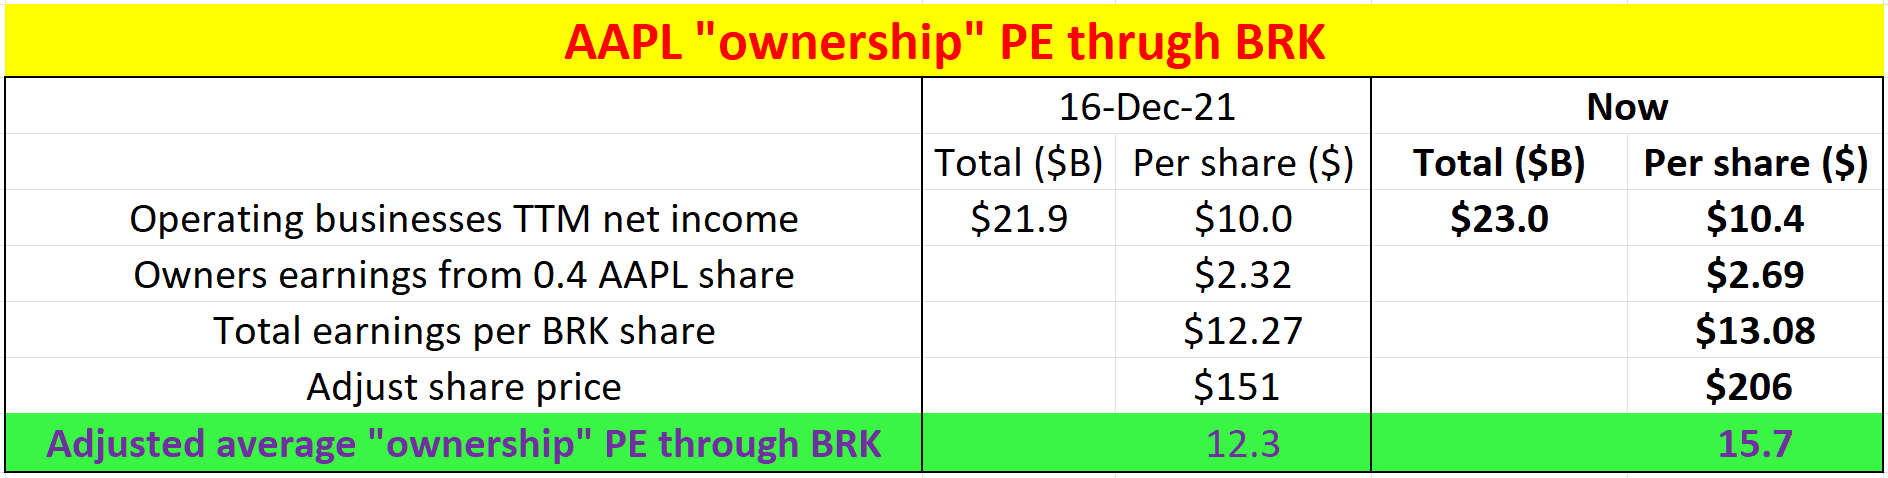
Risks
Here I will not focus on the risks unique to AAPL or BRK. Readers interested in these could refer to my earlier articles on BRK or AAPL. Here instead I will focus on the risks associated with the particular approach described in this article.
- Time frame. If you own AAPL shares directly, you could choose to own them as long or as short as you want. But if you won AAPL through BRK, you will be committing to long-term most likely. Buffett has mentioned multiple that he does not view his AAPL position as stockholding. He views it as BRK’s 4th largest business. And he openly emphasized that AAPL is a long-term investment. As an example, he was asked about his AAPL position during an interview (you can see the full interview here, full of typical Buffett-style wisdom and a sense of humor), and he emphasized repeatedly how AAPL is a long-term investment and how holding AAPL is like holding a high-yield farm for the long term.
- BRK’s cash position and its insurance float. This analysis also assumed that all the cash positions are truly cash. However, in reality, this is not entirely true because part of the cash is insurance float. But there are also good reasons to take the cash position out of the stock price (or some part of it). Cash is cash nonetheless – that is, if someone buys BRK completely, every $1 in the float counts as $1. And there is a very low chance – though probably no one, including Buffett himself knows how low the chance is – that all the float will be needed. Buffett mentioned that he will at least maintain a cash position of about $30B. So I am guessing we could use $30B as a minimum for estimating the float. Taking $30B out of the cash will make the valuations a bit higher than what’s presented above, but not by too much.
- Uncertainties in BRK’s equity portfolio. Finally, as aforementioned, the value of BRK’s sizable equity portfolio fluctuates together with the overall market. As a result, the market value of its equity portfolio must have already changed from its last financial release. However, estimating how much the change actually is difficult (and probably and fortunately unnecessary in this case given the relatively small change in the overall market since its last release). But such fluctuations do inevitably create some uncertainties in the analysis.
Conclusion and final thought
It is no secret that discrepancies exist between accounting and economic earnings. It is just in the particular case of AAPL and BRK, the discrepancies are large enough and are in the direction that favors long-term investors. In particular,
- First, the commonly quoted PE is based on AAPL’s accounting earnings, which are an underestimate of its true economic earnings. AAPL’s true owners’ earnings are higher than both its free cash flow and its accounting EPS. AAPL’s owners’ earnings PE is about 25x, lower than its accounting FW PE of 27x.
- Second, BRK’s accounting earnings are a more dramatic underestimate of its true economic earnings. The end result is such that, if we pay today’s market price to buy 1 BRK share, our average “ownership” PE of AAPL and BRK’s operation business would be on average only 15.7x.
- It is higher than the 12.3x “ownership PE” in my earlier analysis published in Dec 2021, but still a far cry from the 27+ PE for APPL (or 26x PE for BRK) based on their accounting earnings.
Be the first to comment