

ozgurdonmaz/iStock Unreleased via Getty Images
Investment Thesis
- According to my HQC Scorecard, Apple (NASDAQ:AAPL) is rated as very attractive in the categories of Economic Moat (100 out of 100 points), Profitability (100 out of 100 points), Innovation (100 out of 100 points) and Expected Return (100 out of 100).
- In the categories of Valuation (76 out of 100 points), Financial Strength (68 out of 100 points) and Growth (60 out of 100 points), the company is rated as attractive according to the HQC Scorecard.
- I rate Apple as a buy. The company has strong competitive advantages, which make it an appealing investment for long-term investors. Furthermore, Apple is currently undervalued according to my DCF Model.
Apple’s Competitive Advantages
Apple’s strong brand image in combination with its established ecosystem as well as the brand loyalty of its customers, gives the company strong competitive advantages over its competitors. Further competitive advantages result from the company’s successful acquisition and integration of smaller technology companies in the last few decades as well as its high spending in Research & Development.
In various rankings, Apple is listed as the most valuable brand in the world. This is also the case with the Brand Finance ranking of 2022, where Apple is listed with a brand value of $355,085 million, ahead of Amazon (AMZN) (with a brand value of $350,273 million) and Google (GOOG) (GOOGL) ($263,425 million). According to this ranking, Apple’s brand value increased by almost 35% in 2022 compared to 2021. According to Forbes, Apple is also listed as the most valuable brand in the world. Here, Apple is ahead of Google, Microsoft (MSFT) and Amazon.
In 2021, Apple spent $21,914 million in Research & Development (R&D). This was 6% of its total net sales. Apple’s spending in R&D in 2021 increased by 17% in comparison to the previous year. Apple’s high R&D spending is crucial to allow the company to develop new products, services and technologies and to ensure future growth.
In the past, Apple has also continuously succeeded in acquiring smaller companies from the technology sector and integrated them successfully into their business. To give an example, since 2013, Apple has acquired 12 different companies from the sector of augmented and virtual reality technologies and integrated them into their business.
Furthermore, Apple has succeeded in building a complete ecosystem. This means the system-wide integration of Apple products, which ensures an even better user experience if you own several Apple products. An example of this would be to unlock your Mac with your Apple Watch or to receive messages on all of your Apple devices.
These competitive advantages contribute to my buy rating on Apple stock.
Apple’s Valuation
Discounted Cash Flow (DCF)-Model
In terms of valuation, I have used the DCF Model to determine the intrinsic value of Apple. The method calculates a fair value of $165 for the company. At the current stock price, this results in an upside of 23.8%.
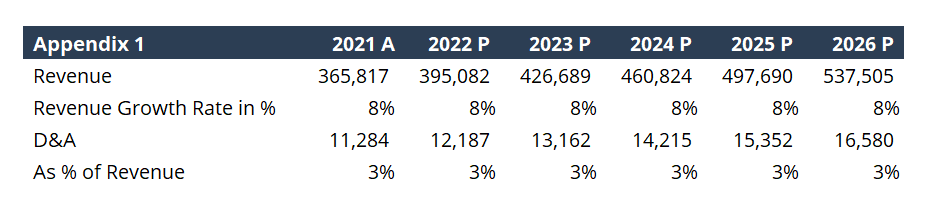
According to Seeking Alpha, Apple’s Average Revenue and EBIT Growth Rate of the last 5 years is approximately 8%. Therefore, I assume a Revenue Growth Rate and EBIT Growth Rate of 8% for Apple over the next 5 years. The GDP Growth Rate of the United States is about 3% per year on average. Due to Apple’s strong competitive advantages, I expect the company to grow with a slightly higher growth rate. Therefore, I assume a Perpetual Growth Rate of 4%.
I have used Apple’s current discount rate (WACC) of 8.5%. Furthermore, I calculated with an EV/EBITDA Multiple of 17.8x, which is the company’s latest twelve months EV/EBITDA.
My calculations are based on the following assumptions as presented below (in $ millions except per share items):
|
Company Ticker |
AAPL |
|
Revenue Growth Rate for the next 5 years |
8% |
|
EBIT Growth Rate for the next 5 Years |
8% |
|
Tax Rate |
13.3% |
|
Discount Rate (WACC) |
8.5% |
|
Perpetual Growth Rate |
4% |
|
EV/EBITDA Multiple |
17.8x |
|
Transaction Date |
13.06.2022 |
|
Fiscal Year End |
30.09.2022 |
|
Current Price / Share |
$133.35 |
|
Shares Outstanding |
16,185 |
|
Debt |
$119,981 |
|
Cash |
$28,098 |
|
Capex |
$10,633 |
Source: The Author
Based on the above assumptions, I calculated the following results (in $ millions except per share items):
Source: The Author Source: The Author Source: The Author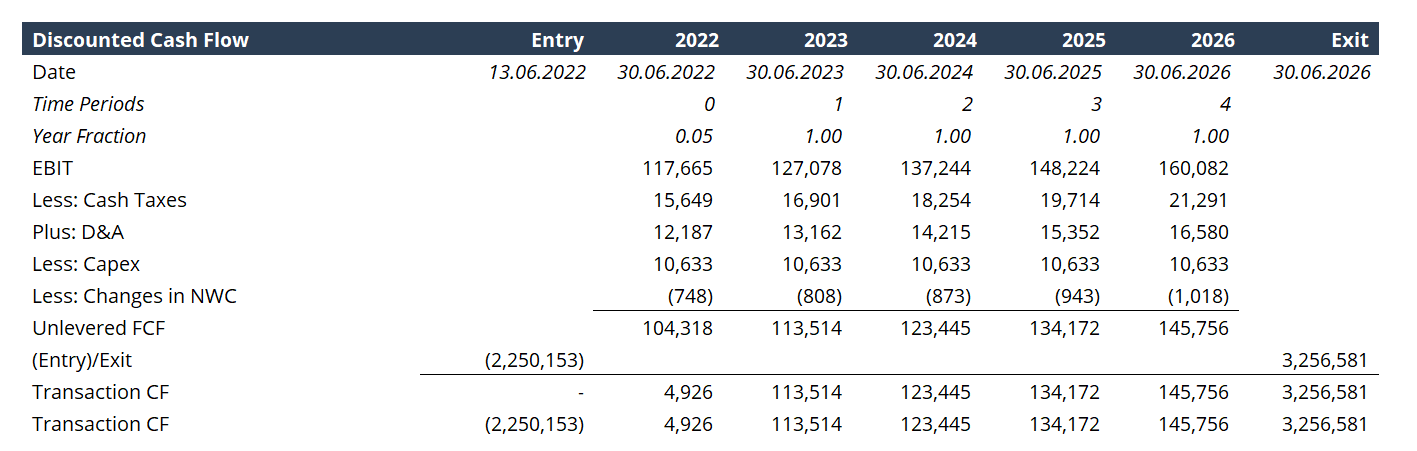

Terminal Value
|
Perpetual Growth |
$3,368,584 |
|
EV/EBITDA |
$3,144,579 |
|
Average |
$3,256,581 |
Source: The Author
Market Value
|
Market Cap |
$2,158,270 |
|
Plus: Debt |
$119,981 |
|
Less: Cash |
$28,098 |
|
= Enterprise Value |
$2,250,153 |
|
Equity Value/Share |
$133.35 |
Source: The Author
Intrinsic Value
|
Enterprise Value |
$2,763,376 |
|
Plus: Cash |
$28,098 |
|
Less: Debt |
$119,981 |
|
= Equity Value |
$2,671,493 |
|
Equity Value/Share |
$165.00 |
Source: The Author
Market Value vs. Intrinsic Value
|
Market Value |
$133.35 |
|
Upside |
23.8% |
|
Intrinsic Value |
$165.00 |
Source: The Author
Relative Valuation Models
Apple’s P/E (FWD) Ratio
Apple’s P/E Ratio is currently 22.31. This is 1.08% above its average P/E Ratio from the last five years, which is 22.08. This P/E Ratio is currently 2.21% higher than the sector median (21.83).
Apple’s Dividend
The average growth rate over the last five years of Apple’s dividend has been 8.75%. I assume an average future growth rate for Apple’s dividend of about 8% per year. Due to Apple’s low dividend Payout Ratio of only 14.29%, which still offers significant scope for dividend enhancements in the future, as well as the company’s strong competitive advantages, I assume that Apple will be able to raise its dividend by approximately 8% per year. If you were to assume that Apple was able to increase dividends by an average of 8% per year over the next 30 years and you would buy the Apple stock at the current price of $133.35 per share, you would get the following results for the company’s dividend shown in the graphic below.
Source: The Author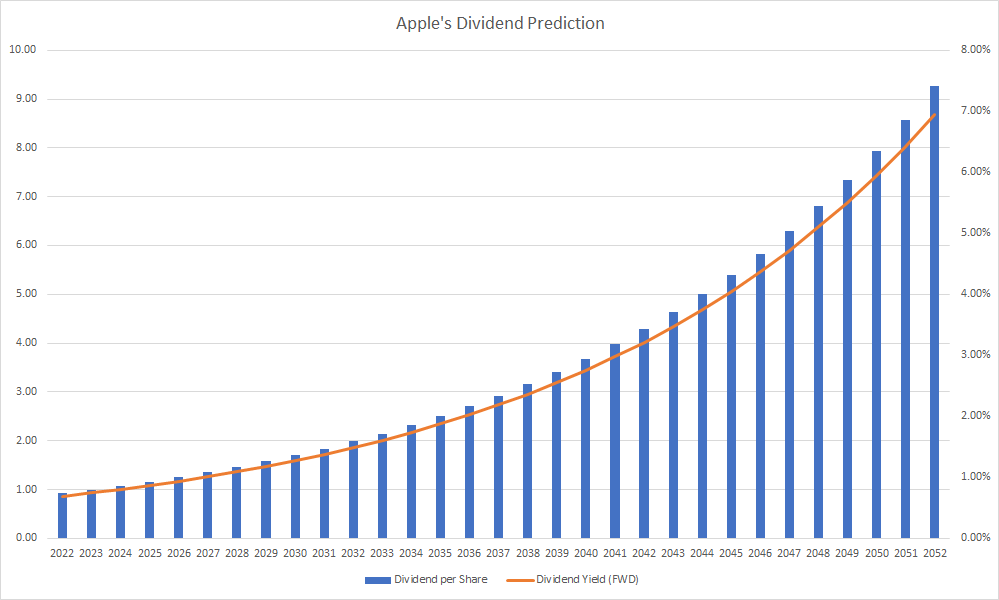
If Apple was able to raise its dividend by 8% per year over the next 30 years, you would get back 85.10% of your investment from receiving dividend payments (no tax on dividend has been included in this calculation) after 30 years:
|
Year |
Dividend per Share |
Dividend Yield (FWD) |
Accumulated Dividend |
|
2022 |
0.92 |
0.69% |
0.69% |
|
2032 |
1.99 |
1.49% |
11.48% |
|
2042 |
4.29 |
3.22% |
34.79% |
|
2052 |
9.26 |
6.94% |
85.10% |
Source: The Author
When taking into account Apple’s free cash flow per share of $5.57 in 2021 as well as its current price per share of $133.35, it demonstrates that the company generates a free cash flow yield of around 4.17%. This puts Apple in a position where the company could theoretically be able to pay a dividend of 4.17%. However, instead of paying a higher dividend, Apple uses part of its free cash flow for its repurchase program. In the fiscal year 2021, Apple spent $85.5 billion to repurchase its shares. As a result, investors also benefit from Apple’s relatively high free cash flow yield, which enables Apple to buy back its own shares.
The High-Quality Company (HQC) Scorecard for Long-Term Investors
How the HQC Scorecard works
The aim of the HQC Scorecard for Long-Term Investors, that I have developed, is to help investors to identify companies which are attractive long-term investments (investment with a horizon of at least seven years) in terms of risk and expected compound annual rate of return.
In the graphic below you can find the overview of the classification for the HQC Scorecard for Long-Term Investors.
Classification of the High-Quality Company Scorecard for Long-Term Investors
Source: The Author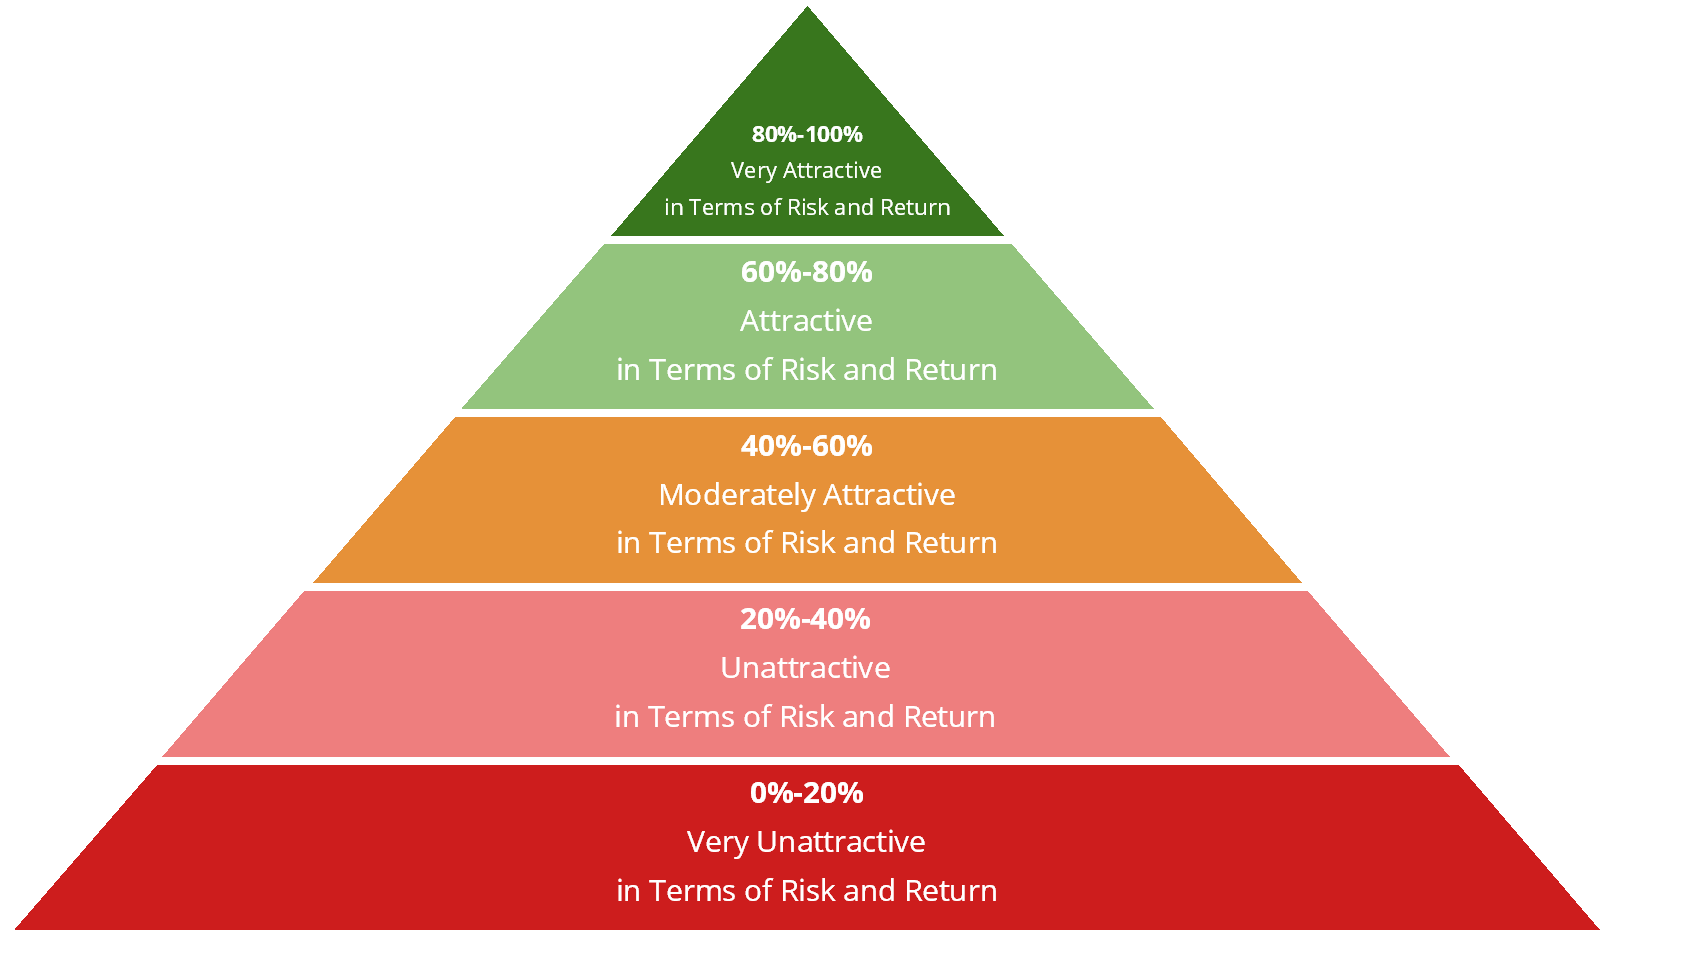
The HQC Scorecard rates companies up to a maximum of 100 points. A scoring between 80% and 100% demonstrates that – according to the High-Quality Company Scorecard – the company is a very attractive long-term investment in terms of risk and expected compound annual rate of return. Companies with a very attractive rating tend to be more resistant, even in times of crisis, and are therefore very attractive as long-term investments. These types of companies are usually particularly suitable to be overweighted in your investment portfolio. A scoring between 60% and 80% expresses that the company is still attractive in terms of risk and expected compound annual rate of return. Therefore, these companies are still appealing as long-term investments.
A scoring between 40% and 60% means that the company is moderately attractive. This doesn’t mean that they should not be considered as an investment, but in terms of risk and expected return they are a less attractive proposition. This could be due to the fact that the company’s economic moat is not that high or the financial strength is lower. However, these companies can still offer high growth opportunities; but they should be reviewed regularly in your investment portfolio. Some of these companies can be more vulnerable in times of economic crisis and some can have lower growth prospects.
A score between 20% and 40% expresses that the company is an unattractive long-term investment in terms of risk and return. And finally, a scoring between 0% and 20% indicates that the company is very unattractive according to the Scorecard. An investment in these companies is usually associated with significantly higher risks. For example, they may not (yet) have an economic moat, have a low financial strength, and may not yet be profitable. Nevertheless, an investment in these companies could still make sense. For example, if the company offers very high growth opportunities. However, I would recommend only investing a limited proportion of your portfolio in these types of companies due to the significant high risk involved and the fact that they require a more frequent portfolio review.
Composition of the HQC Scorecard by Categories
Various categories with different weightings are included in the evaluation process: There are three categories which particularly contribute to the risk reduction of the investment (Economic Moat, Financial Strength and Profitability). These categories account for 62% of the overall rating.
Four categories contribute particularly to the expected compound annual rate of return of the investment: Valuation, Innovation, Growth and the Expected Return as according to my DCF Model. These categories account for 38% of the Scorecard.
The Economic Moat category accounts for 28% of the overall rating, the category of Financial Strength for 26% and the Profitability of the company for 8%. The Valuation of the company is weighted at 10%, the Innovation Factor at 6%, the Growth Factor at 10% and the Expected Return as according to my DCF Model makes up 12% of the overall rating.
Categories of the HQC Scorecard
Source: The Author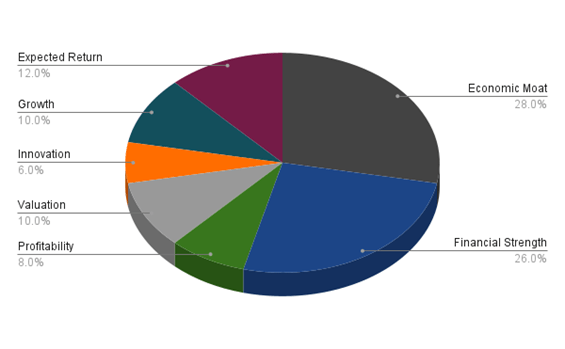
The categories which contribute to the reduction of risk (such as the Economic Moat and the Financial Strength of the company) have the highest weighting. This is due to the fact that if the company were to go bankrupt, the rating of the other factors would then be meaningless. For this reason, my scorecard places particular emphasis on the fact that companies with strong competitive advantages and high financial strength are rated as more attractive, due to these factors meaning they will be able to survive in the long-term.
Companies that have a very high expected compound annual rate of return, but do not have many risk reduction factors (for example, no Economic Moat, low Financial Strength and low Profitability), tend to receive a lower rating than companies with lower risks (which have a high Economic Moat, as well as high Financial Strength and Profitability) and only moderate expected annual returns according to the HQC Scorecard. This can be explained by the fact that the categories that contribute to risk reduction (such as Economic Moat and Financial Strength) are given a higher weighting (62% of the overall rating) than the factors which contribute to the expected annual rate of return (38% of the overall rating).
Approximately 56% of the categories on the HQC Scorecard are based on pure (financial) data, while about 44% of the factors are based on my personal evaluation process.
Overview of the Items of the HQC Scorecard for Long-Term Investors
In the graphic below you can find the individual items and weighting for each category of my HQC Scorecard. A score between 0 and 5 is given (with 0 being the lowest rating and 5 the highest) for each item on the Scorecard. In the graphic below you can see the conditions that must be met for each point of every item that is rated.
Source: The Author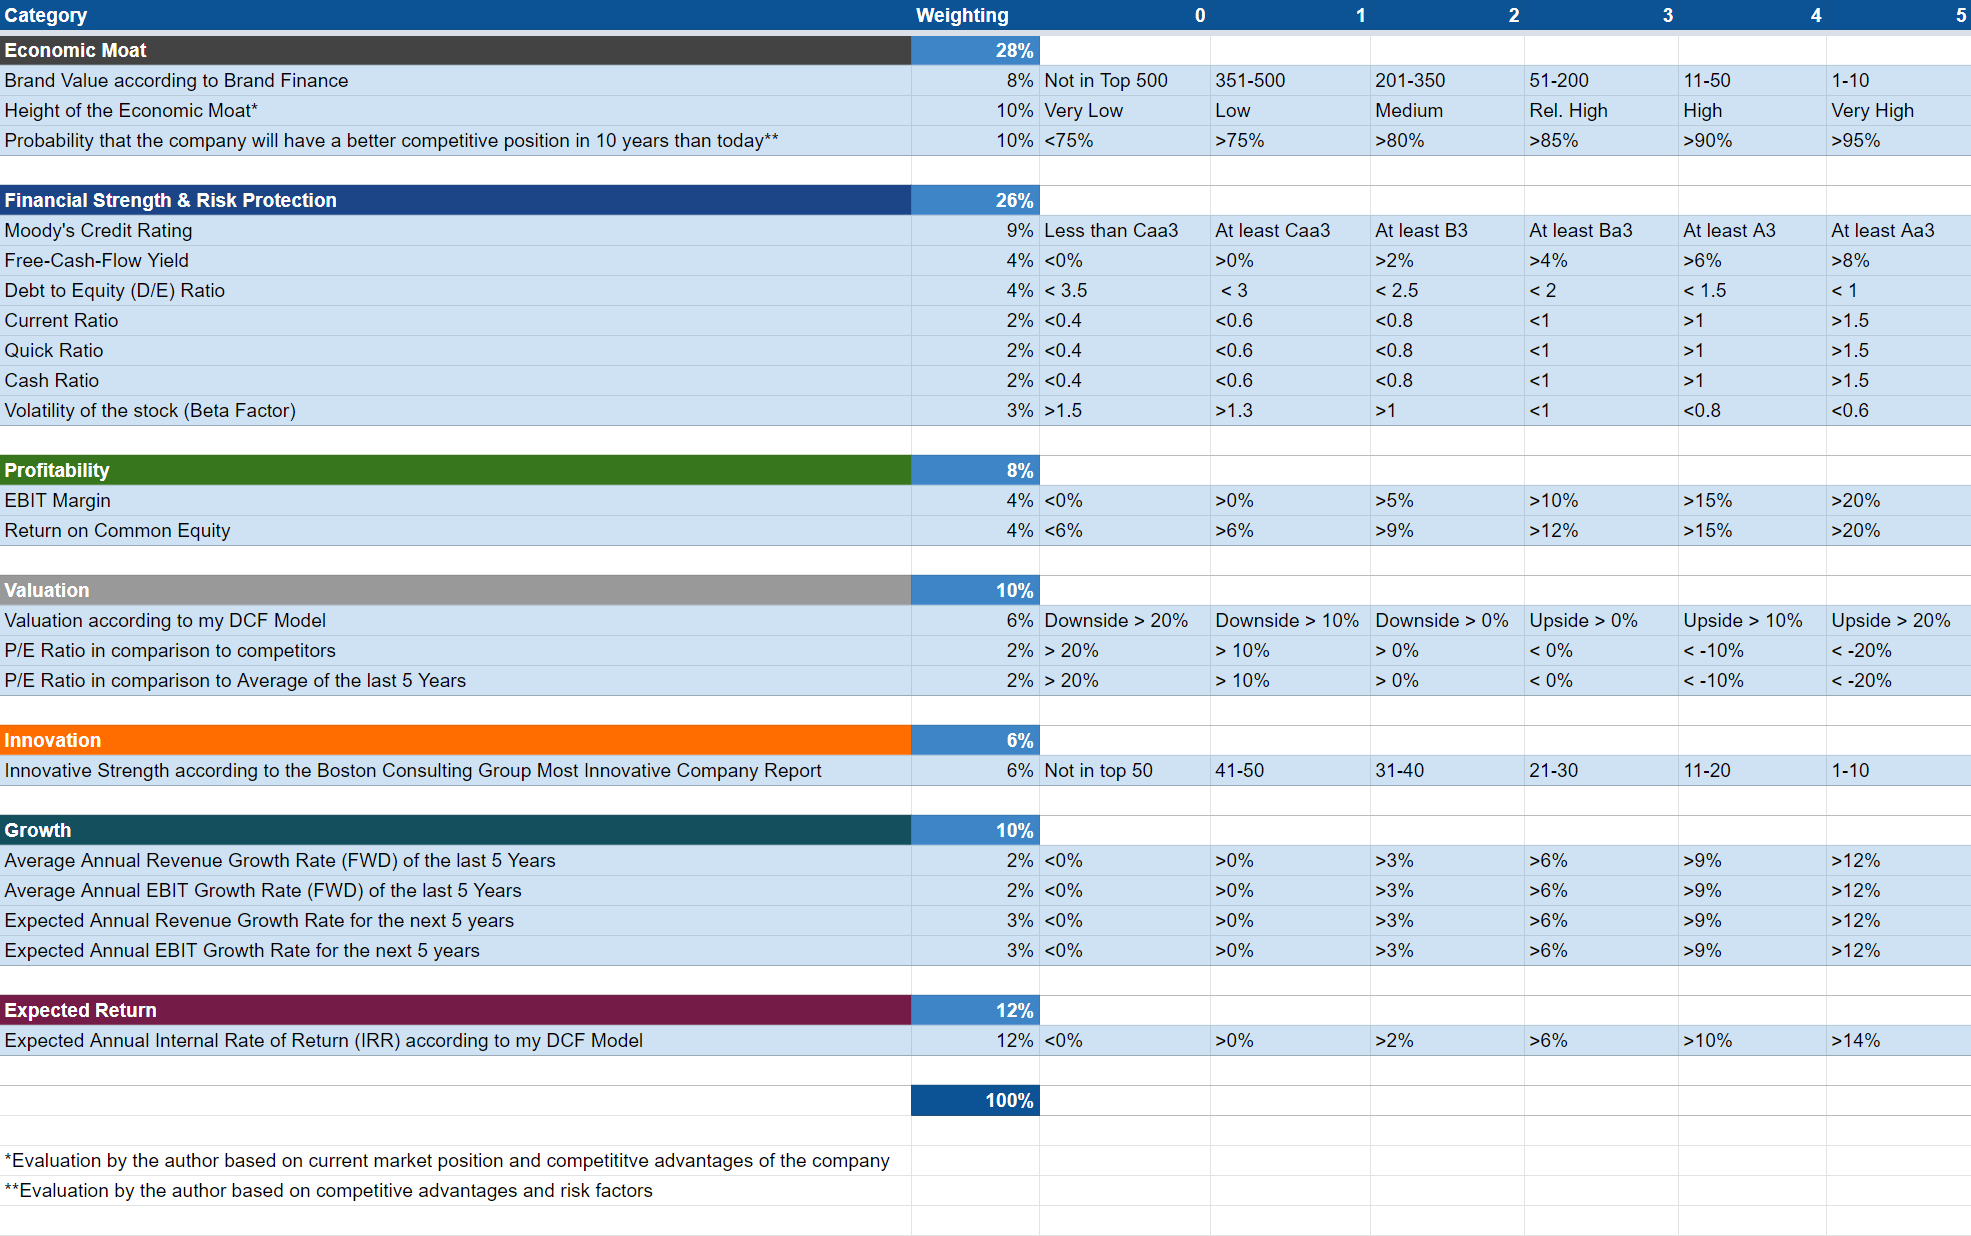
Apple According to the HQC Scorecard for Long-Term Investors
Source: The Author
According to the HQC Scorecard, the overall score of Apple is 85 out of 100 points. Therefore, Apple can currently be classified as a very attractive long-term investment in terms of risk and expected compound annual rate of return.
The HQC Scorecard indicates that Apple performs particularly well in the categories of Economic Moat (100 out of 100 points), Profitability (100 out of 100 points), Innovation (100 out of 100 points) and Expected Return (100 out of 100 points) (calculated as the Expected Annual Internal Rate of Return (IRR) with my DCF Model). Apple’s strong Profitability is also reflected in its high rating in Seeking Alpha’s Factor Grades of A+ for Profitability.
Furthermore, Apple performs well in the categories of Valuation (76 out of 100 points), Financial Strength (68 out of 100 points) and Growth (60 out of 100 points).
However, in terms of Valuation, Apple has a low rating of F according to the Seeking Alpha Factor Grades. In terms of Growth, Apple is rated with a D+ according to the Seeking Alpha Factor Grades. In the graphic below you can find the overview of the Seeking Alpha Factor Grades for Apple:
Apple According to the Seeking Alpha Factor Grades
Source: Seeking Alpha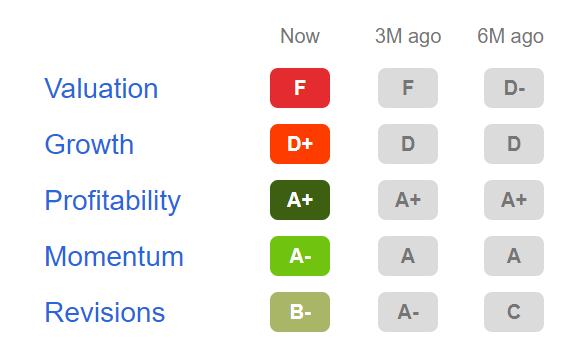
The HQC Scorecard demonstrates Apple’s high economic moat, the company’s high profitability as well as its high innovativeness and also indicates a high expected return (according to my DCF Model). This high scoring performance strengthens my belief that Apple stock is currently very appealing.
Limitations of the HQC Scorecard for Long-Term Investors
Like any other model, the HQC Scorecard for Long-Term Investors is subject to limitations. One of the main limitations is the fact that it’s based on simplifications. Various assumptions were made to create the model and changing them would cause the results of the Scorecard to be different.
Due to these limitations, I do not use the HQC Scorecard as a sole evaluation method for assessing a buy, hold or sell recommendation for a stock. Instead, I see the scorecard as an additional evaluation method and integrate it into the analysis process of the stock I am focusing on.
Risks
In my view, one of the biggest risk factors for Apple would be if an event permanently damaged the company’s brand image. This could mean that Apple’s customers no longer pay premium prices for its products and thus profit margins as well as the company’s growth rates could be affected negatively.
Another risk factor I see for Apple is if the company was unable to continuously launch new products, services and technologies, which contribute to its growth. Apple could also be unable to stimulate the customer demand for new Apple products, which could have effects on the company’s growth rate.
An additional risk factor for Apple is the fact that the company operates in a large variety of industries. To name just a few, it operates in the desktop, laptop and tablet computer market as well as in the smartphone industry. Apple’s presence in different segments makes the company compete with a large number of companies such as HP (HPQ), Samsung (OTC:SSNLF), Dell (DELL) and Lenovo (OTCPK:LNVGY) among many others.
At the same time, the company operates with Apple TV+ competing with companies such as Amazon, Netflix (NFLX) and Walt Disney (DIS) (among others) in the streaming service industry, which is another highly competitive business sector. Furthermore, the technological sector is changing rapidly. Proof of this is the fact that new companies enter into the business segment continuously.
Due to the fact that Apple operates in different business sectors, which are highly competitive, the company’s profit margins could decline. However, I expect Apple to stand out against its competitors over the long-term due to its strong competitive advantages.
The Bottom Line
My Discounted Cash Flow Model indicates that Apple is currently undervalued with an upside of 23.8%. The DCF Model calculates a fair value of $165 for the company.
According to the High-Quality Company (HQC) Scorecard for Long-Term Investors, which I have developed, Apple scored 85 out of 100 points. The HQC Scorecard demonstrates that Apple can currently be classified as very attractive in terms of risk and expected compound annual rate of return.
The HQC Scorecard expresses Apple’s wide economic moat, the company’s high profitability and also demonstrates both its high innovativeness and expected rate of return.
With an average dividend growth per year of 8.75% in the last 5 years and a dividend payout ratio of only 14.29%, the company has enormous scope for future dividend enhancements. I expect Apple to continue increasing its dividend with a dividend growth rate of approximately 8% annually in the years to come.
I rate Apple as a buy. From my point of view, Apple has strong competitive advantages, which help the company to stand out against its competitors in the long-term. These characteristics make the company attractive especially for long-term investors and buy-and-hold investors.
Thank you for reading and I would appreciate any feedback on this article!
Be the first to comment