

chestnutphoto/iStock via Getty Images
Thesis
If you are reading this, you must know two things already. First, both HP Inc. (NYSE:HPQ) and Apple Inc. (NASDAQ:AAPL) are in Warren Buffett’s Berkshire Hathaway (BRK.A, BRK.B) equity portfolio. Buffett not only holds both stocks, but he holds large positions in both as you can see from the chart below. To wit, Apple is, of course, his largest position in the equity portfolio, with a current market value exceeding $122 billion. And HPQ is the 11th largest position, with a current market value exceeding $3.4 billion.
Second, AAPL released its FY Q4 earnings report (“ER”) after market close on Thursday (and all the prices used in this article are taken from the after-market prices on Thursday). AAPL beat both topline and bottom-line expectations (again). But there are signs of slowing growth, and Apple’s stock prices fell by more than 3% in after-market trading to around $144. The company reported that is already cutting production of its new iPhone 14 Plus, and also its iPad revenue showed a decline to $7.17B (a 12% decline compared to $8.25B in 4Q21). HPQ is scheduled to report its Q3 earnings on 11/22/2022. But based on the ER results from heavyweights so far (like the FAAMG stocks), I expect it to report strong headwinds, too.
And this leads me to the thesis of this article. Given these headwinds, I expect the market volatility to heighten during Q4. Such market volatility can offer excellent entry opportunities for both AAPL and HPQ. In the remainder of this article, I will analyze the deeper and hidden similarities between these two stocks (beyond the obvious fact that they are both in the IT sector), with an intention to reverse engineer Buffett’s thought process. You will see that they actually share similar business cycles, they are both going through the contracting phase (yes, even Apple has contracting phases, too), and yet both are superbly profitable and scalable businesses.
Source: DataRoma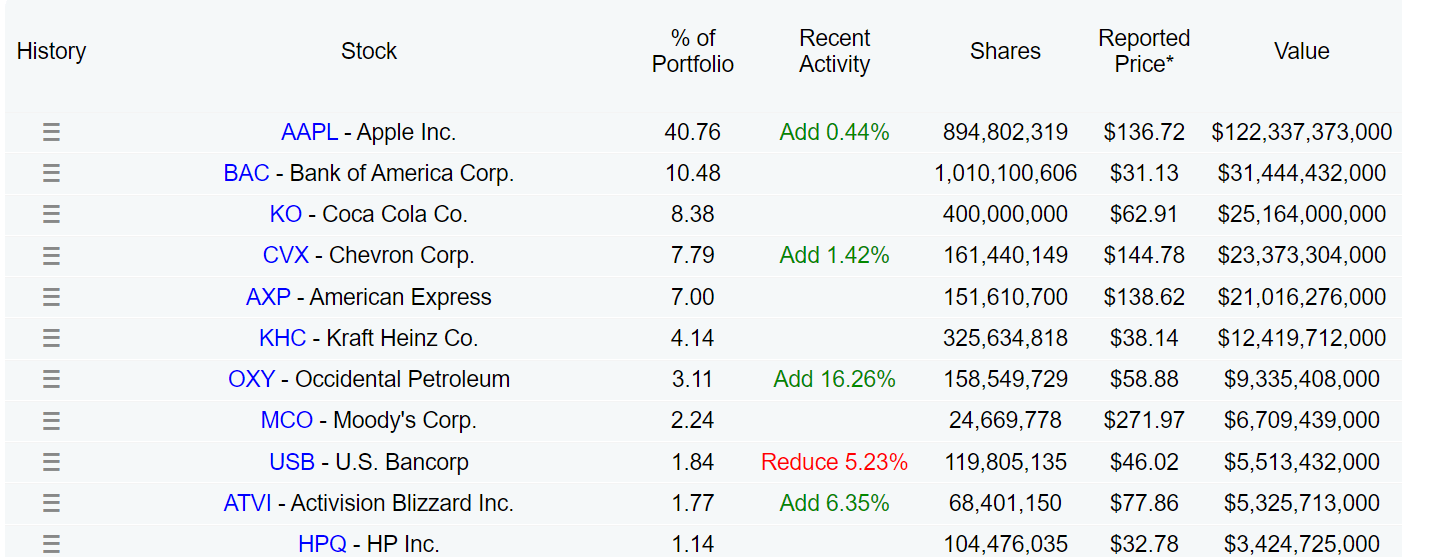
AAPL and HPQ: state of the cycle
As you can see from the top panel of the following chart, they even share the same approximate 4-year cycle duration. To wit, over the past decade, both HPQ and AAPL have gone through about two full cycles as marked by their YoY quarterly revenues. The last contracting phase bottomed around 2016, with both reporting negative YoY quarterly revenue growth, followed by another bottom in 2019~2020. So, the bottom-to-bottom duration is about 4 years. And the last expansion cycle peaked around 2018, followed by the next peak somewhere during 2021~2022, again with a peak-to-peak duration of about ~4 years.
And as you can see, currently they are both going through the contracting phase of the current cycle after growth peaked in mid-2021. HPQ has already reported a negative YoY growth rate of -4.09%. AAPL’s YoY growth rate rates are still positive, but it is only 1.87%, a far cry from the rates it enjoyed during the expansion phases.
Looking ahead, I foresee the contracting cycle to continue a bit longer for both HPQ and AAPL before it reaches a bottom. According to this SA news, worldwide PC shipments sank again in Q3 2022 by 15% on uneven supply and slowing demand. And as aforementioned, AAPL has just reported a decline in iPad sales and scaled back its iPhone 14 production. If history is of any guidance and human nature does not change, I anticipate this current contracting phase to last about 3 to 4 years, too, which would mean the contracting phase would bottom and hence end sometime in 2023.
Source: Author based on Seeking Alpha data.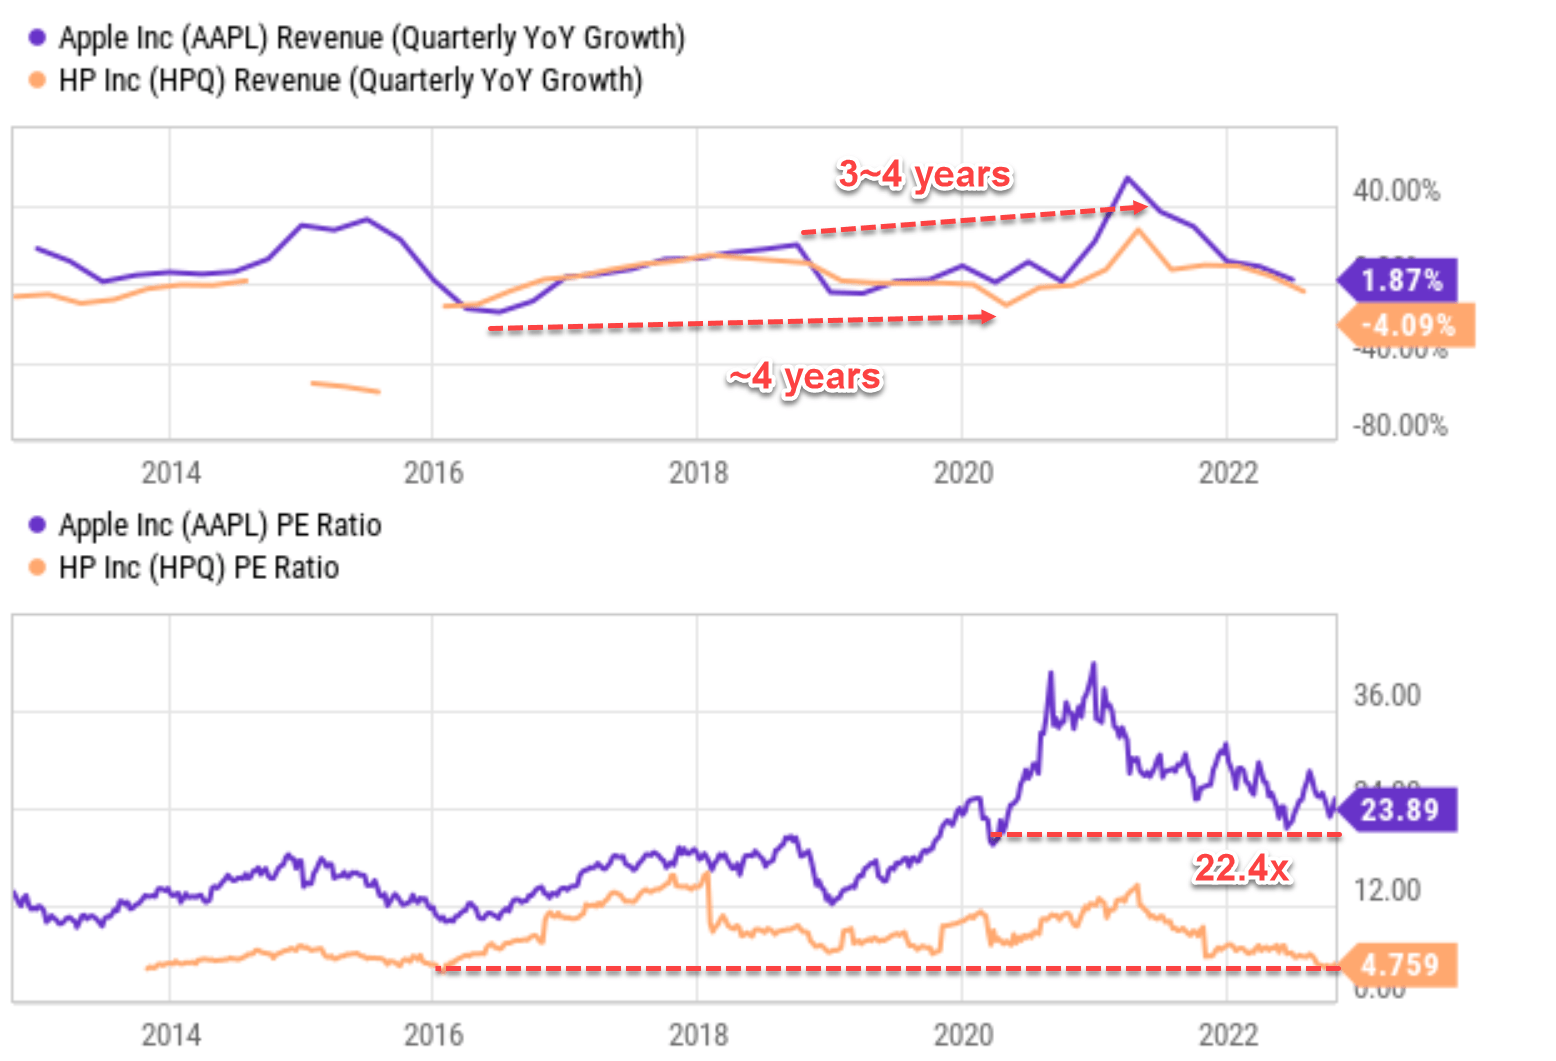
At the same time, the market is always forward-looking and anticipating the next move (like what we are doing here). As a result, their current valuations have already priced in the further contraction ahead, as you can see from the bottom panel of the chart. To wit, HPQ is currently trading at 4.75x P/E and AAPL 22.4x P/E, both representing a multi-year bottom valuation. Note again, these valuations were obtained using prices after the market close on Thursday. Given the volatility these days, these numbers may have changed by the time you read this article.
Next, we will explore other deeper and hidden similarities between HPQ and AAPL. You will see these hidden similarities make them unique investment opportunities.
HPQ and AAPL: Superb ROCE
ROCE stands for the return on capital employed, and I have analyzed the ROCE of both HPQ and AAPL in my earlier articles. The method for analyzing ROCE is detailed in this article, and as noted:
The calculation of their ROCE considers the following items as capital actually employed in their business operation: working capital (including payables, receivables, inventory) and net PPE (property, plant, and equipment), and R&D expenses are also capitalized.
The next two charts directly quote the results. As seen, HPQ was able to maintain a ROCE well over 100% most of the time since 2015 (when its ROCE peaked at 182%). The ROCE has been on average 113.2% in the past 5 years since 2018. Its current ROCE is around 107%, a bit below the historical average but still an astronomical level once we put it under perspective in a little bit. The picture for AAPL is very similar but even stronger. AAPL, too, was able to maintain a remarkably high and stable ROCE over the long term. Its ROCE has been on average 150% over the past 5 years.
Now, let’s put things under perspective by comparing their levels of ROCE against other overachievers such as MSFT. As seen in the 2nd chart below, MSFT’s ROCE in recent years fluctuated in a narrow range between 60% to 70%, with an average of 67%. Such an average ROCE makes MSFT the stock with the second-highest ROCE in the FAAMG group. The FAAMG group has been maintaining an average ROCE of around 50% in recent years.
Under this context, you can see that HPQ and AAPL’s 100%+ average ROCE are truly superb.
Source: Author based on Seeking Alpha data.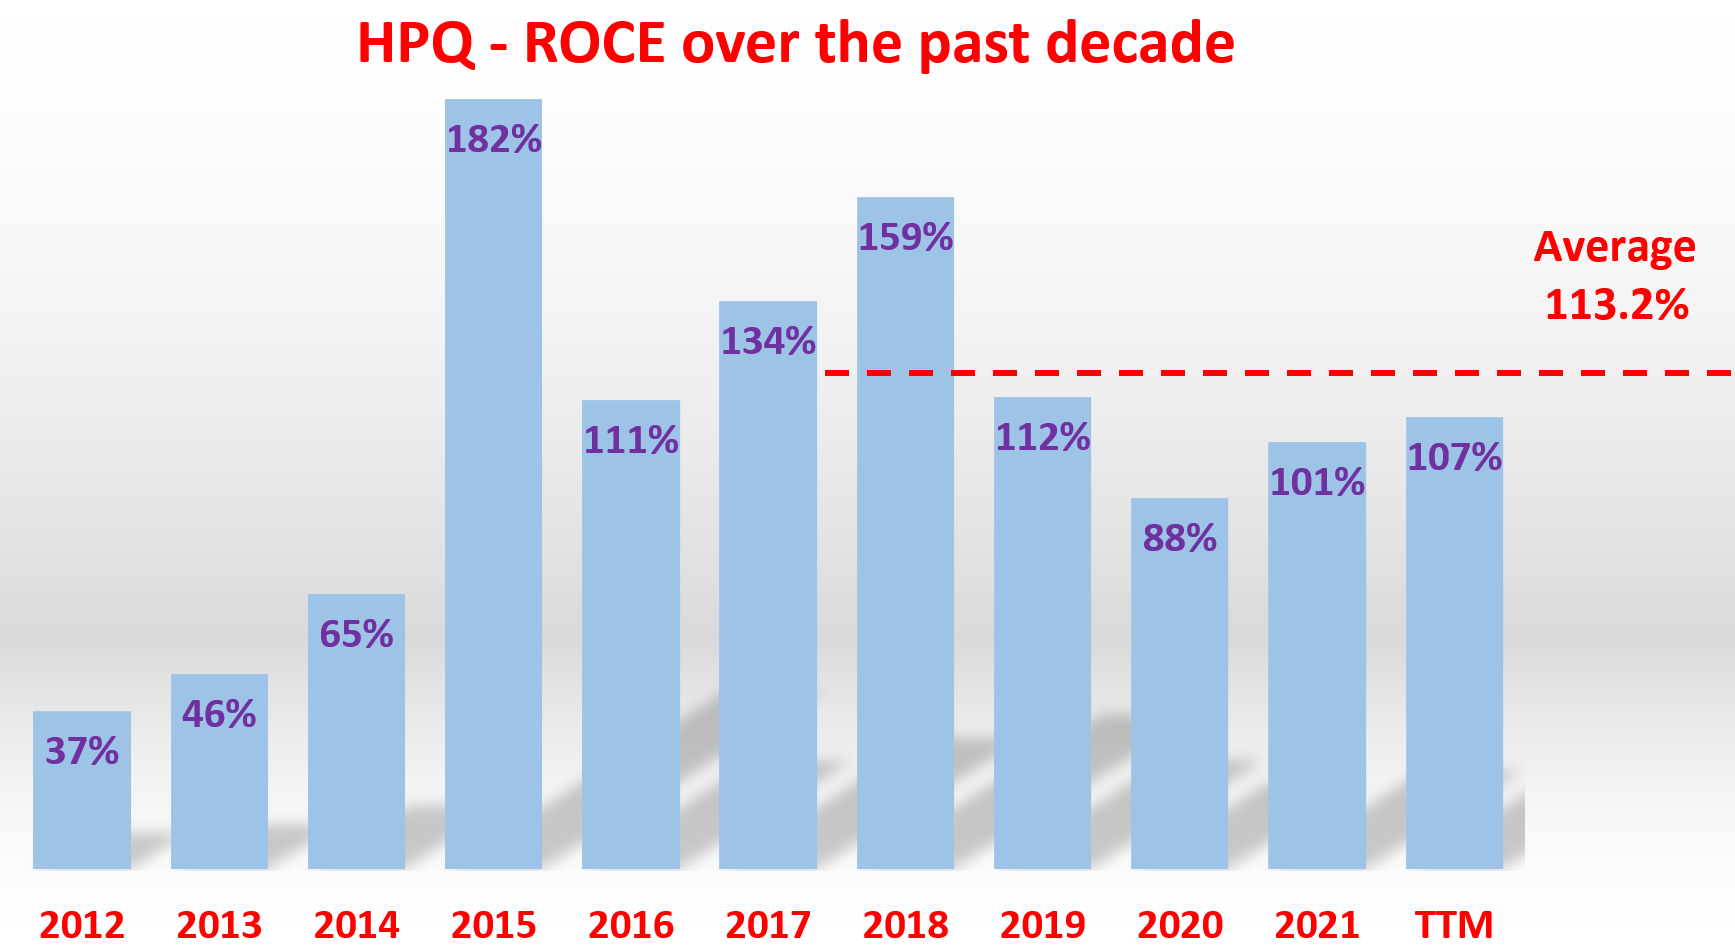
Source: Author based on Seeking Alpha data.
Marginal return on capital employed (“MROCE”)
Next, I will also argue that both HPQ and AAPL enjoy incredible scalability too even at their current scale. This argument is based on an analysis of their marginal return on capital employed (“MROCE”).
Detailed background information on MROCE can be found in my earlier article here. And a brief summary is provided here:
ROCE tells us how profitable the business has been or is SO FAR. And MROCE sheds insights into which direction the profitability is likely to go and how scalable it is. What the MROCE concept captures is a basic law in economic activities: the law of diminishing returns. As illustrated in the next chart, a business will first invest its money at projects with the highest possible rate of return. Therefore, the first batch of available resources is invested at a high rate of return – the highest the business can possibly identify. The second batch of money will have to be invested at a somewhat lower rate of return since the best ideas have been taken by the first batch of resources already, and so on. And finally, the end result is a declining MROCE curve as shown.
Warren Buffett, as usual, has the talent to put difficult concepts in more accessible words. And here is his much simpler and shorter way to explain the concept of scalability and also MROCE. The quote is taken from his 1992 Shareholder Letter (the emphasis is added by me):
Leaving the question of price aside, the best business to own is one that over an extended period can employ large amounts of incremental capital at very high rates of return.
The operative here is “incremental capital,” and the MROCE concept is designed precisely to capture the increment aspect. And next, you will see that both HPQ and AAPL are quintessential examples of this requirement. No wonder why Buffett likes both of them, A LOT.
Source: Author 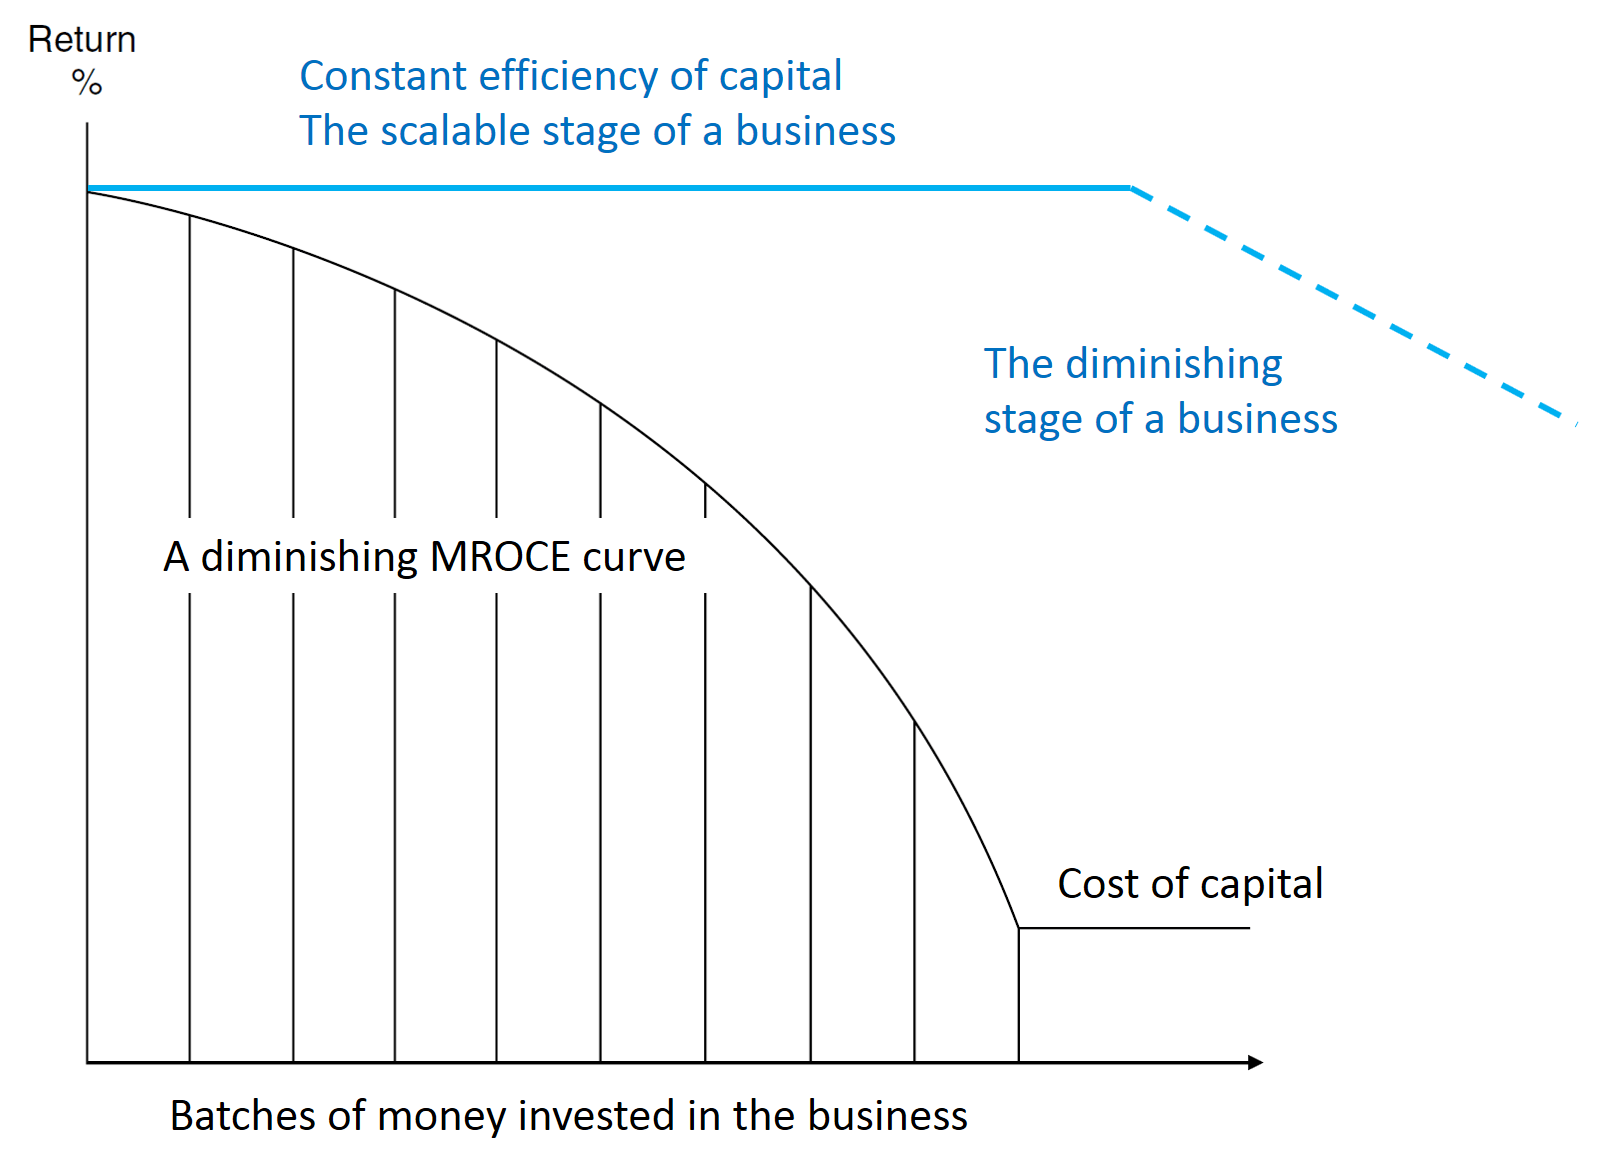
HPQ and AAPL: both highly scalable businesses
The next two charts show the MROCE and ROCE for HPQ and AAPL over recent years. The ROCE data are the same as those shown in the previous charts. The MROCE data are analyzed by the following steps: A) the capital employed (“CE”) was calculated for each year for each company, B) the incremental CE year over year was calculated, C) the incremental earnings year over year were calculated, and D) as the last step, the ratio between B and C was calculated to determine the MROCE.
The results clearly show the consistency of their MROCE and their scalability. More specifically, again, HPQ’s average ROCE over the past 5 years has been 113%. And at the same time, it has also been able to constantly identify lucrative opportunities to deploy incremental capital, as Buffett commented, as reflected in the fact that its MROCE matches (actually slightly exceeds) its ROCE. To wit, its MROCE in the recent 5 years since 2018 has been on average 119.2%, slightly above its average ROCE of 113%. The small difference could be due to rounding off errors or uncertainties in its financials. But the overall agreement is a conclusive demonstration of its profitability sustainability and scalability in my mind.
The case for AAPL is very similar, as you can see from the second chart below. Its ROCE has been averaging 136% in the past 3 years since 2020. And its MROCE is on average 109%, slightly below its average ROCE of 136%. Similar to the case of HPQ, the gap here is partially due to rounding off errors or uncertainties in its financials. Nonetheless, an MROCE above 100% indicates incredible scalability, even when AAPL is already at its current juggernaut scale.
Source: Author based on Seeking Alpha data. Source: Author based on Seeking Alpha data.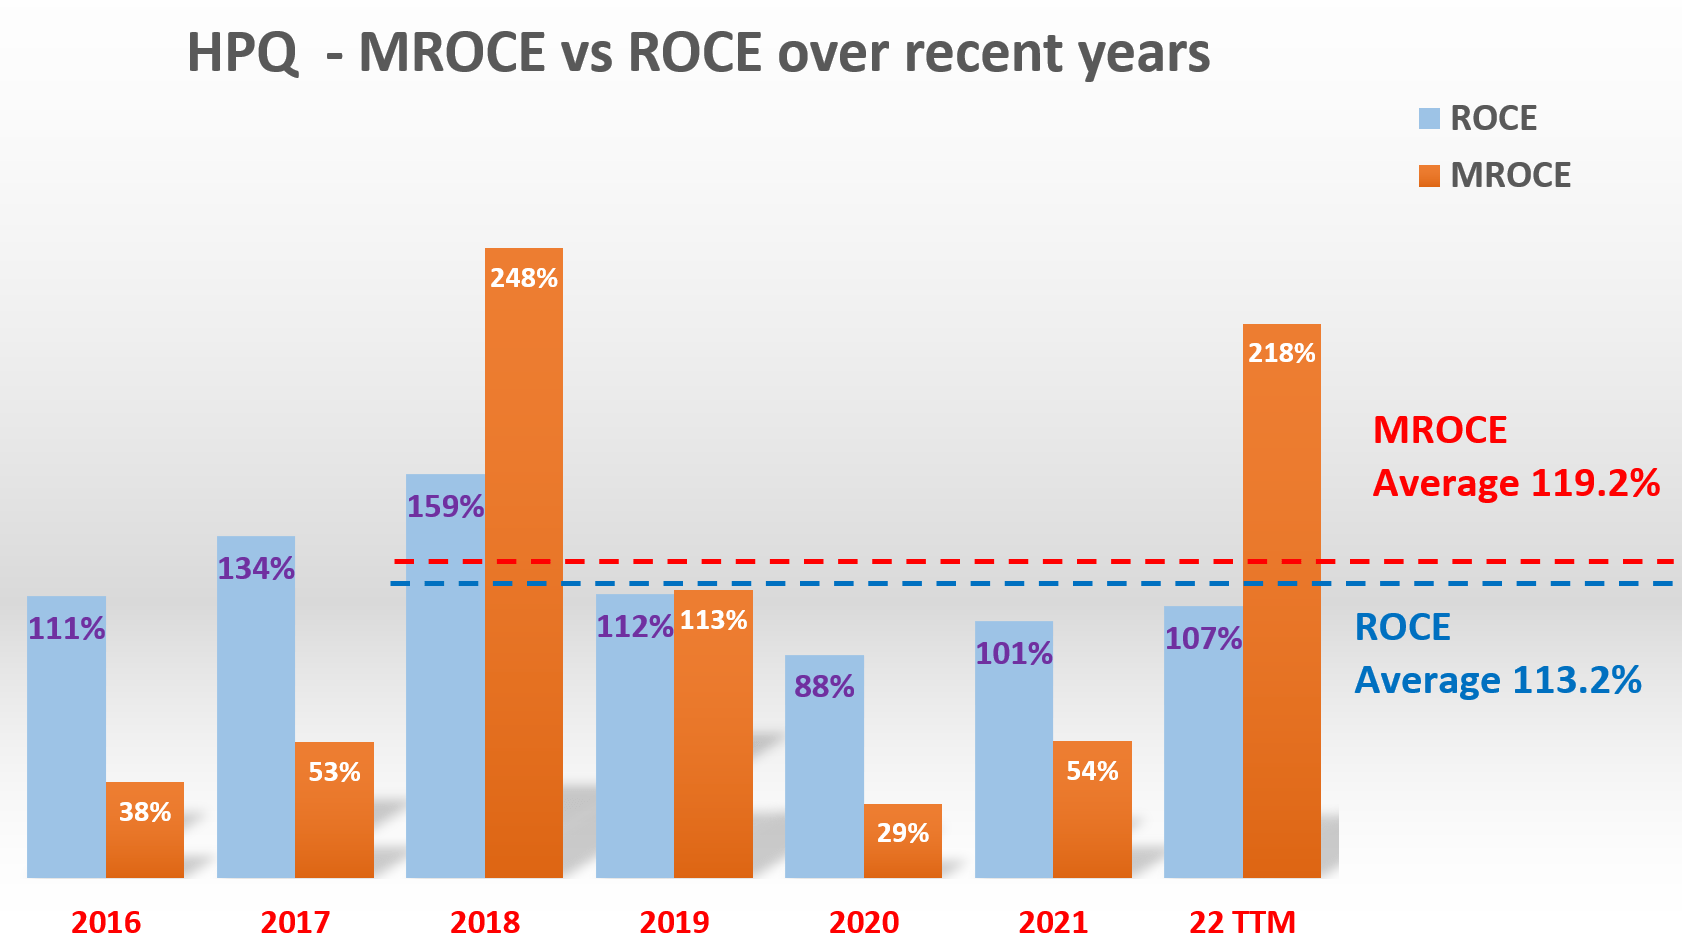

HPQ and AAPL: outsized expected returns
Due to their discounted valuation, strong profitability, and superb scalability, both stocks offer outsize return potential as summarized in the following two tables.
Financially, HPQ is not as strong as AAPL, which explains its lower valuation multiples. But it is in solid shape (B+ financial strength rating). In terms of specific valuation metrics, as can be seen from the following numbers in the table, at its current price level, it’s about 24% discounted based on its historical dividends yield and about 28% discounted based on its historical P/E multiples.
Looking forward, for the next 3~5 years, a double-digit annual growth rate is expected (say 10%) due to the ROCE and MROCE mentioned above. At ROCE and MROCE around 100%, only a 10% reinvestment rate, which can easily be sustained by HPQ’s operating earnings, can generate 10% organic growth rates. And the total return in the next 3~5 years is projected to be in a range of 82% (the low-end projection) to about 104% (the high-end projection), translating into a modest 16.2% to 19.5% annual total return.
Source: Author based on Seeking Alpha data.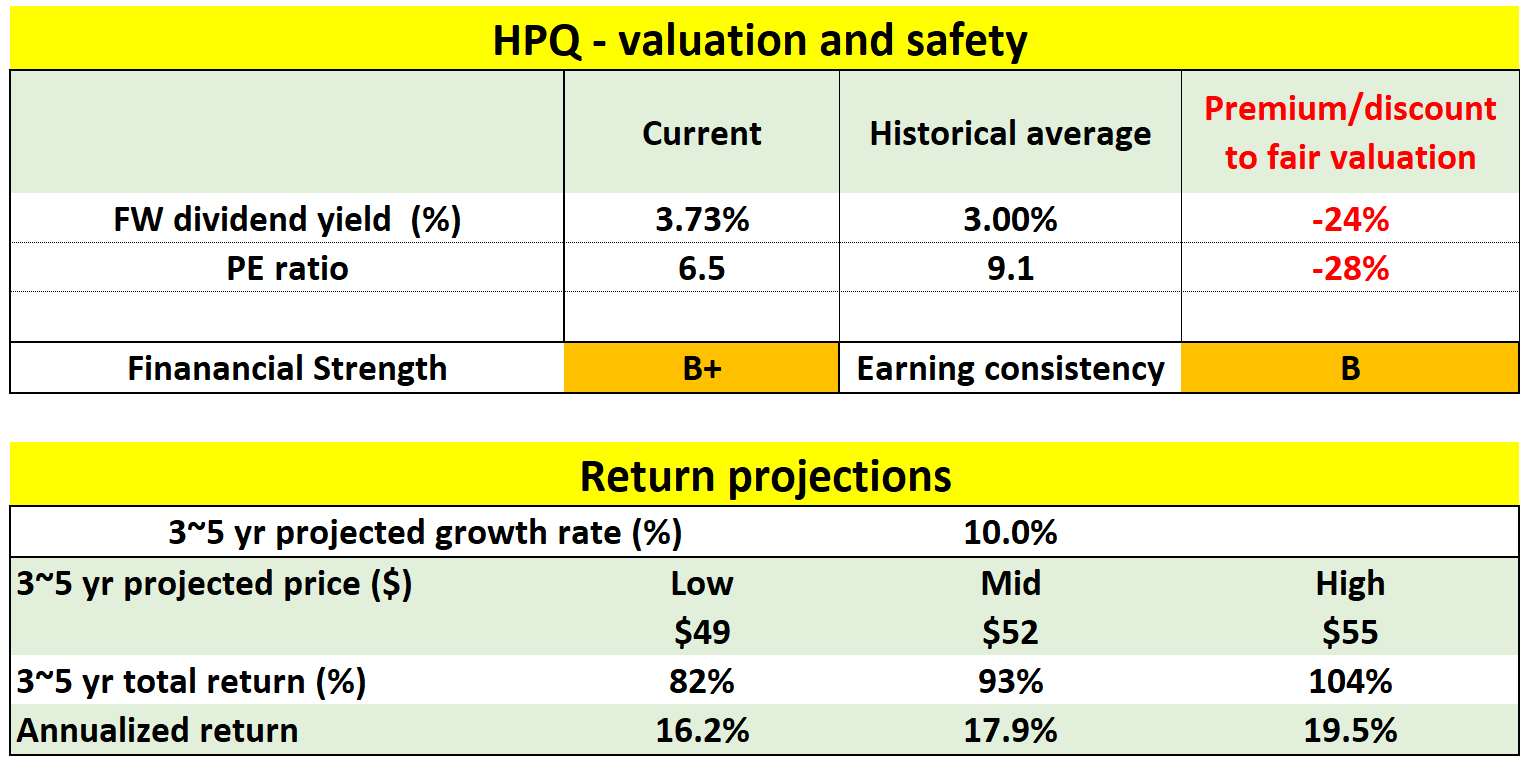
AAPL is financially strong (A++ financial strength rating) and also less cyclical compared to HPQ (hence its A+ consistency rating). And as a result, its valuation is also less discounted than HPQ. Specifically, it’s about 7% discounted based on its historical PE ratios and 10% discounted based on its historical Price to cash flow ratios.
Looking forward, for the next 3~5 years, an double-digit annual growth rate is also expected (say 10%), again considering its 100%+ ROCE and its bandwidth to easily sustain 10% reinvestment rates. And the total return in the next 3~5 years is projected to be in a range of 57% (the low-end projection) to about 62% (the high-end projection), translating into a modest 12.0% to 12.9% annual total return.
Source: Author based on Seeking Alpha data.
Risks and final thoughts
There are certainly risks associated with both stocks. Besides suffering from cyclicality and also overall macroeconomic uncertainties, they also face company-specific risks. For HPQ, it has both challenges and opportunities within its mature business segments such as its PC and printer products. These segments do not dictate HPQ’s earnings as much as they used to, but HPQ will need innovative strategies to revitalize the stagnating topline in these segments. Similar to HPQ, AAPL has been dealing with the slowdown in its personal electronics segment. And both of them have a large exposure to geopolitical risks such as those caused by the Russian/Ukraine situation and also the global supply chain disruptions since both generate a large portion of their profits overseas.
To conclude, HPQ and AAPL both occupy a large position in Buffett’s Berkshire equity portfolio, for very good reasons. Besides their obvious similarities, both share deeper and hidden traits that make them unique investment opportunities. Both of them boast ROCE above 100% and maintain incredible scalability at the same time. Furthermore, their current P/Es have already reached a cycle bottom well before the contracting phase bottoms (which I anticipate to happen sometime in 2023). And the market volatility in Q4 may offer them at even more attractive entry prices.
HP and Apple are truly the quintessential examples of Buffett-style compounders – a rare species that combines both superb profitability and the ability to deploy increment capital at equally profitable levels. No wonder Buffett likes both of them, A LOT.
Be the first to comment