

Natali_Mis/iStock via Getty Images
A guest post by D Coyne
The US Energy Information Administration (EIA) published its Annual Energy Outlook (AEO) 2022 on March 3.
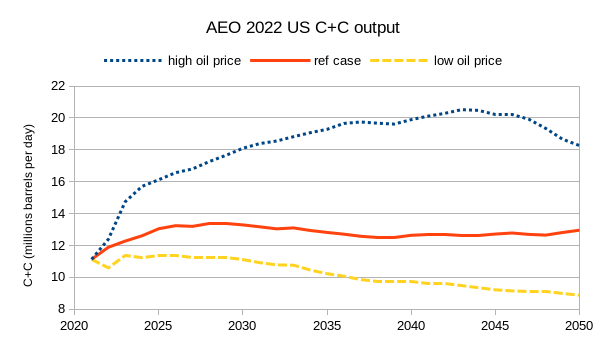
Figure 1
Three scenarios are shown in the chart above for a low oil price scenario, a reference case scenario, and a high oil price scenario. The cumulative crude plus condensate (C+C) output for the scenarios from January 2021 to December 2050 is 112 Gb, 140 Gb, and 200 Gb for the low oil price, reference, and high oil price cases, respectively.
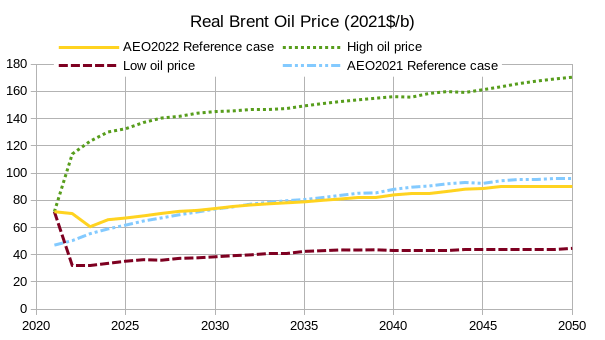
Figure 2
The real Brent oil prices for the AEO 2022 reference case and low and high oil price cases are shown in figure 2 above and the AEO 2021 reference case is included for comparison (little changed from last year). Based on current oil prices, the high oil price case might be more reasonable, but oil prices are volatile and the future oil price is not known.
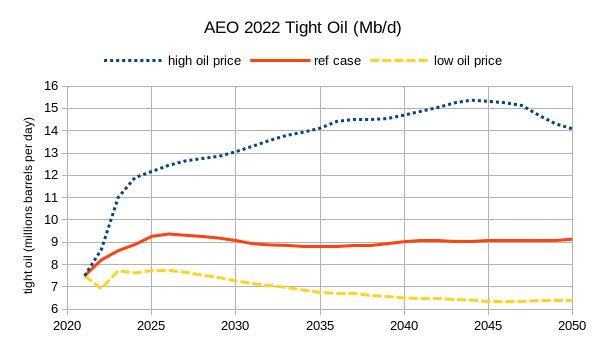
Figure 3
The chart above shows the AEO 2022 tight oil cases for the reference oil price and the low and high oil price cases (as shown in figure 2). Cumulative tight oil output from 2021 to 2050 is 76 Gb, 98 Gb, and 148 Gb for the three cases.
Actual output for both US C+C and tight oil is likely to be far less than what the EIA predicts in AEO 2022 because the real oil price scenarios do not anticipate falling demand for oil as the World transitions to electric land transport. By 2035 at the latest (and potentially this might occur by 2030), demand for crude plus condensate is likely to be falling faster than the supply of oil in a high oil price scenario. This will lead to falling oil prices.
I have created a simple scenario that uses the high oil price scenario up to 2030, has flat oil prices at the 2030 level until 2035 and then oil prices fall to the low oil price scenario level by 2039 and then gradually fall by $1/b per year from 2040 to 2050. Chart below presents this modified oil price scenario in chart form.
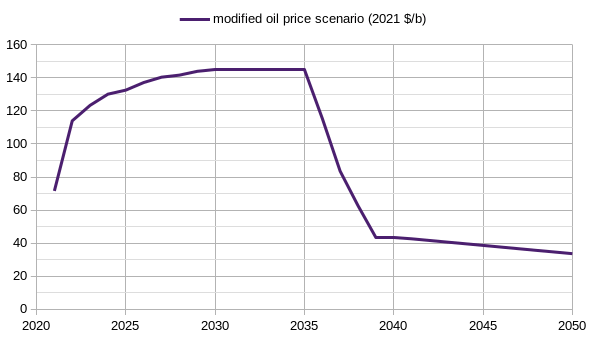
Figure 4
Using the oil price scenario above, we can estimate what tight oil output might look like using the high oil price case, the reference case, and the low oil price case.
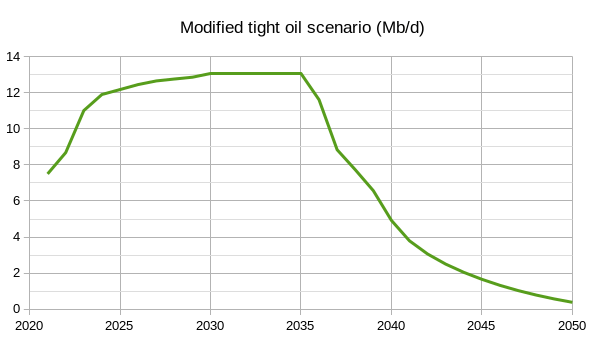
Figure 5
For the modified tight oil scenario above, I assume no new wells are completed after 2039 due to the low oil price (under $44/bo in 2021$). Note that the average 2020 Permian basin well barely breaks even at $43/bo at the refinery gate, in 2039, average new well productivity is likely to be lower, costs are likely to be higher, and breakeven oil prices will be considerably higher than in 2020 or 2021. Cumulative output for this tight oil scenario is 87 Gb from 2021 to 2050. Note also that if we assume oil prices start to fall in 2030 rather than 2035, and assume the decline is as rapid as in my modified oil price scenario from 2035 to 2050, but the curve is shifted 5 years to the left, then cumulative tight oil output would decrease by 24 Gb from 2021 to 2050 to about 63 Gb.
An earlier scenario for tight oil that I created in a previous post is compared with the modified tight oil scenario in figure 5 in the figure below.
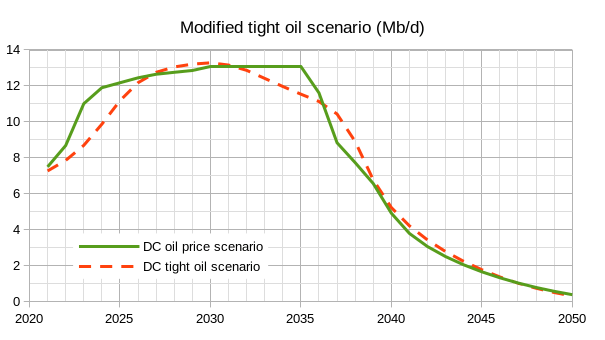
Figure 6
Cumulative output for the DC tight scenario is 85 Gb from 2021 to 2050. Note that a different oil price scenario with oil prices falling sharply in 2030 rather than 2035 would reduce cumulative output by roughly 20 Gb.
Editor’s Note: The summary bullets for this article were chosen by Seeking Alpha editors.
Be the first to comment