

primeimages/E+ via Getty Images
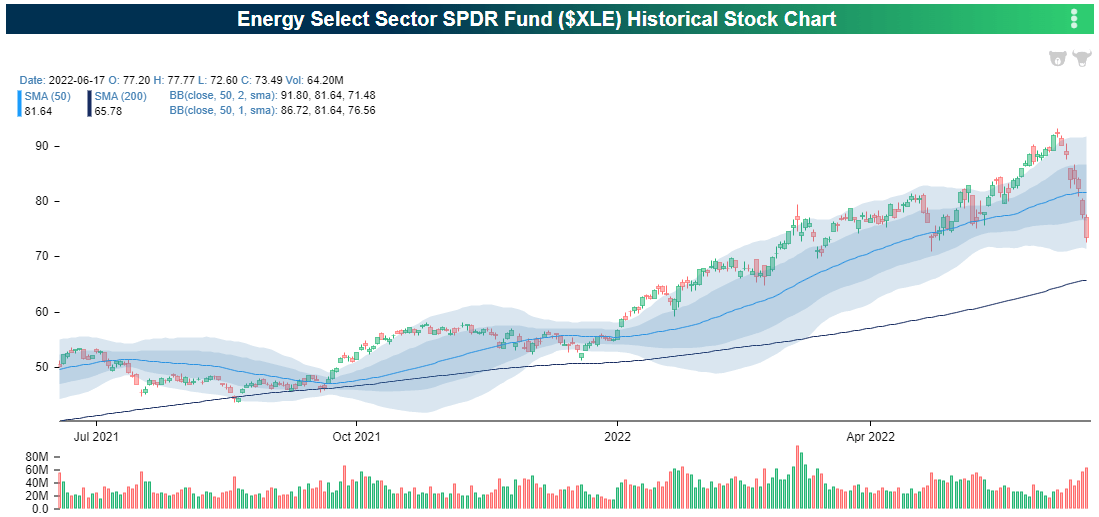
The Energy sector bounced along with the overall market on Tuesday, but last week, it was that sector’s turn to get taken to the woodshed. Throughout the year, Energy was the only sector that worked, and less than two weeks ago, it traded at 52-week highs. From the high on June 8th through Friday’s close, though, the S&P 500 Energy sector fell over 20%. The only other times since at least 1990 that the Energy sector fell more than 20% in an eight-trading day span were in October 2008 and March 2020. While the sector’s 50-day moving average didn’t hold in last week’s plunge, the sector was able to hold support at its late April lows.
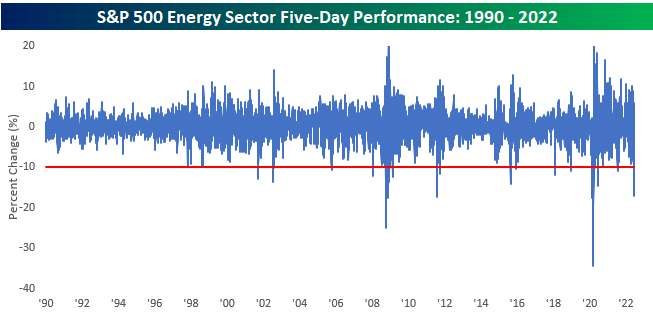
In addition to falling over 20% in an eight-day span, the Energy sector’s 17.2% decline last week (5 days) was also one that was surpassed by only a handful of other periods (October 2008, August 2011, and March 2020) since 1990. While declines of last week’s magnitude have been very uncommon, Energy is a volatile sector, and as illustrated in the chart below, there have been a number of periods in the last thirty years when the sector fell 10% or more (red line) in a five-day span.
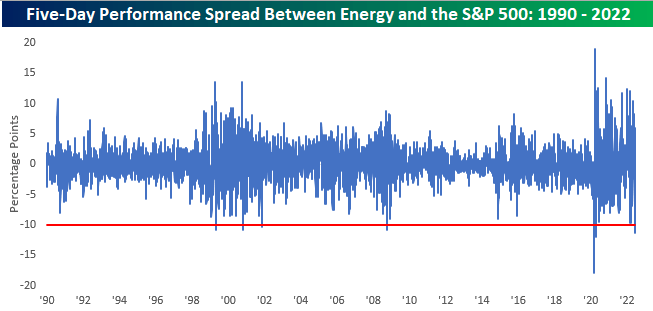
Of the periods mentioned above where the Energy sector dropped as much as it did in the five days ending last Friday, they were also periods of overall market weakness. To help adjust for broader market moves, the chart below shows the rolling five-day performance spread between the S&P 500 Energy sector and the S&P 500 going back to 1990. Last week marked just the sixth period in the last 30+ years that the Energy sector underperformed the S&P 500 by more than ten percentage points in a five-trading day span. The other periods were April 1999, October 2000, November 2001, October 2008, and March and April 2020. On a side note, one aspect of the chart below that really stands out is how untethered the Energy sector has become relative to the S&P 500. Since 2020, the range of out/underperformance for the sector relative to the S&P 500 has widened out to an unprecedented range.
Separately, given the fact that Energy’s decline occurred as oil prices were only down a bit over 10% from their 52-week high (-11.4%), we were curious to see how far WTI was from 52-week highs following prior five-day periods where the Energy sector experienced massive underperformance. Of the six prior periods, there was only one where crude oil was down less relative to its 52-week high than it was as of last Friday (April 1999). Additionally, the only other time it was down by a similar amount was in October 2000. In the remaining four periods, crude oil prices had already declined significantly relative to their 52-week highs with declines of at least 48% and up to 70%.
Editor’s Note: The summary bullets for this article were chosen by Seeking Alpha editors.
Be the first to comment