

It isn’t this hard to make money swapping between preferred shares. We lay out the relevant price targets and explain the reasons for each trade. Alistair Berg
Get ready for charts, images, and tables because they are better than words. The ratings and outlooks we highlight here come after Scott Kennedy’s weekly updates in the REIT Forum. Your continued feedback is greatly appreciated, so please leave a comment with suggestions.
Last time some investors asked about the current opportunities in preferred shares. The preferred shares for mortgage REITs are looking great. Prices got hammered as credit spreads opened due to recessionary risk, but the risk to these mortgage REITs is much smaller than it was in the pandemic. What happened then? All of the preferred shares recovered to trade at least relatively close to $25.00. The ones that had paused dividends repaid all missing dividends and resumed normal payments.
Today I want to share one of our latest trades. This comes directly from a trade alert we sent to subscribers of The REIT Forum.
Trades Placed
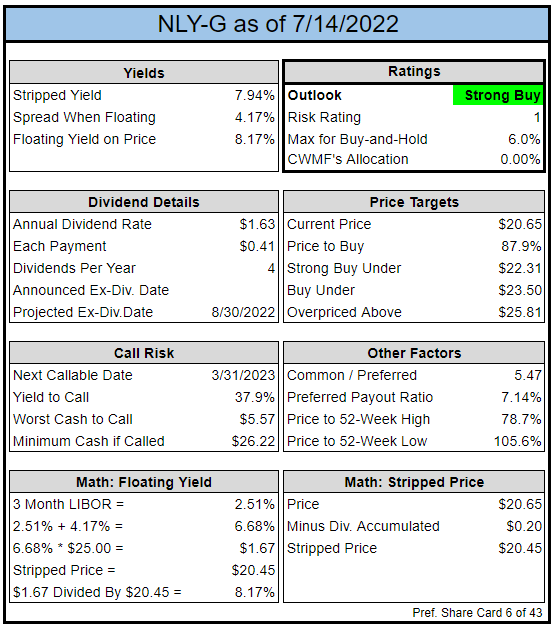
- Sold 1,608 shares of NLY-G (NLY.PG) at $20.6576.
- Purchased 1,651 shares of AGNCM (AGNCM) at $20.1204 to replace NLY-G.
- The total sale value was $33,217.47 and the total purchase price was $33,218.76, so these positions were almost exactly equal.
Brief Commentary
On June 20th, 2022, we published an article detailing opportunities to swap between the preferred shares. About a week later, we followed our own article by swapping our AGNCP (AGNCP) for NLY-G.
This move continues the sequence of trades between similar preferred shares.
To put this in a sequence, we swapped 403 shares of AGNCP for 423 shares of NLY-G, then swapped those shares for 434 shares of AGNCM.
We had another 1,185 shares of NLY-G that came from selling part of our position in NRZ. Those shares were also sold to buy more AGNCM.
Index Cards
The REIT Forum The REIT Forum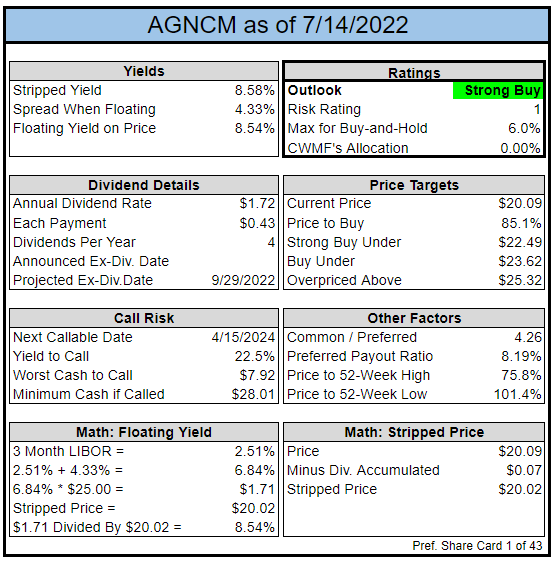
Account
These trades all went through a tax-advantaged account. That’s appropriate for positions I want to be able to trade actively.
We previously provided a brief guide on utilizing tax-advantaged accounts.
Execution
Schwab Schwab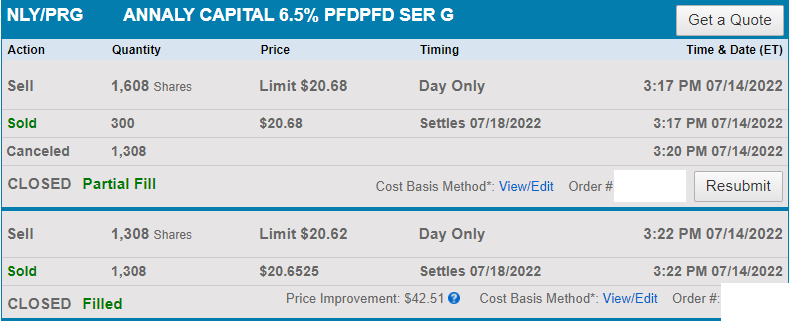
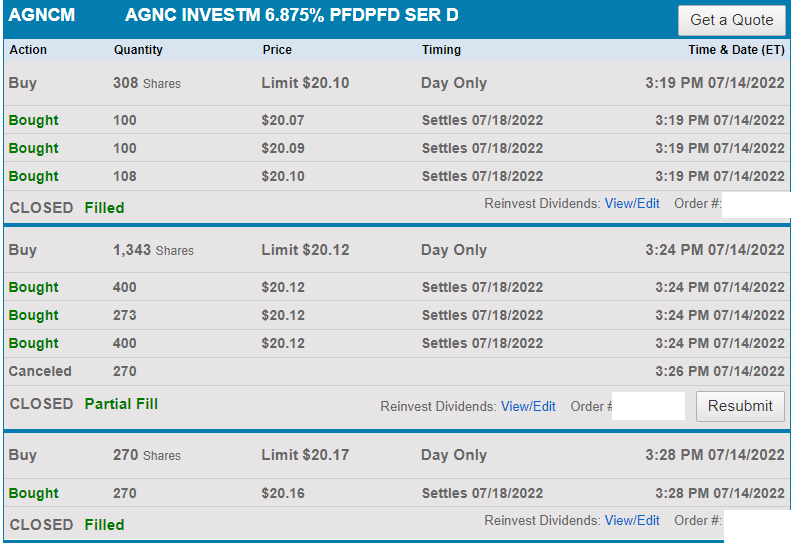
I had to modify orders a few times to push the limit price for execution. Shares of AGNCM were initially at $20.00, but I called them out in chat before placing the trade. Members were able to pick up all the $20.00 shares before I went to trade.
Note: If an order has 0 shares executed, I usually chop it out of the image to conserve space. This is why you may see a brief gap between the time one order is canceled and the next one started.
Charts
I called the idea out in chat to highlight that investors could swap from AGNCN (AGNCN) to AGNCM. The disparity in their share prices was at all-time highs:
The REIT Forum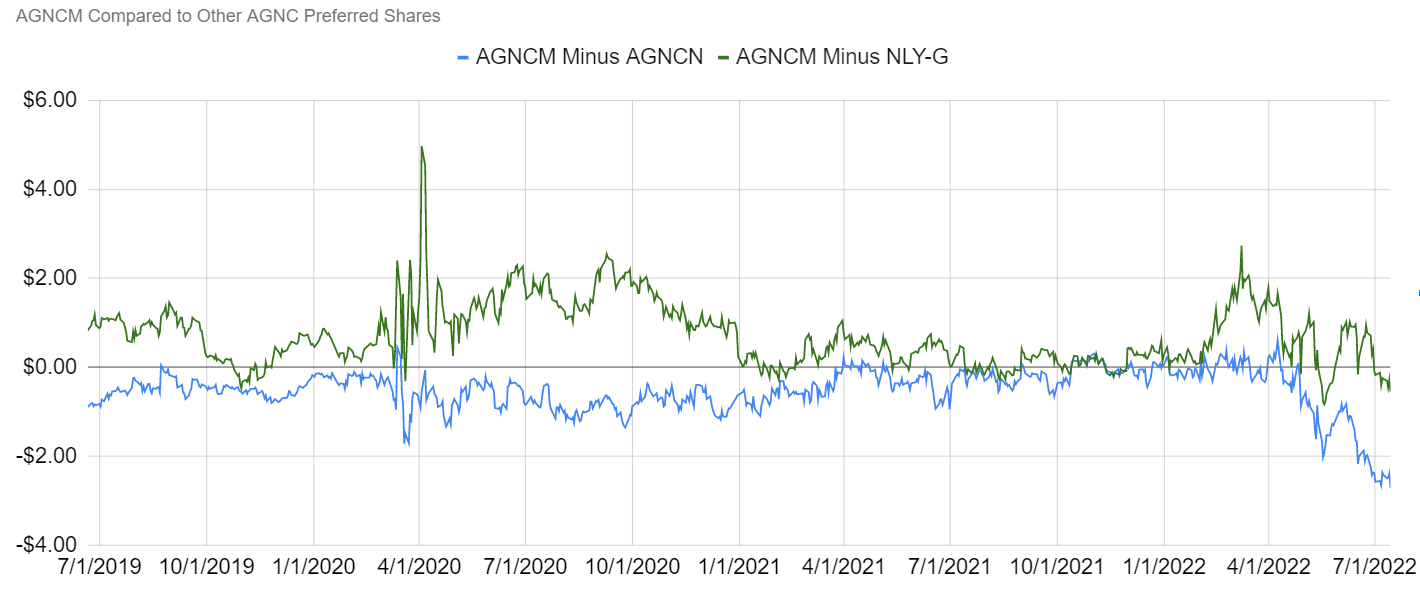
A share of AGNCM during the call-out cost $2.85 less than a share of AGNCN. That’s a massive spread. Even with it coming in a few cents, the spread between the two is massive. I would’ve loved to dump AGNCN to buy AGNCM, but I didn’t have any AGNCN for that trade.
However, I was able to clear about $.54 per share while swapping from NLY-G to AGNCM. That resulted in turning 1,608 shares of NLY-G into 1,651 shares of AGNCM.
By our estimates, NLY-G and AGNCM should trade at pretty similar prices. Investors get a slightly better floating spread with AGNCM, but they also have to wait about 12 more months for the floating rate. Those factors mostly offset, so we think AGNCM should trade about $.12 above NLY-G in this environment. So, we would have a slight preference for 1 share of AGNCM over 1 share of NLY-G. When we can trade 1,608 for 1,651 shares, that’s a bonus of 43 shares.
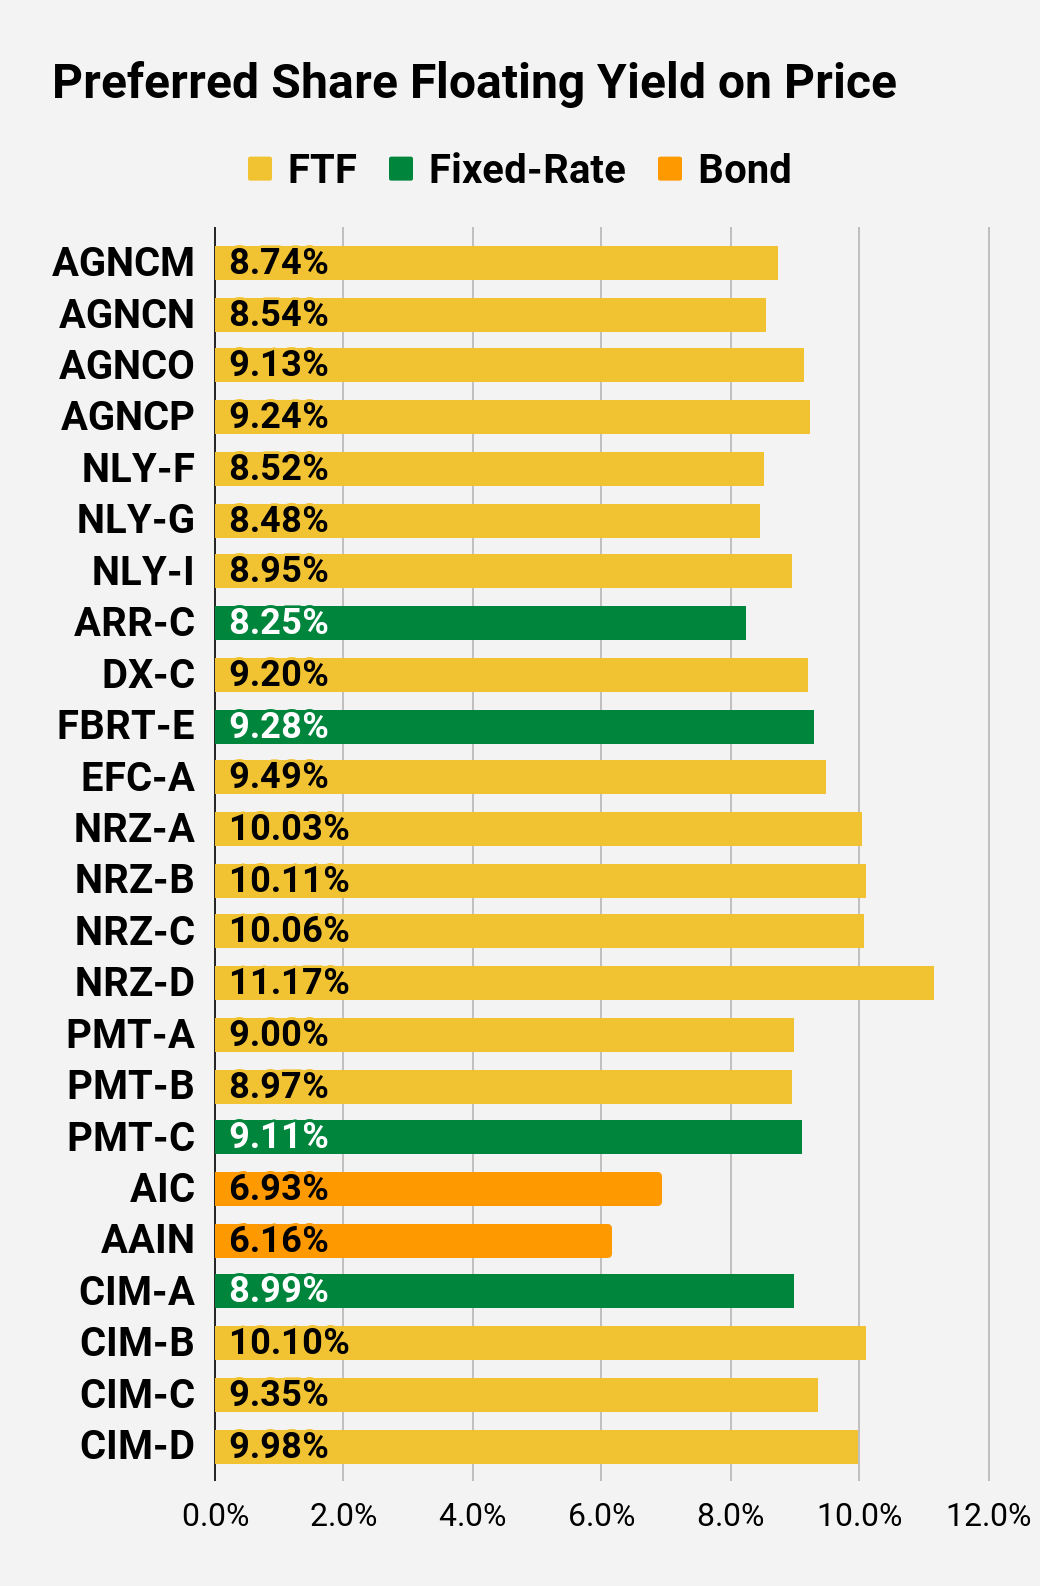
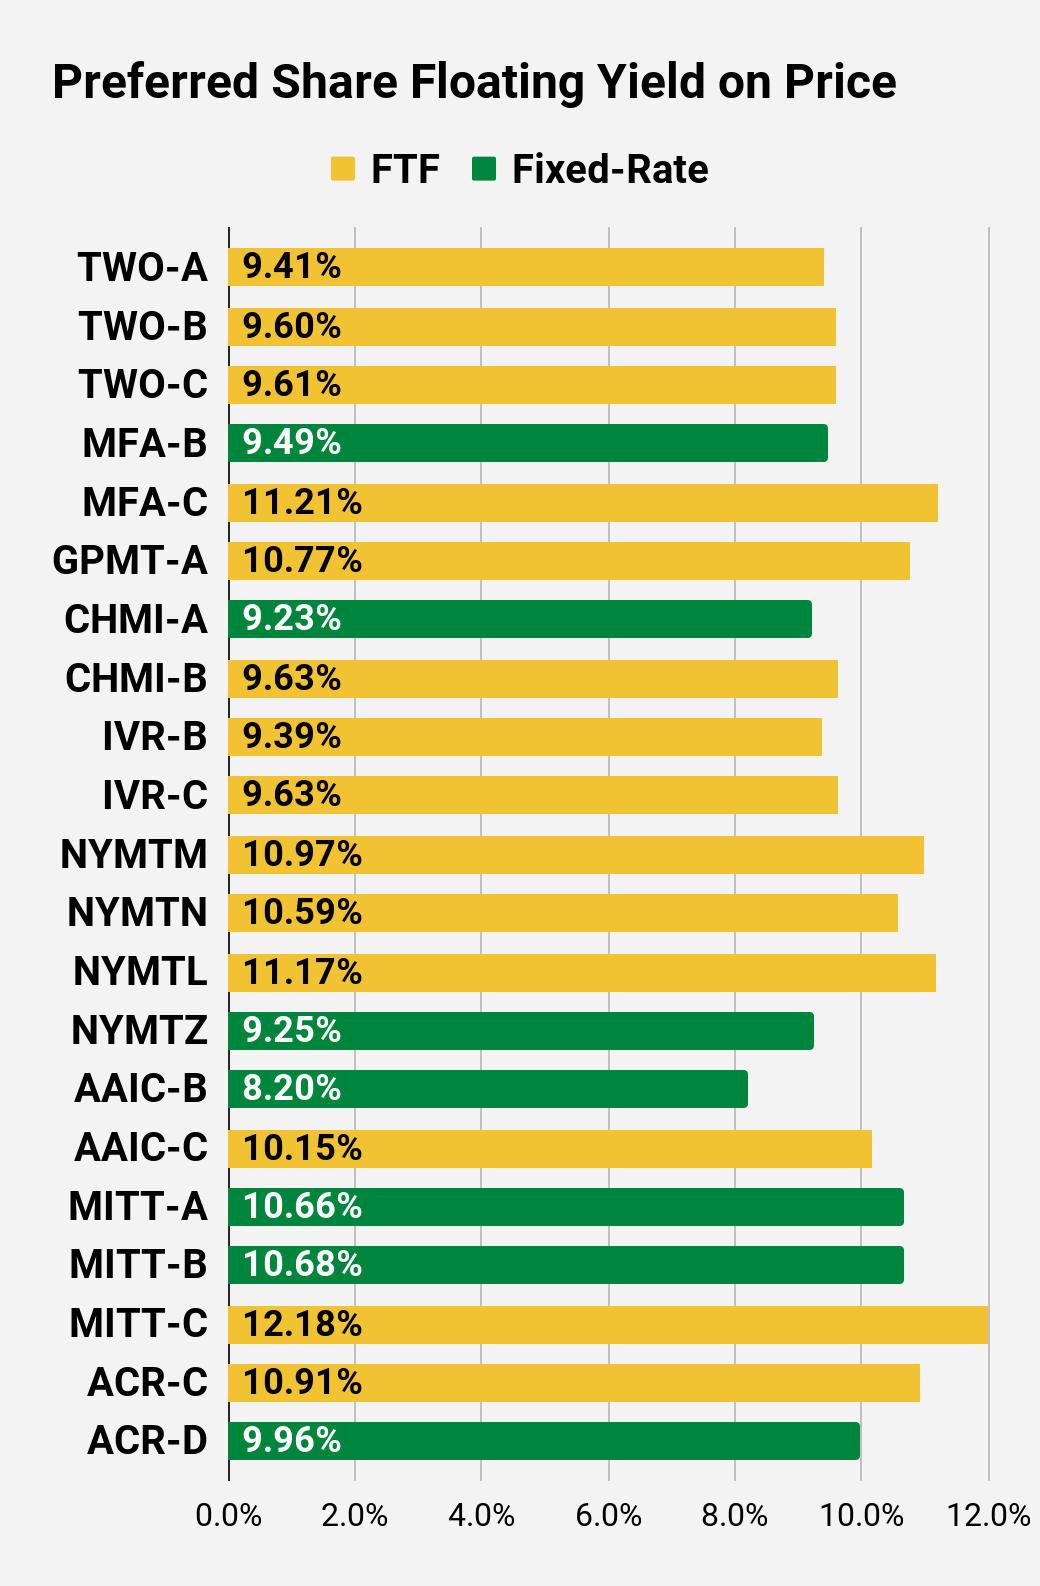
Since shares of AGNCM have a slightly wider spread and were cheaper, they will also have a better floating yield on price. Regardless of where future interest rates land, AGNCM has a bigger spread and we got a 2.7% increase in the number of shares.
Returns for Open Positions
The REIT Forum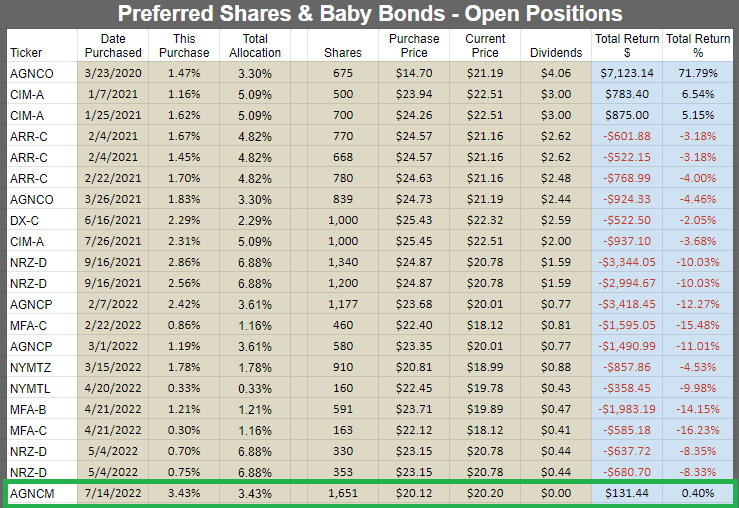
Returns for Closed Positions
The REIT Forum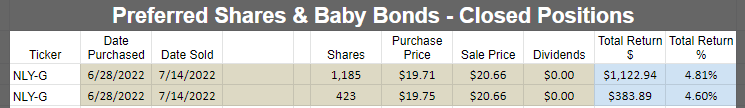
Not bad at all for less than 3 weeks. We put together a nice gain, but we also outperformed most of the other AGNC / NLY preferred shares during that period.
For reference, we sold our shares of AGNCP at $20.74 to buy the NLY-G at $19.71 to $19.75.
Since then, shares of AGNCP are down about 3% on share price, but only about 1% adjusted for the ex-dividend. Meanwhile, we were able to pick up an extra 4.6% to 4.8% in NLY-G. Now we’re expecting to generate some alpha from being in AGNCM.
Just like the position in NLY-G, we won’t be attached to it. If AGNCM significantly outperforms peers, we have no problem swapping back to a different position. Our goal is still to have exposure to the AGNC / NLY preferred shares. We’re just jumping back and forth when one gets materially cheaper than the other.
How can you get a feel for what jumps we might make? The Google Sheets are a pretty good tool for predicting it. The “price-to-buy” column (that’s column E for preferred shares) is your friend.
Conclusion
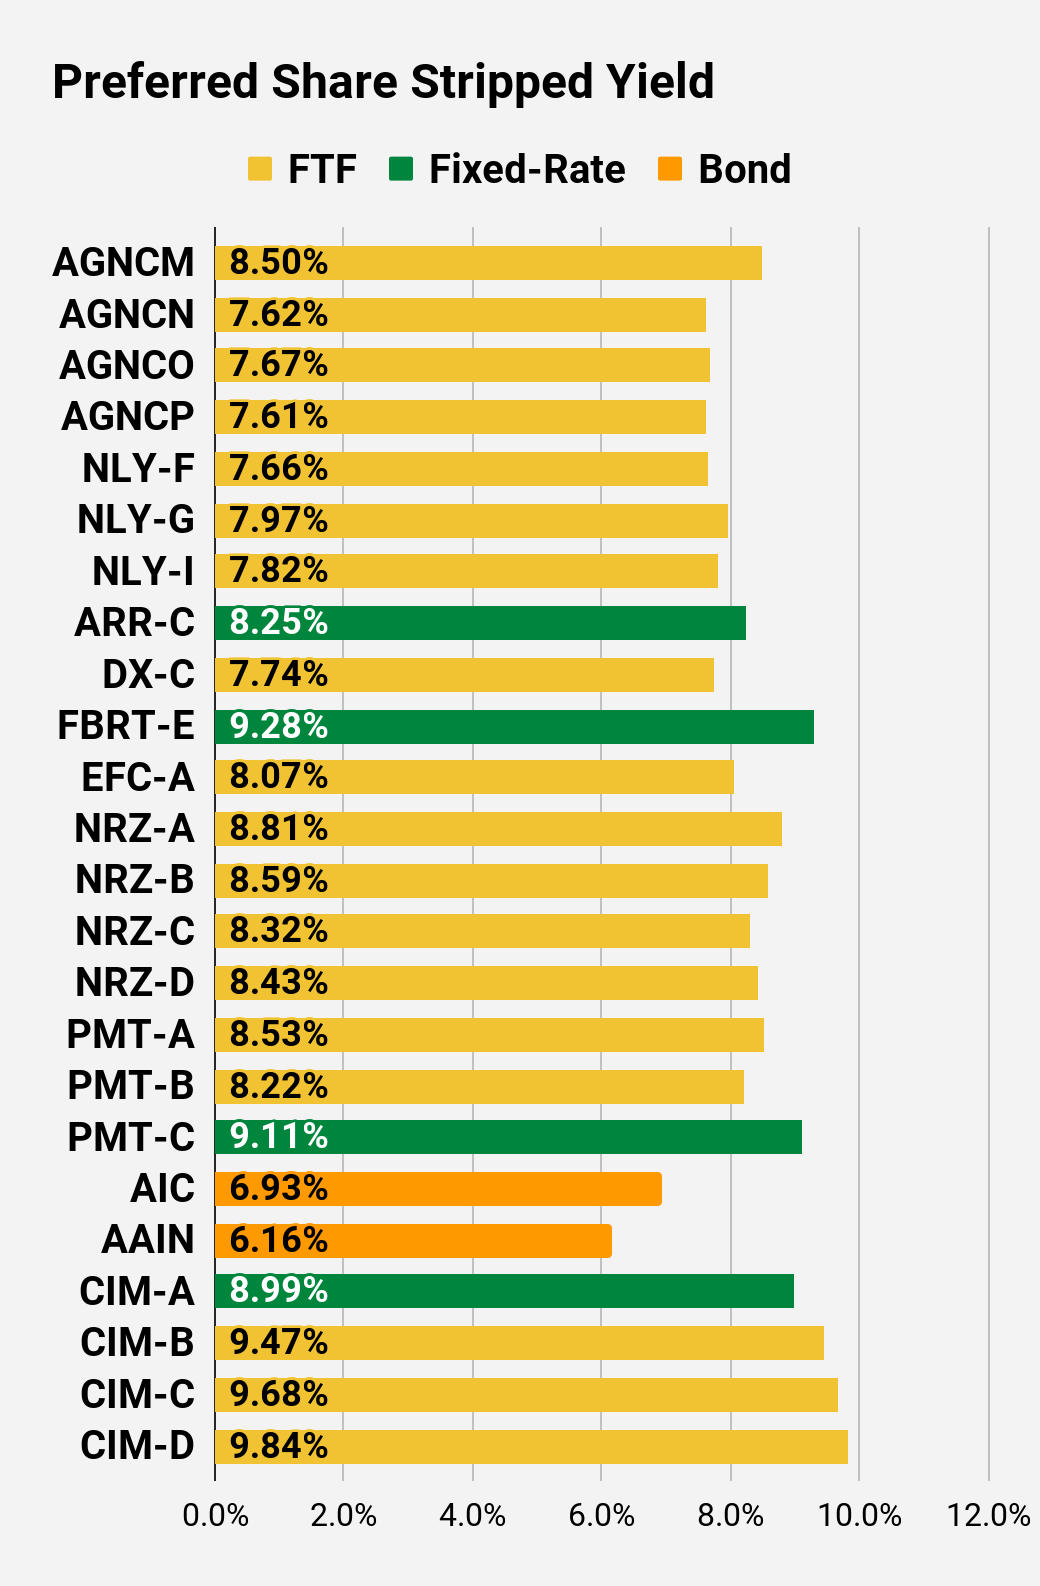
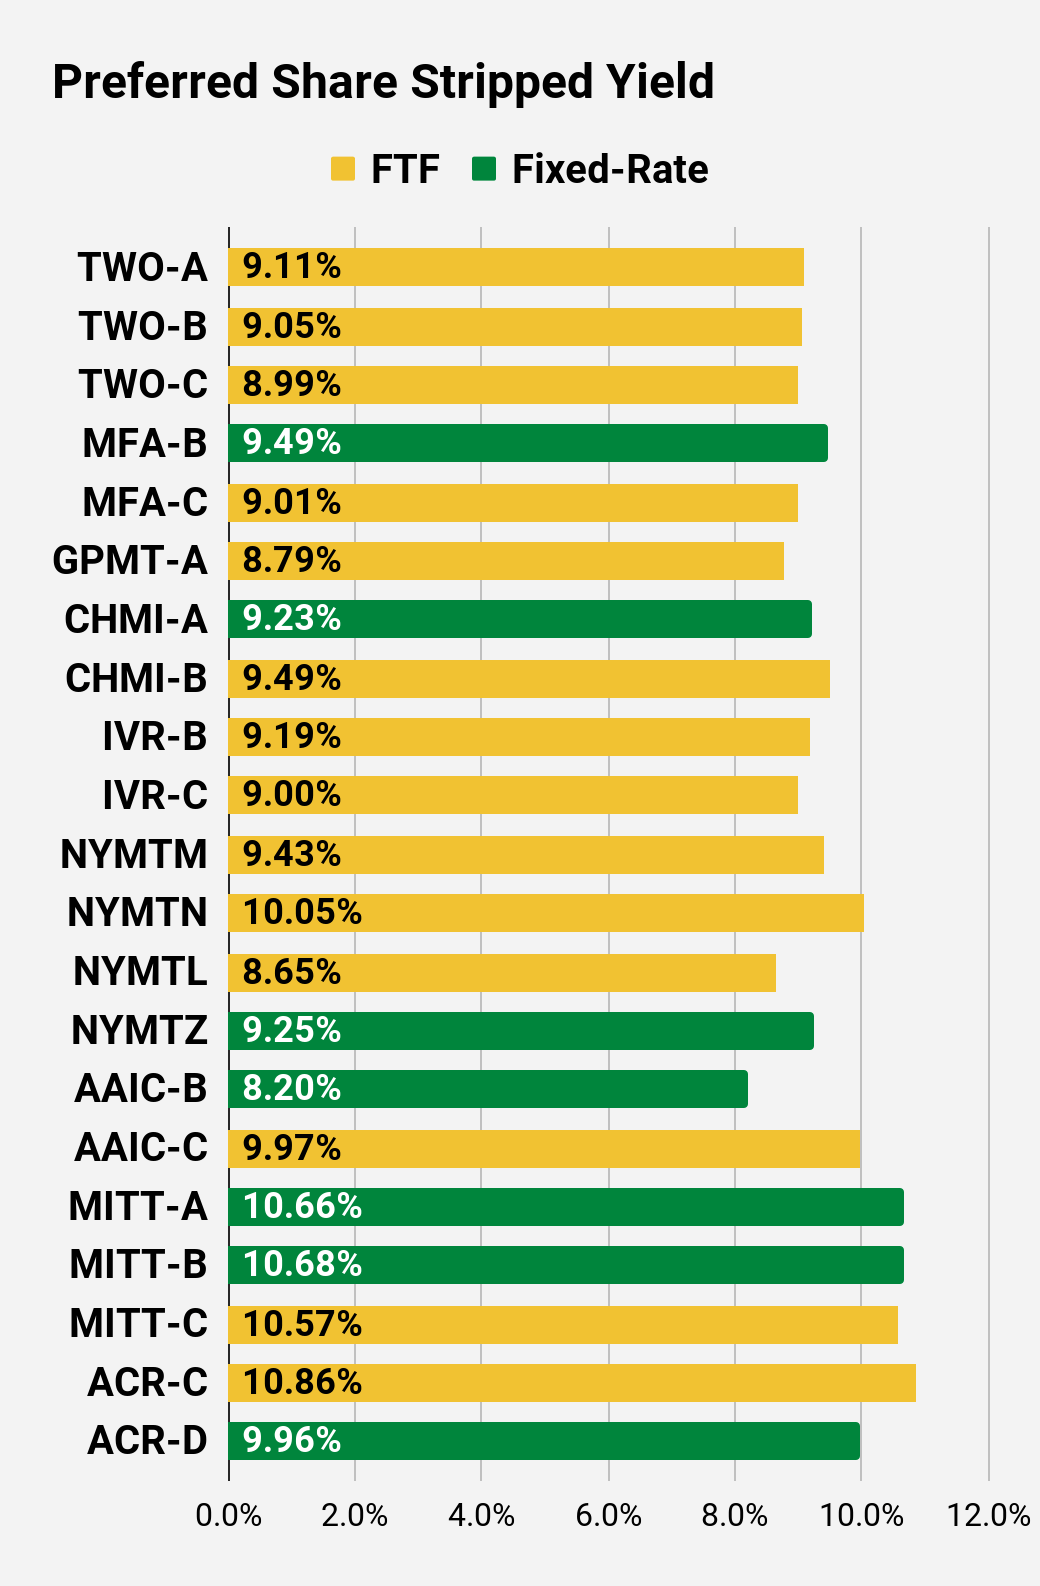
The occasional swap between preferred shares can ramp up the total returns. We’re still getting a very respectable stripped yield of around 8%. This trade simply leads to a greater volume of shares. If we eventually ended up trading AGNCM for AGNCP, we would be completing a full cycle of swapping between the shares to end up with more shares than we had initially.
For instance, AGNCP and AGNCM were both trading right around $20.00. We decided to enter AGNCM instead of AGNCP because historically AGNCM is more likely to be overvalued (providing a great exit opportunity).
If we used the opportunity to swap NLY-G for AGNCP, it would’ve completed the full circle. That would have been 403 shares of AGNCP becoming 423 shares of NLY-G, then becoming 434 shares of AGNCP. Anyone who doesn’t believe 434 shares of AGNCP is superior to 403 shares of AGNCP shouldn’t be investing. Even reinvesting dividends would only have given the investor in AGNCP about 7 extra shares, but 410 shares of AGNCP is still less than 434 shares. That’s why we highlight the concept of the full circle. It demonstrates that we successfully make it back to the original position with extra shares.
The current step in this circle is sitting in AGNCM and waiting for them to outperform.
End of Subscriber Trade Alert
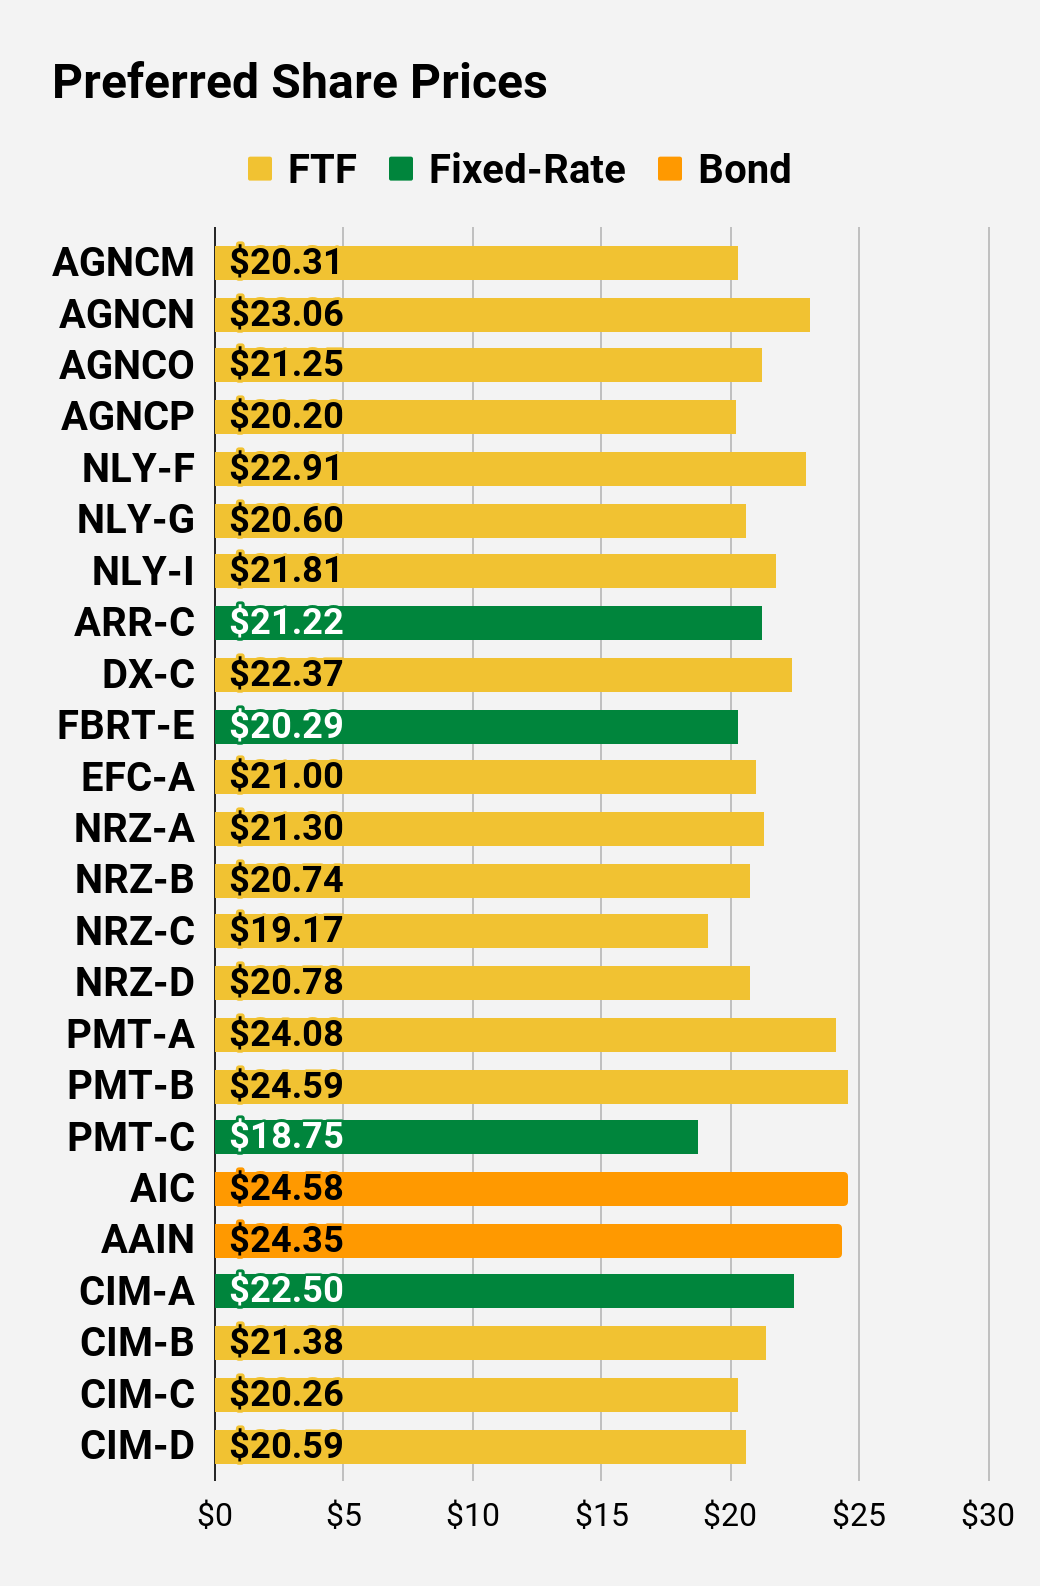
The relative prices are already moving in the expected direction, but they didn’t move much. AGNCM is up to $20.31 (about 1%) and NLY-G at $20.60 is down about $.02 (basically a rounding error). Combined, that’s just over a 1% move. I think we’ll see AGNCM outperform by a bit more. If AGNCM outperforms as expected, then I’ll look at my other options and be ready to change positions again. However, we still have some room to run in this idea. It’s only moved about 1% since we entered the position.
For investors who aren’t familiar with my work, it’s pretty rare for us to have a position in AGNCM. Simply put, AGNCM usually isn’t one of the cheapest shares. We’ve traded between the preferred shares several times to take advantage of mispricing, but this is only the second time our path resulted in buying AGNCM. Investors used to overvalue the shares because they had a high current yield, but today they look undervalued. I think investors are displeased that the floating rate is so far away, but is a stripped yield of about 8.5% really that bad? I don’t think so. It’s not like we’re getting a weak yield while we wait for the floating rate to kick in.
Our bright idea to move into NLY-G on 6/28/2022 delivered over $1,500 in returns. Not bad for a few weeks. Part of our position was funded by selling shares of AGNCP. What if we had stayed in AGNCP? Prices are down a bit more than 2%. The dividend offset most of the decline, but the move to NLY-G clearly provided some alpha.
The rest of the charts in this article may be self-explanatory to some investors. However, if you’d like to know more about them, you’re encouraged to see our notes for the series.
Stock Table
We will close out the rest of the article with the tables and charts we provide for readers to help them track the sector for both common shares and preferred shares.
We’re including a quick table for the common shares that will be shown in our tables:
Let the images begin!
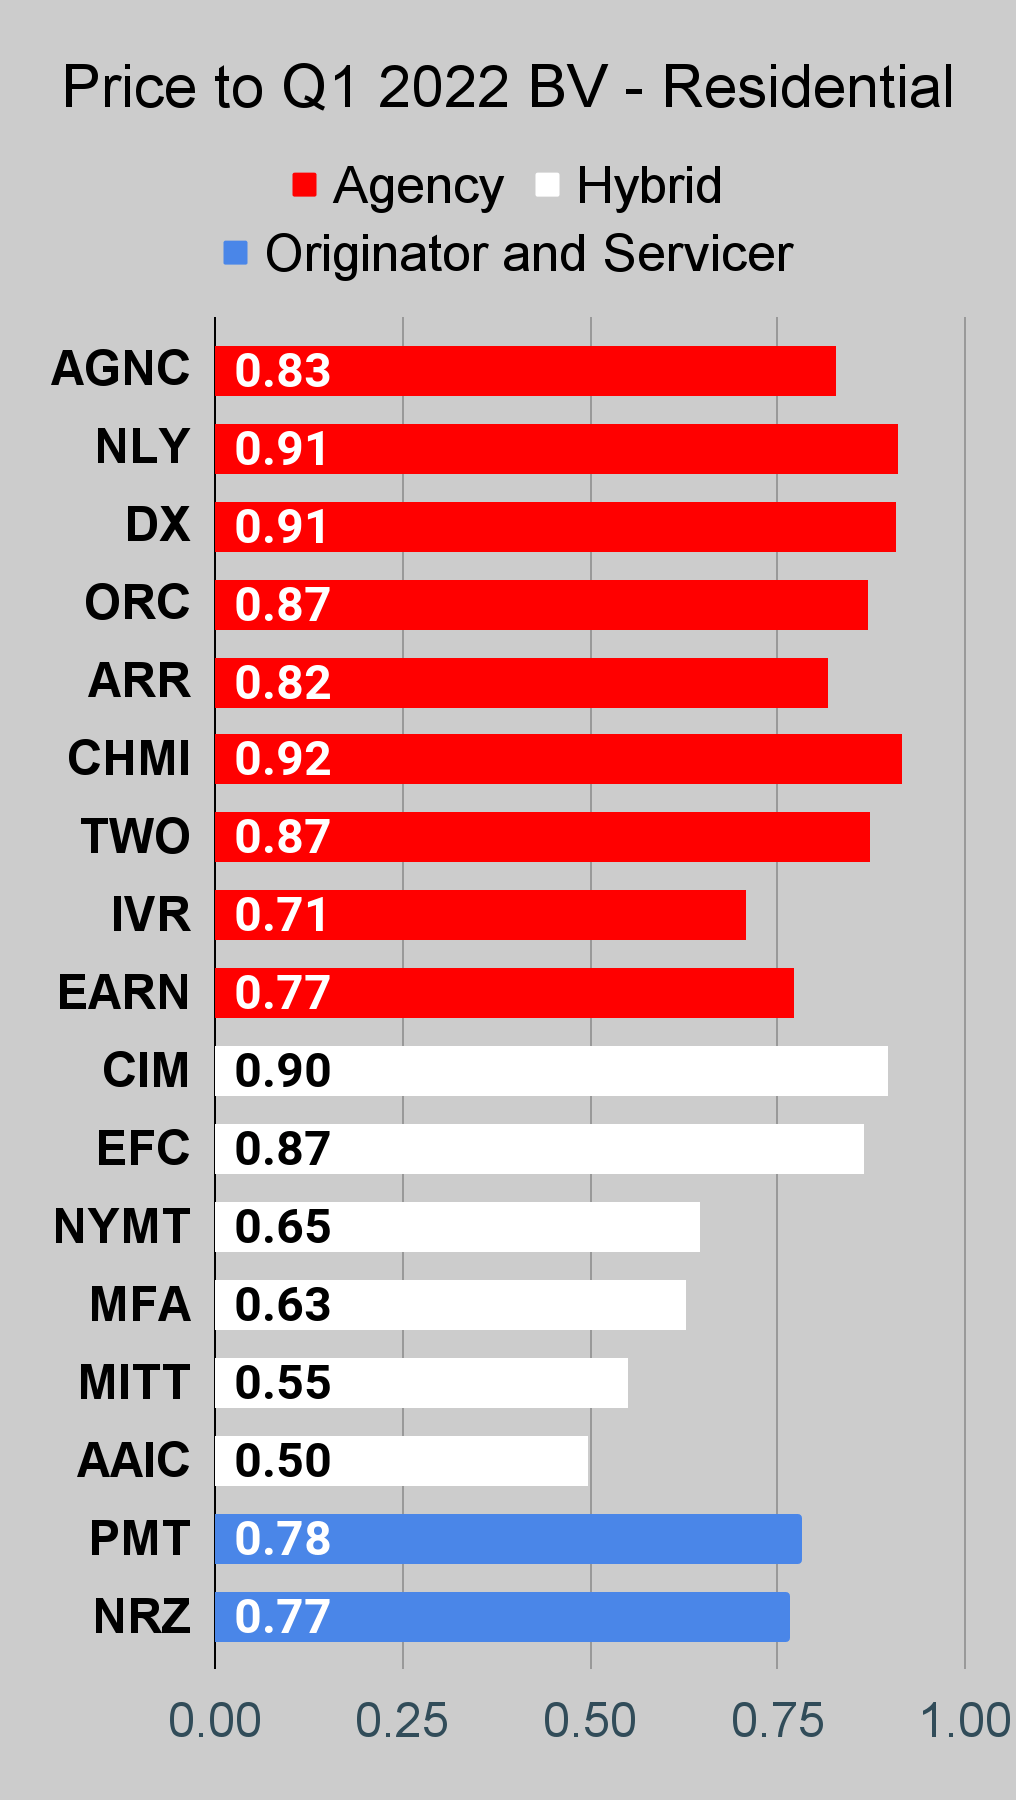
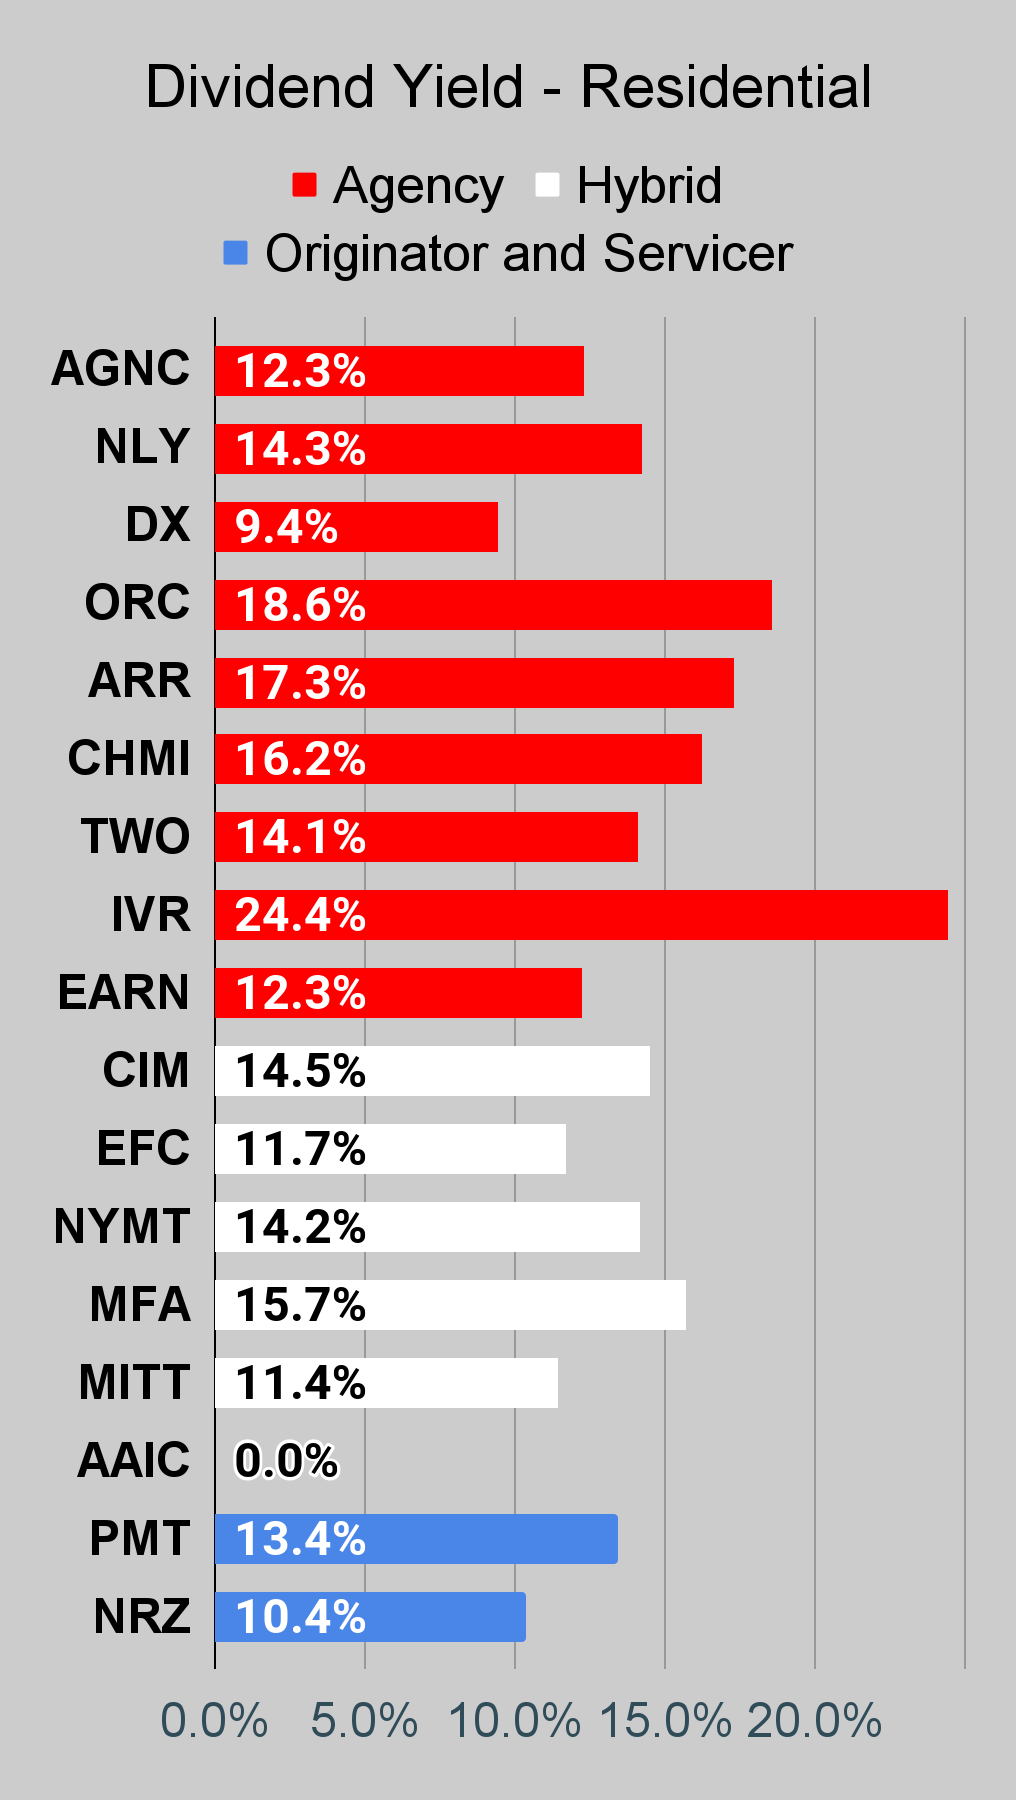
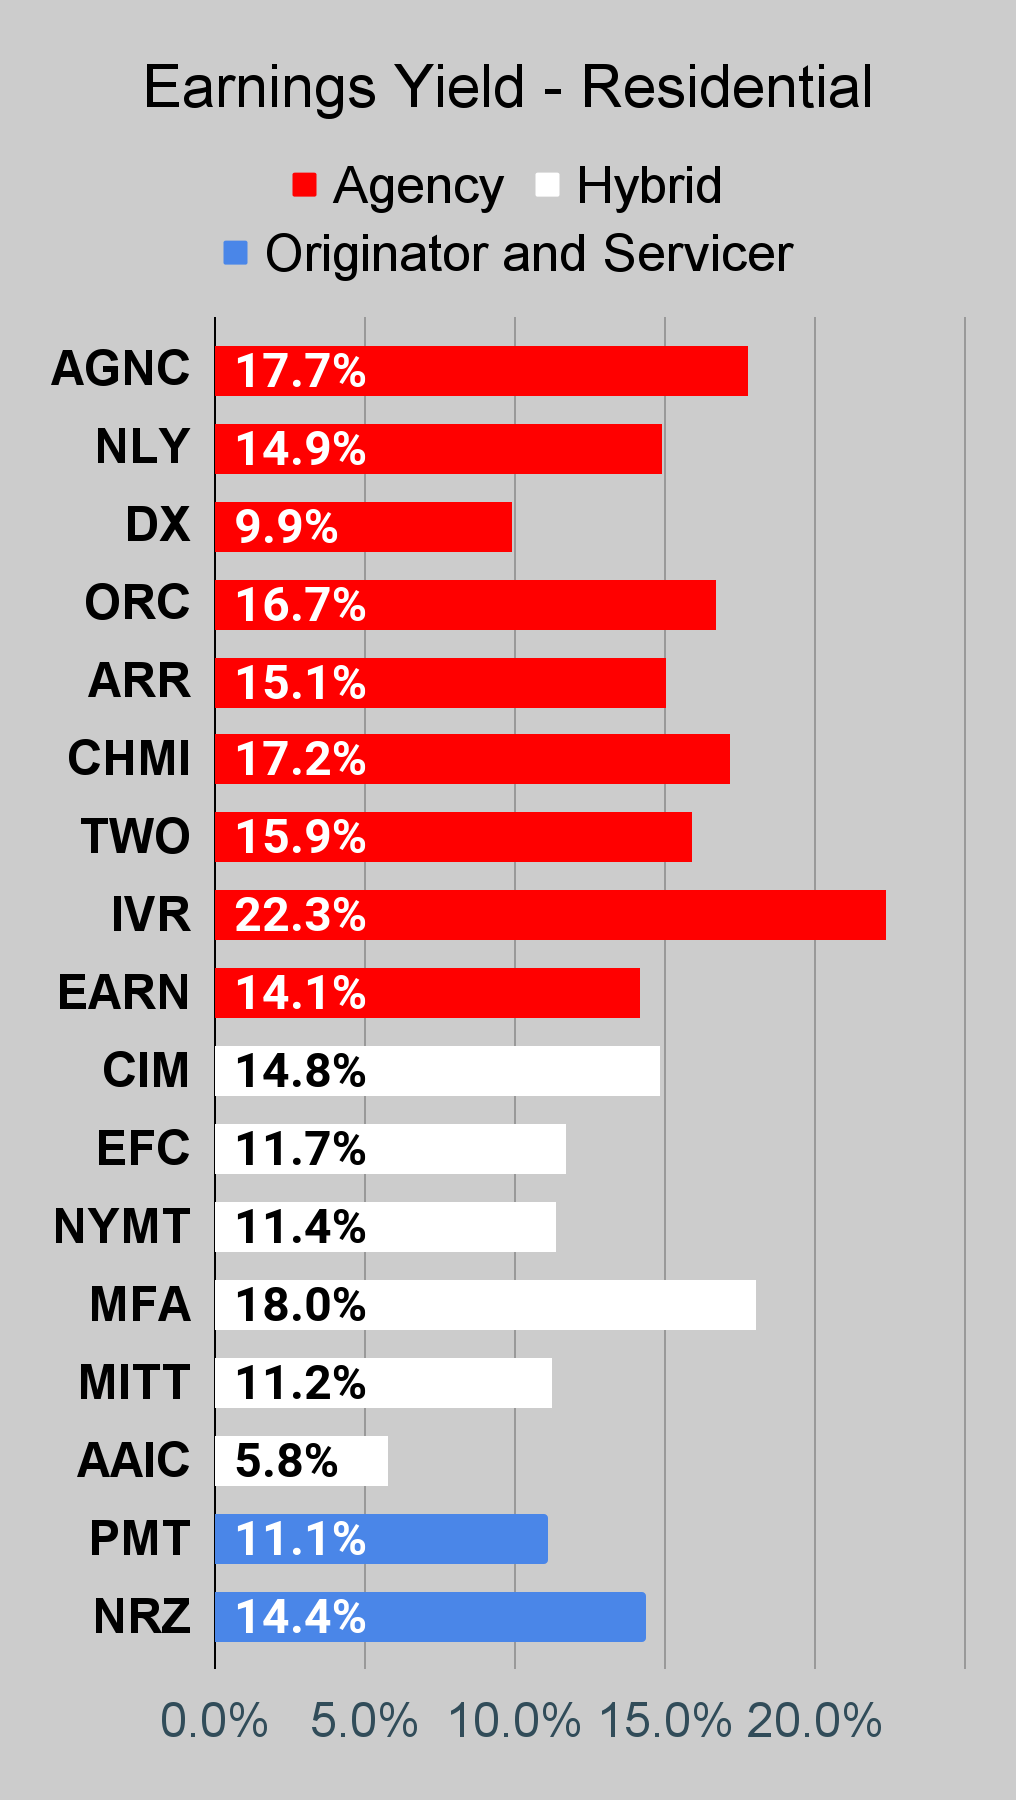
Residential Mortgage REIT Charts
Note: The chart for our public articles uses the book value per share from the latest earnings release. Current estimated book value per share is used in reaching our targets and trading decisions. It is available in our service, but those estimates are not included in the charts below.
 The REIT Forum |
 The REIT Forum |
 The REIT Forum |
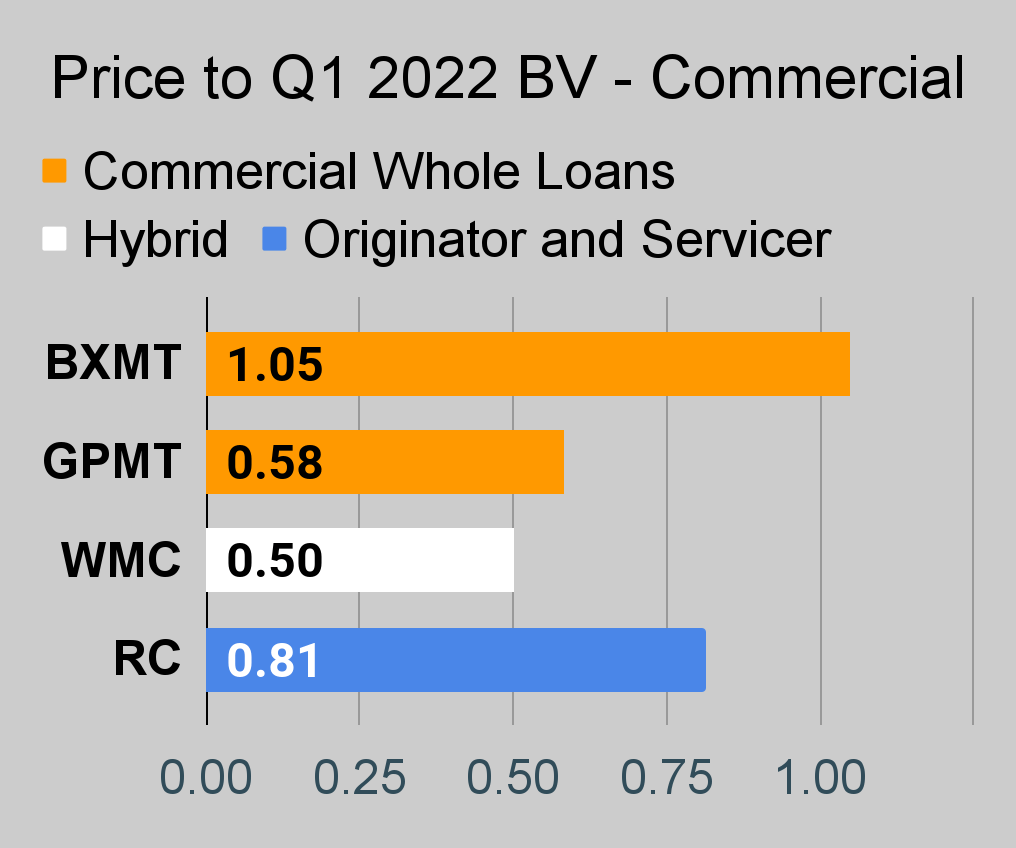
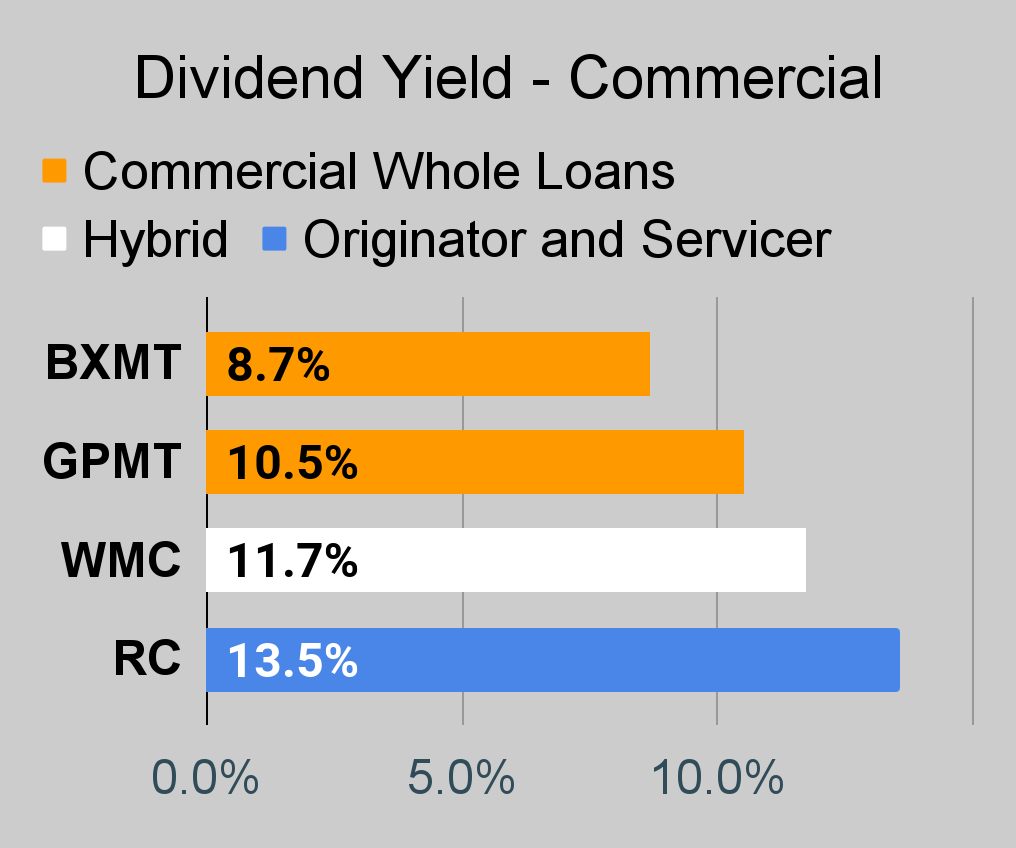
Commercial Mortgage REIT Charts
 The REIT Forum |
 The REIT Forum |
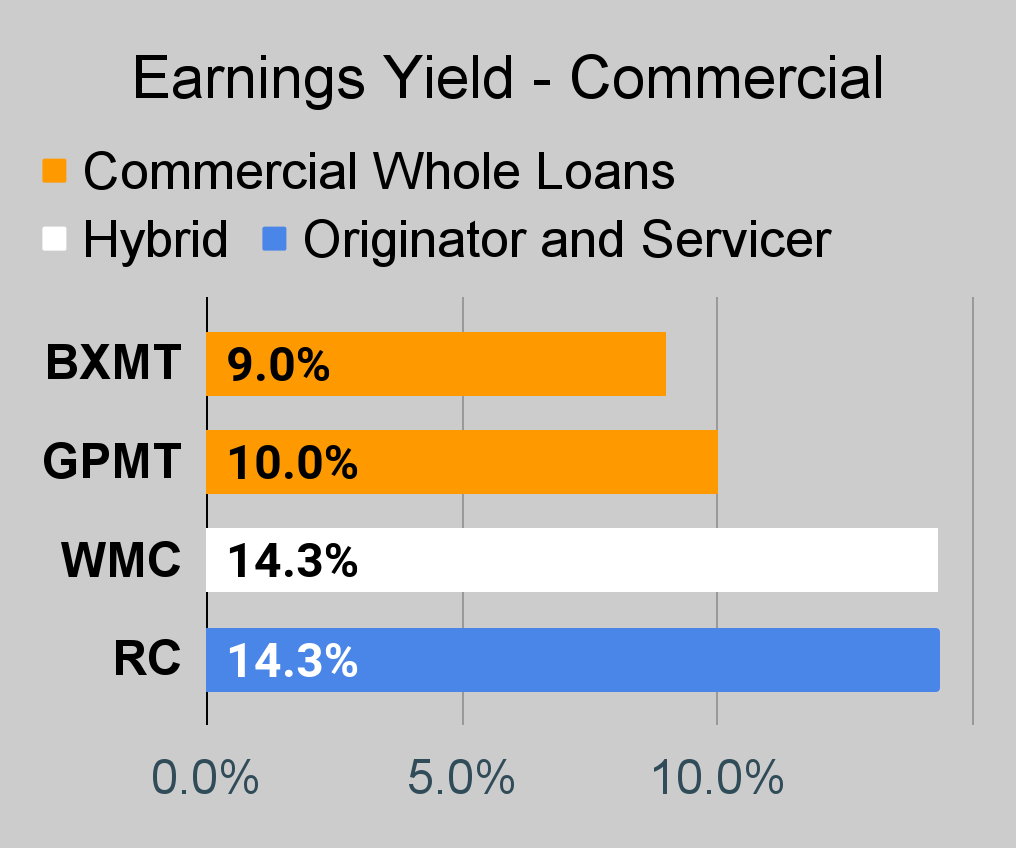 The REIT Forum |
BDC Charts
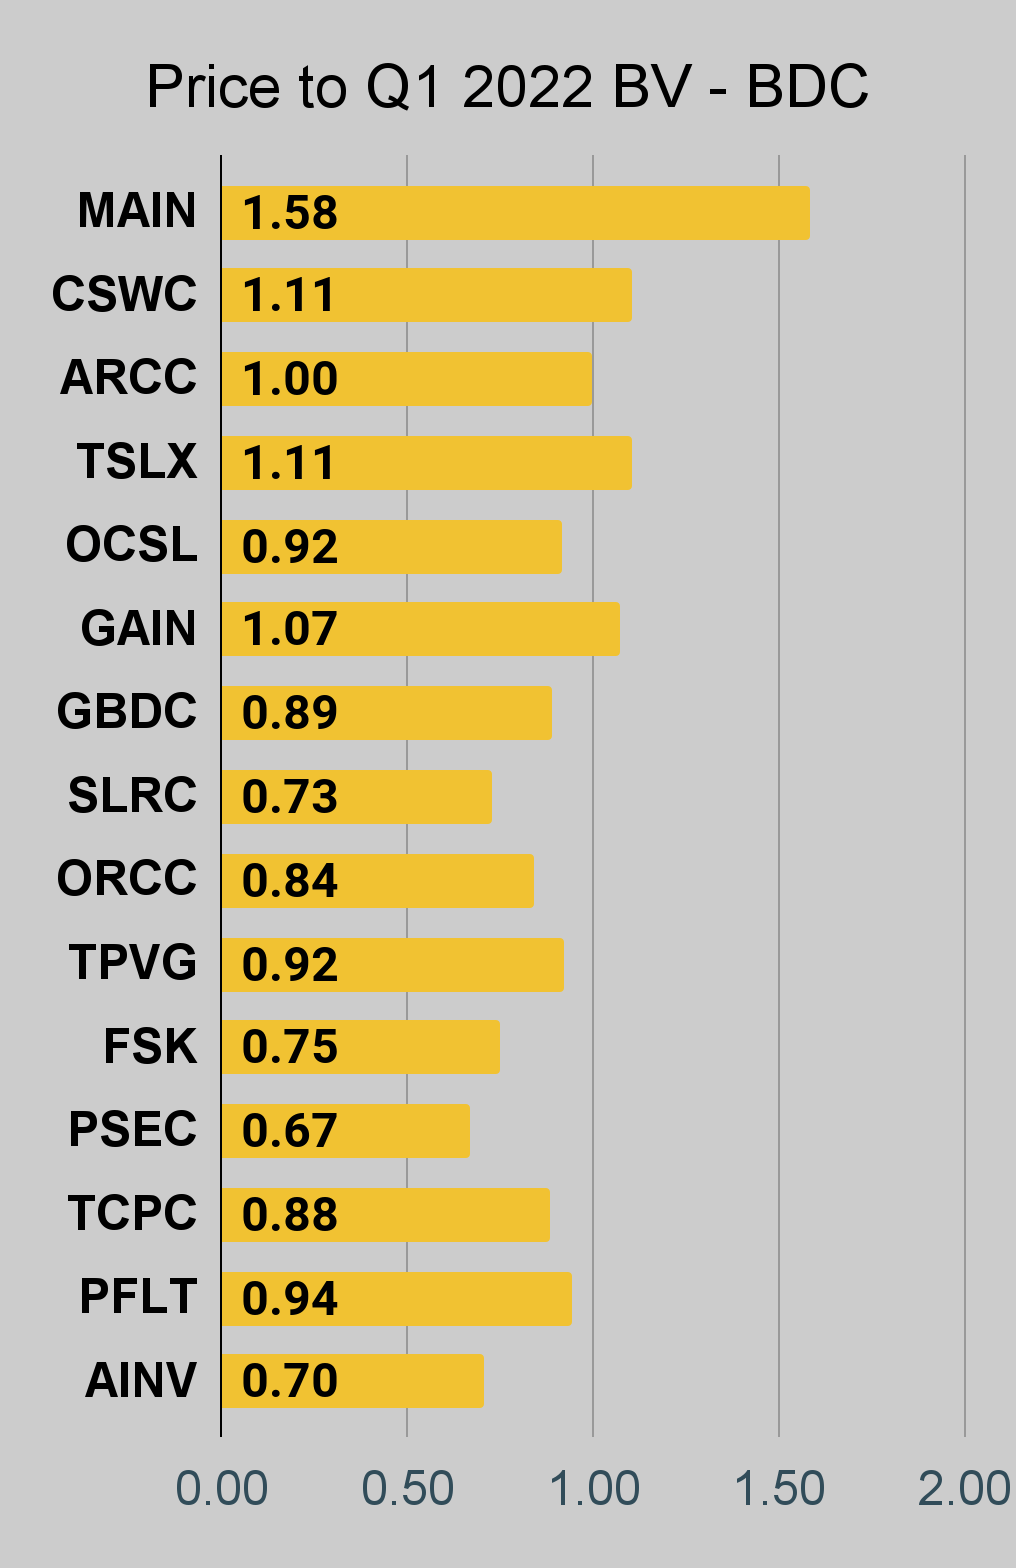 The REIT Forum |
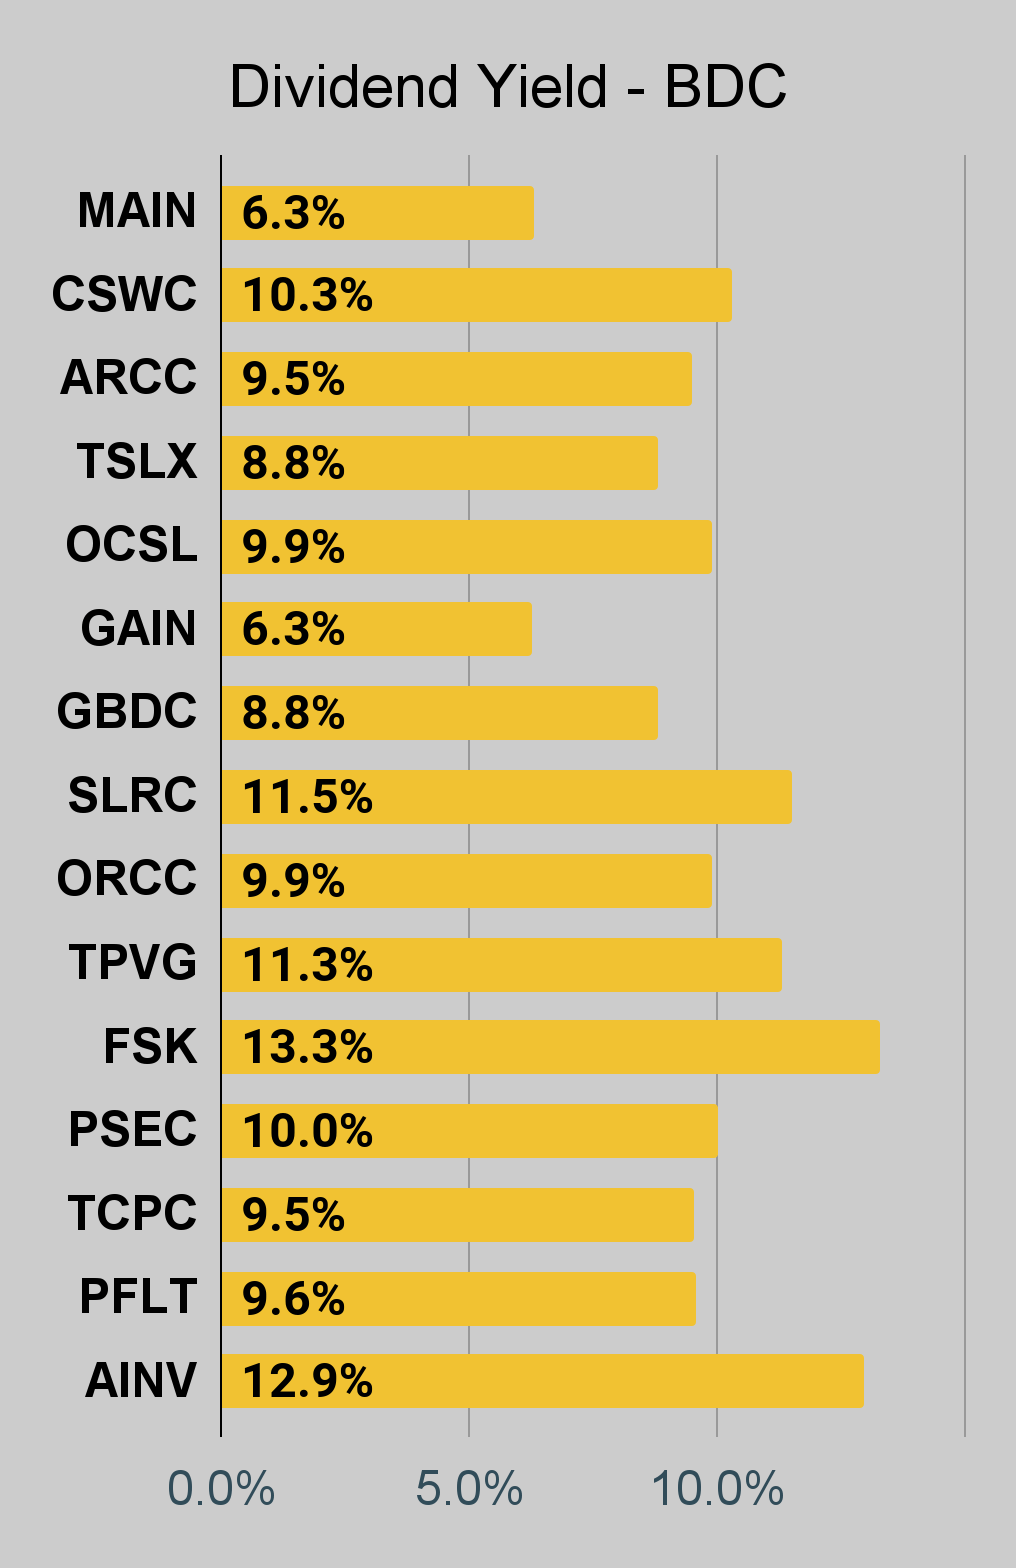 The REIT Forum |
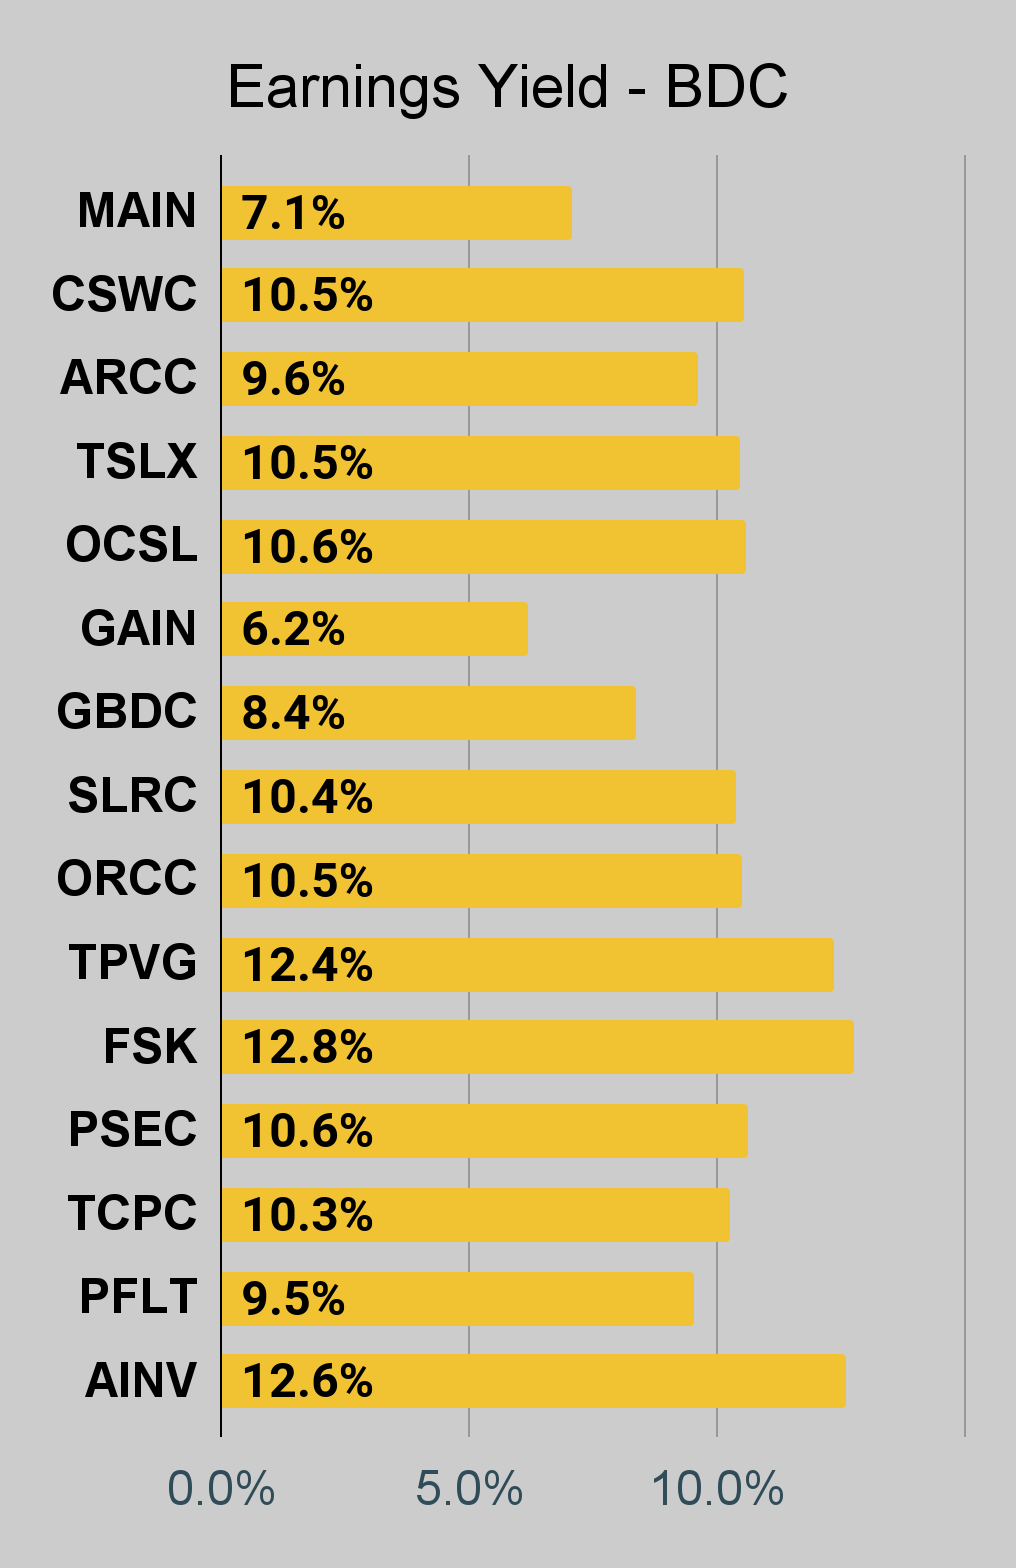 The REIT Forum |
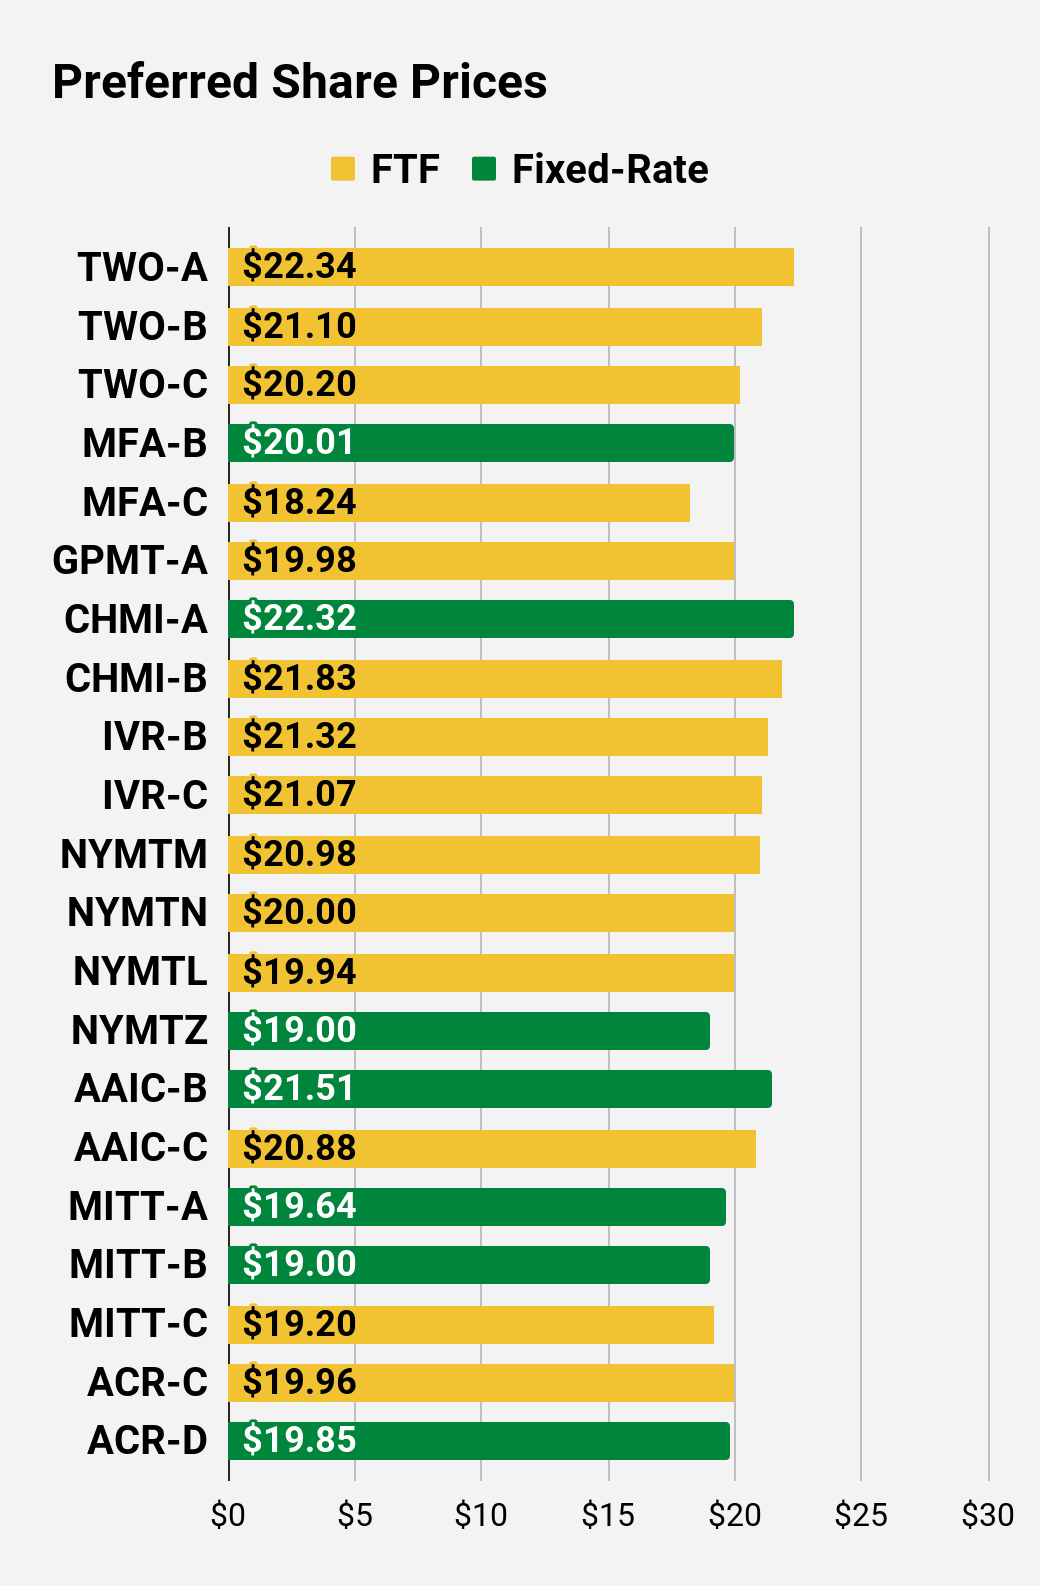
Preferred Share Charts
 The REIT Forum |
 The REIT Forum |
 The REIT Forum |
 The REIT Forum |
 The REIT Forum |
 The REIT Forum |
Preferred Share Data
Beyond the charts, we’re also providing our readers with access to several other metrics for the preferred shares.
After testing out a series on preferred shares, we decided to try merging it into the series on common shares. After all, we are still talking about positions in mortgage REITs. We don’t have any desire to cover preferred shares without cumulative dividends, so any preferred shares you see in our column will have cumulative dividends. You can verify that by using Quantum Online. We’ve included the links in the table below.
To better organize the table, we needed to abbreviate column names as follows:
- Price = Recent Share Price – Shown in Charts
- BoF = Bond or FTF (Fixed-to-Floating)
- S-Yield = Stripped Yield – Shown in Charts
- Coupon = Initial Fixed-Rate Coupon
- FYoP = Floating Yield on Price – Shown in Charts
- NCD = Next Call Date (the soonest shares could be called)
- Note: For all FTF issues, the floating rate would start on NCD.
- WCC = Worst Cash to Call (lowest net cash return possible from a call)
- QO Link = Link to Quantum Online Page
Second Batch:
Strategy
Our goal is to maximize total returns. We achieve those most effectively by including “trading” strategies. We regularly trade positions in the mortgage REIT common shares and BDCs because:
- Prices are inefficient.
- Long-term, share prices generally revolve around book value.
- Short-term, price-to-book ratios can deviate materially.
- Book value isn’t the only step in analysis, but it is the cornerstone.
We also allocate to preferred shares and equity REITs. We encourage buy-and-hold investors to consider using more preferred shares and equity REITs.
Performance
We compare our performance against 4 ETFs that investors might use for exposure to our sectors:
The REIT Forum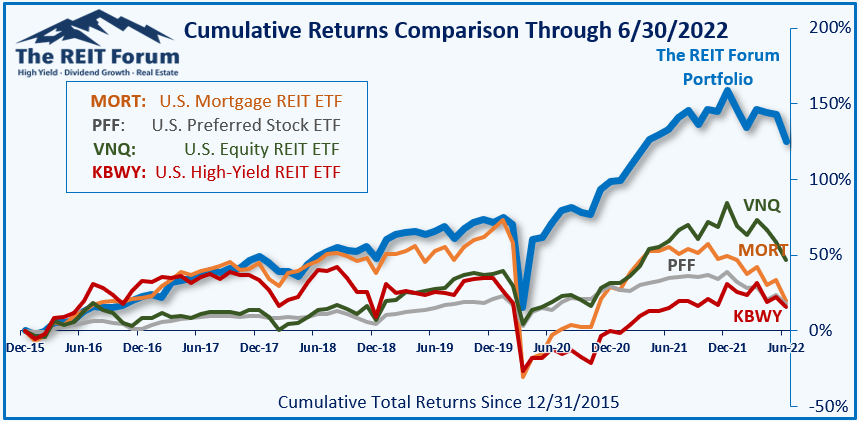
The 4 ETFs we use for comparison are:
|
Ticker |
Exposure |
|
One of the largest mortgage REIT ETFs |
|
|
One of the largest preferred share ETFs |
|
|
Largest equity REIT ETF |
|
|
The high-yield equity REIT ETF. Yes, it has been dreadful. |
When investors think it isn’t possible to earn solid returns in preferred shares or mortgage REITs, we politely disagree. The sector has plenty of opportunities, but investors still need to be wary of the risks. We can’t simply reach for yield and hope for the best. When it comes to common shares, we need to be even more vigilant to protect our principal by regularly watching prices and updating estimates for book value and price targets.
Ratings:
- Bullish on AGNCM and NLY-G. Between the two, slightly more bullish on AGNCM. Also bullish on AGNCN, AGNCO, AGNCP, NLY-F, and NLY-I. The discounts to our target prices are slightly different in each case, but each is attractive in isolation. Some are even more attractive on a relative basis.
Be the first to comment