

cokada/E+ via Getty Images
Investment thesis
Despite the fact that I considered LED and optical sensor manufacturer ams-OSRAM AG (OTCPK:AMSSY, OTCPK:AUKUF) as fundamentally undervalued and underscored the opportunities for long-term investors in my previous article, I want now to focus on the short-term risks and opportunities. The stock is technically in an extended downturn, and the poor performance of the past years, compared to its industry references, seems not likely to end anytime soon.
ams-OSRAM stock has broken every important support level, crashing under its pandemic level, and is now facing increasing selling pressure and relative weakness. Although it’s not unusual to see a short-term reversal forming in this kind of extended situation, I believe that a rebound would only be short-lived. The actual market conditions and the stock’s technical situation are not giving much space for a more significant rally. ams-OSRAM stock is not offering a safe entry point, and the risks are significantly higher than the short-term opportunities. This qualifies the stock as a hold position until better visibility suggests that a solid bottoming phase has begun.
A quick look at the big picture
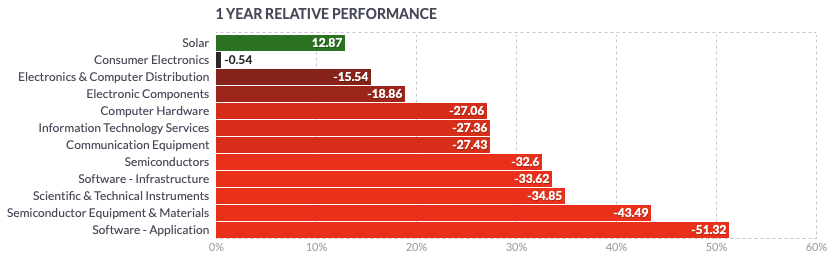
While the technology sector in the U.S. showed some sporadic relative strength after touching a low in June 2022, the sector has again turned into a loser in the last 3 months. It has been led by companies active in the electronics and computer distribution areas, computer hardware manufacturers, semiconductor equipment and materials as well as semiconductor manufacturers. Meanwhile, companies in the solar industry and consumer electronics manufacturers have performed better from a yearly perspective.
finviz finviz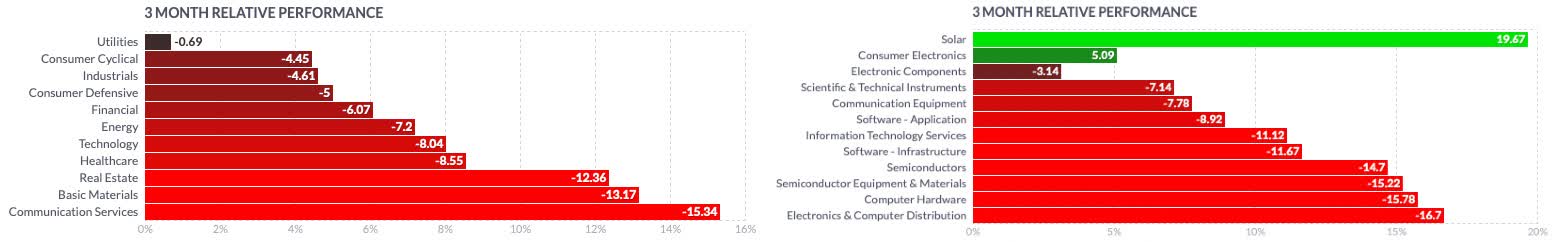
Looking at more specific industry groups, the VanEck Semiconductor ETF (SMH) marked its All-Time-High (ATH) on November 22, 2021, and has since severely corrected. It lost over 40% until bottoming on July 5, where it immediately reversed, gaining 30% over the next month. The industry reference failed in its attempt to break out over its EMA200, where it got rejected and has since retraced all its gains, even establishing a new low on September 23, 2022. The group looks greatly extended in its long-term downtrend while showing significant relative weakness when compared to the Vanguard Information Technology ETF (VGT). The coming sessions will show if those price levels will give space for a possible rebound or if new lows will be reached.
Author, using TradingView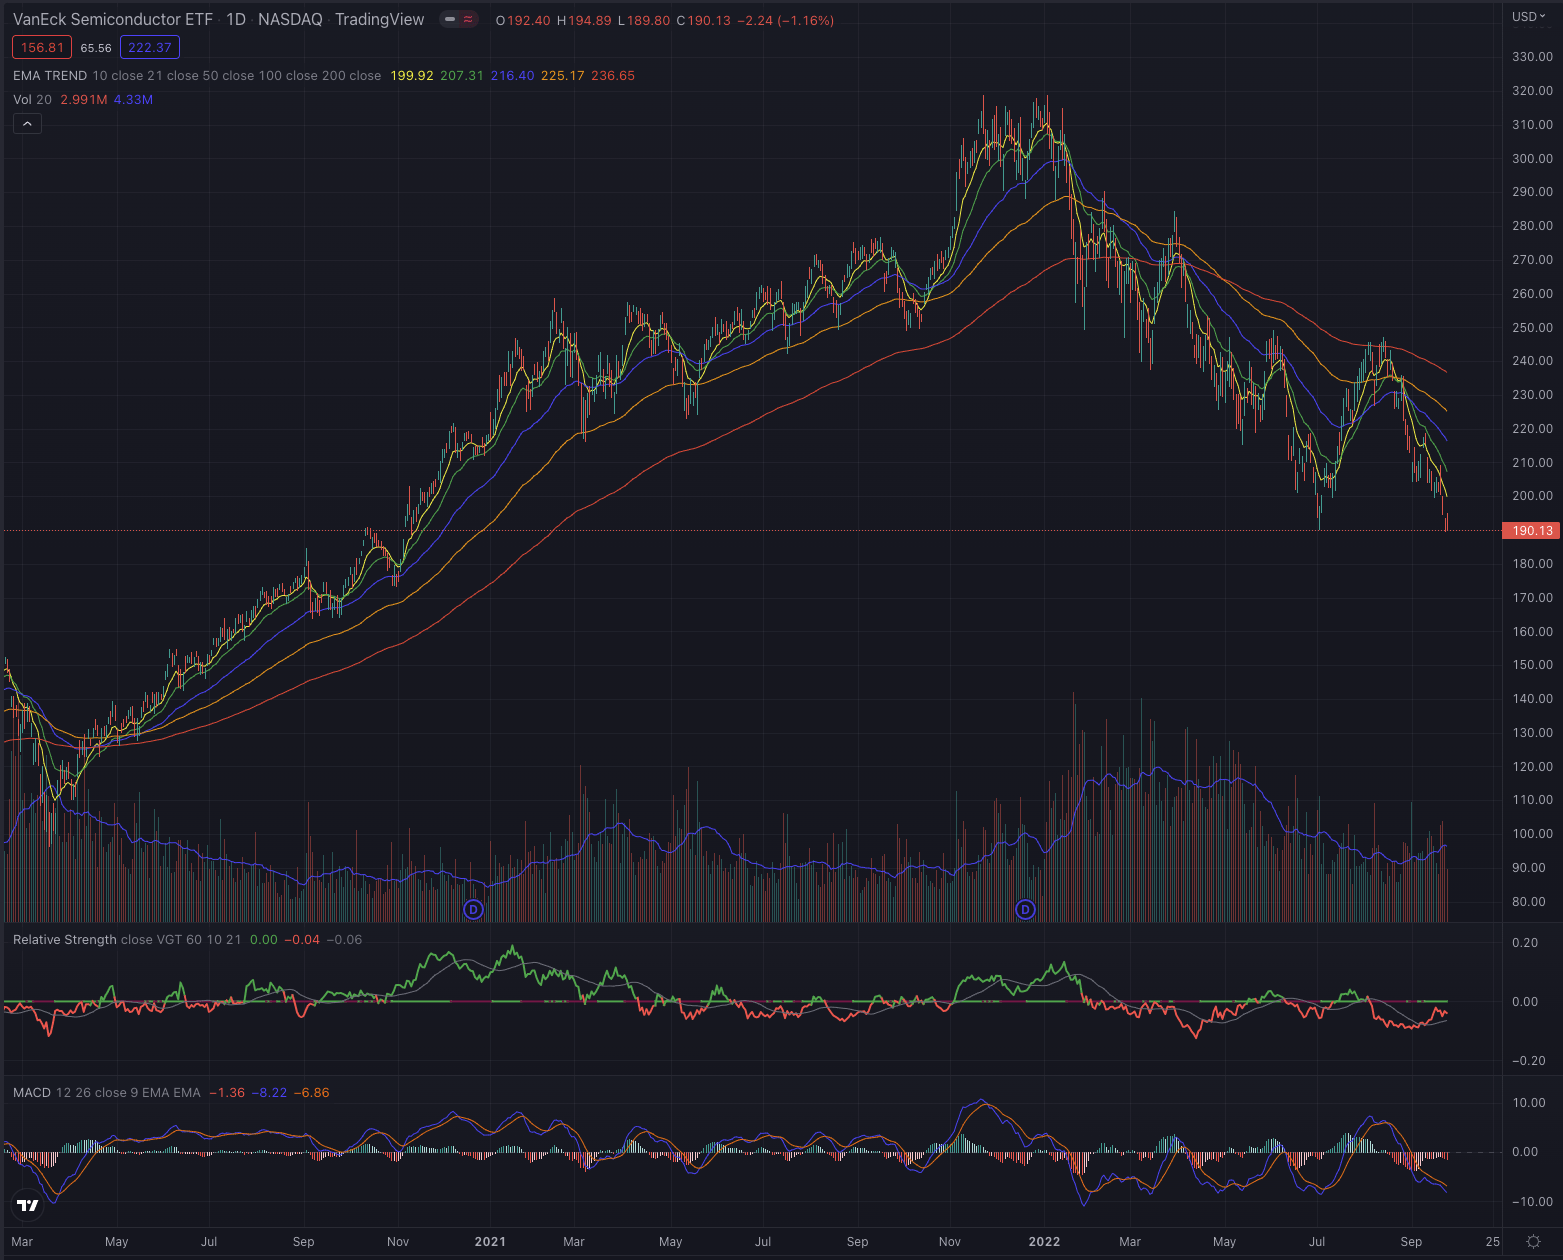
Looking back even further, ams-OSRAM performed significantly worse than its main references, reporting a loss of -89.26% in the past 5 years, while all its references greatly outperformed the stock. The Vanguard Information Technology ETF is leading this comparison with over 110% performance, while even the VanEck Semiconductor ETF has achieved a return of 106% during the analyzed time, underscoring the significant relative weakness of ams-OSRAM’s stock.
Author, using SeekingAlpha.com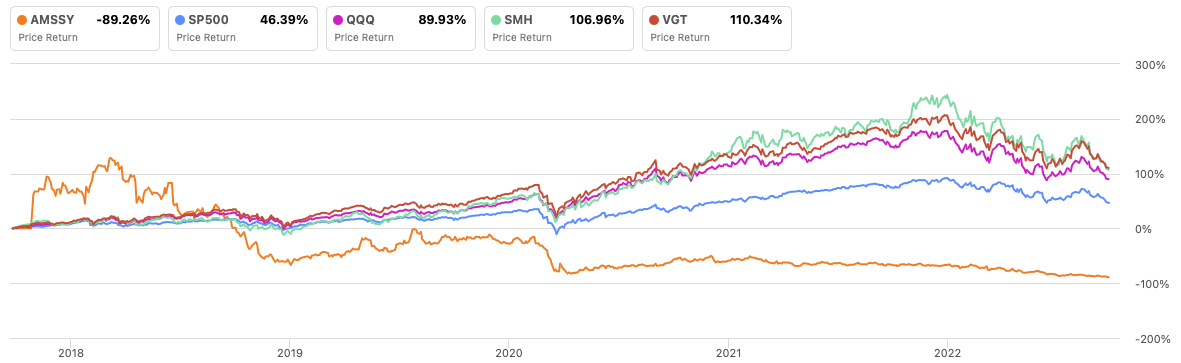
Where are we now?
In my last article, “ams-OSRAM Is A Victim Of Its Success,” published on April 6, 2022, I offered a more in-depth fundamental analysis on the company, as its valuation seemingly suggested an opportunity for long-term investors who believe in the CEO’s vision. On the other hand, I also mentioned the risks, and that technically the stock was still in an uncertain situation. The stock has since lost almost 50% of its value and continues to mark lower lows while every attempt to break out of its downtrend has been rejected by its short-term moving averages. The stock broke significantly under its pandemic low until it hit CHF 5.88 (or $2.98) and has built on extended relative weakness, which began in December 2020 and has recently deepened.
Author, using TradingView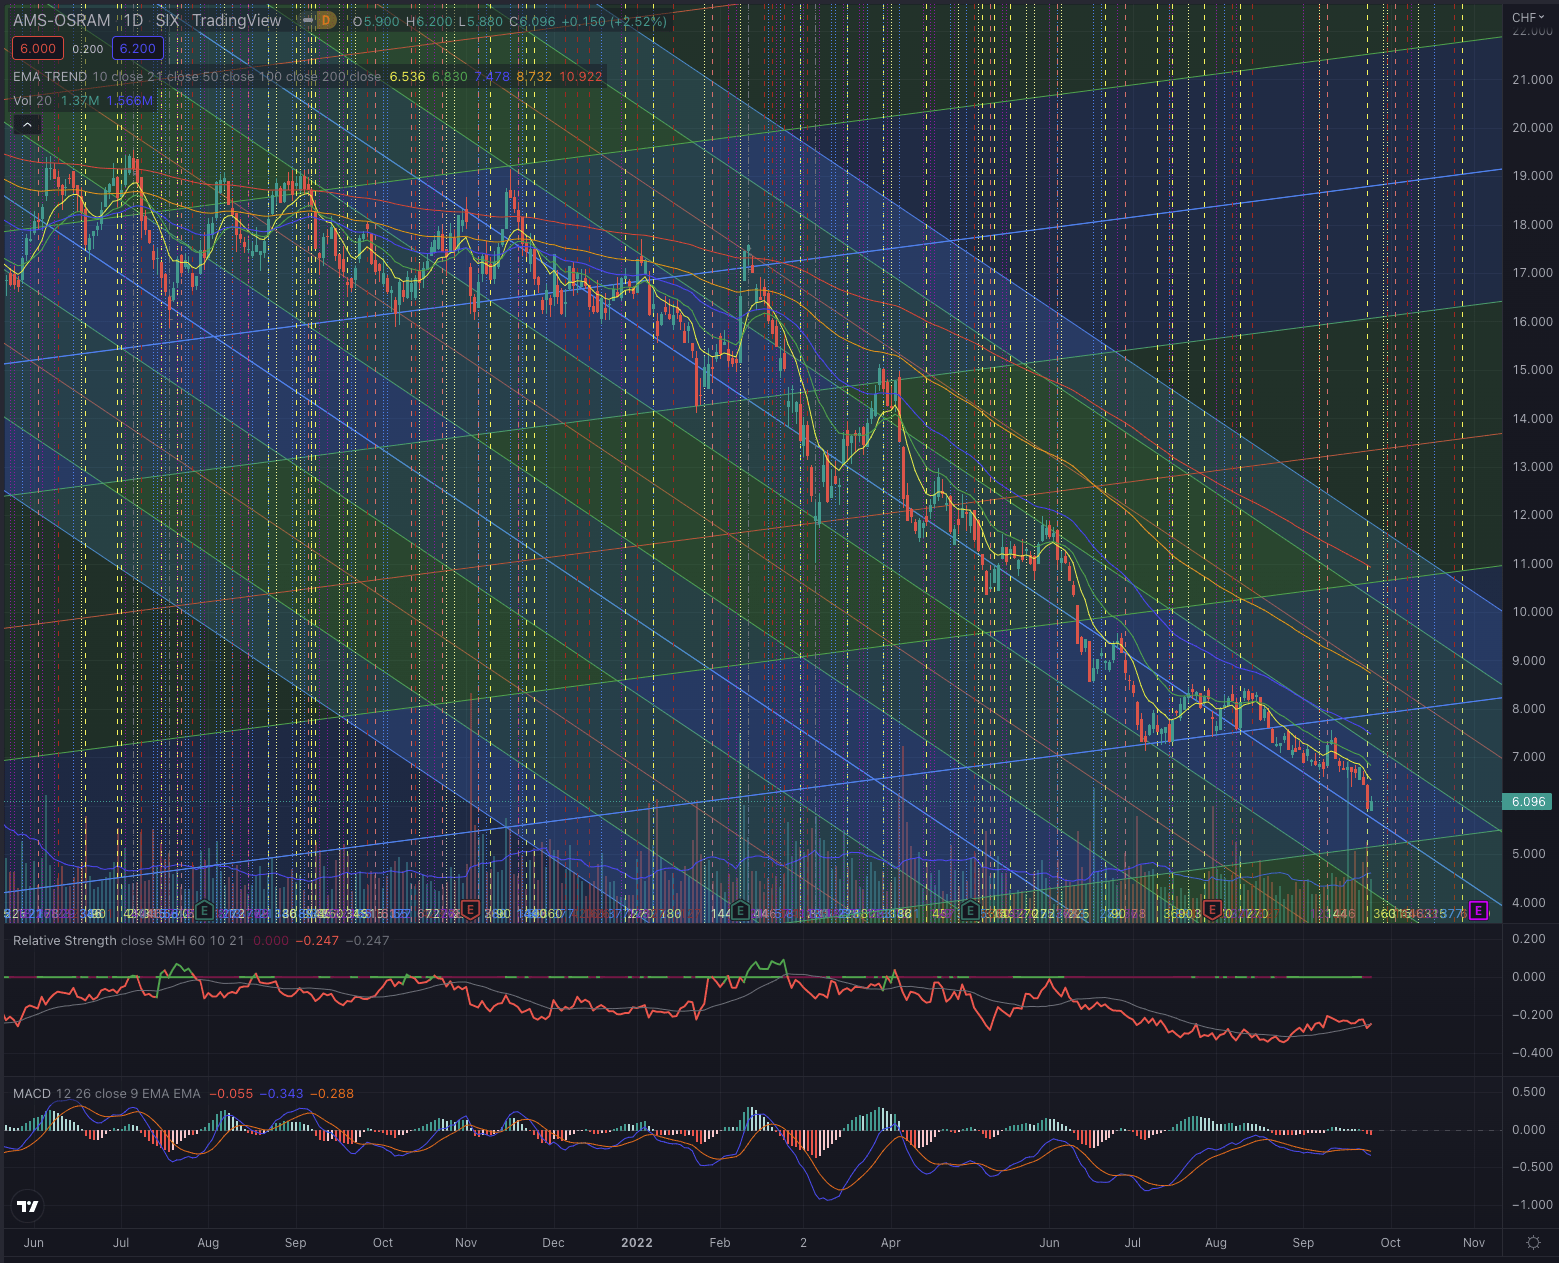
On its weekly chart, the painful decline is even more evidenced, as many weeks have been characterized by substantial selling volume and the stock never managed to ever overcome its EMA10. Every small retracement has been immediately sold off, with rare moments of stabilization attempts.
Author, using TradingView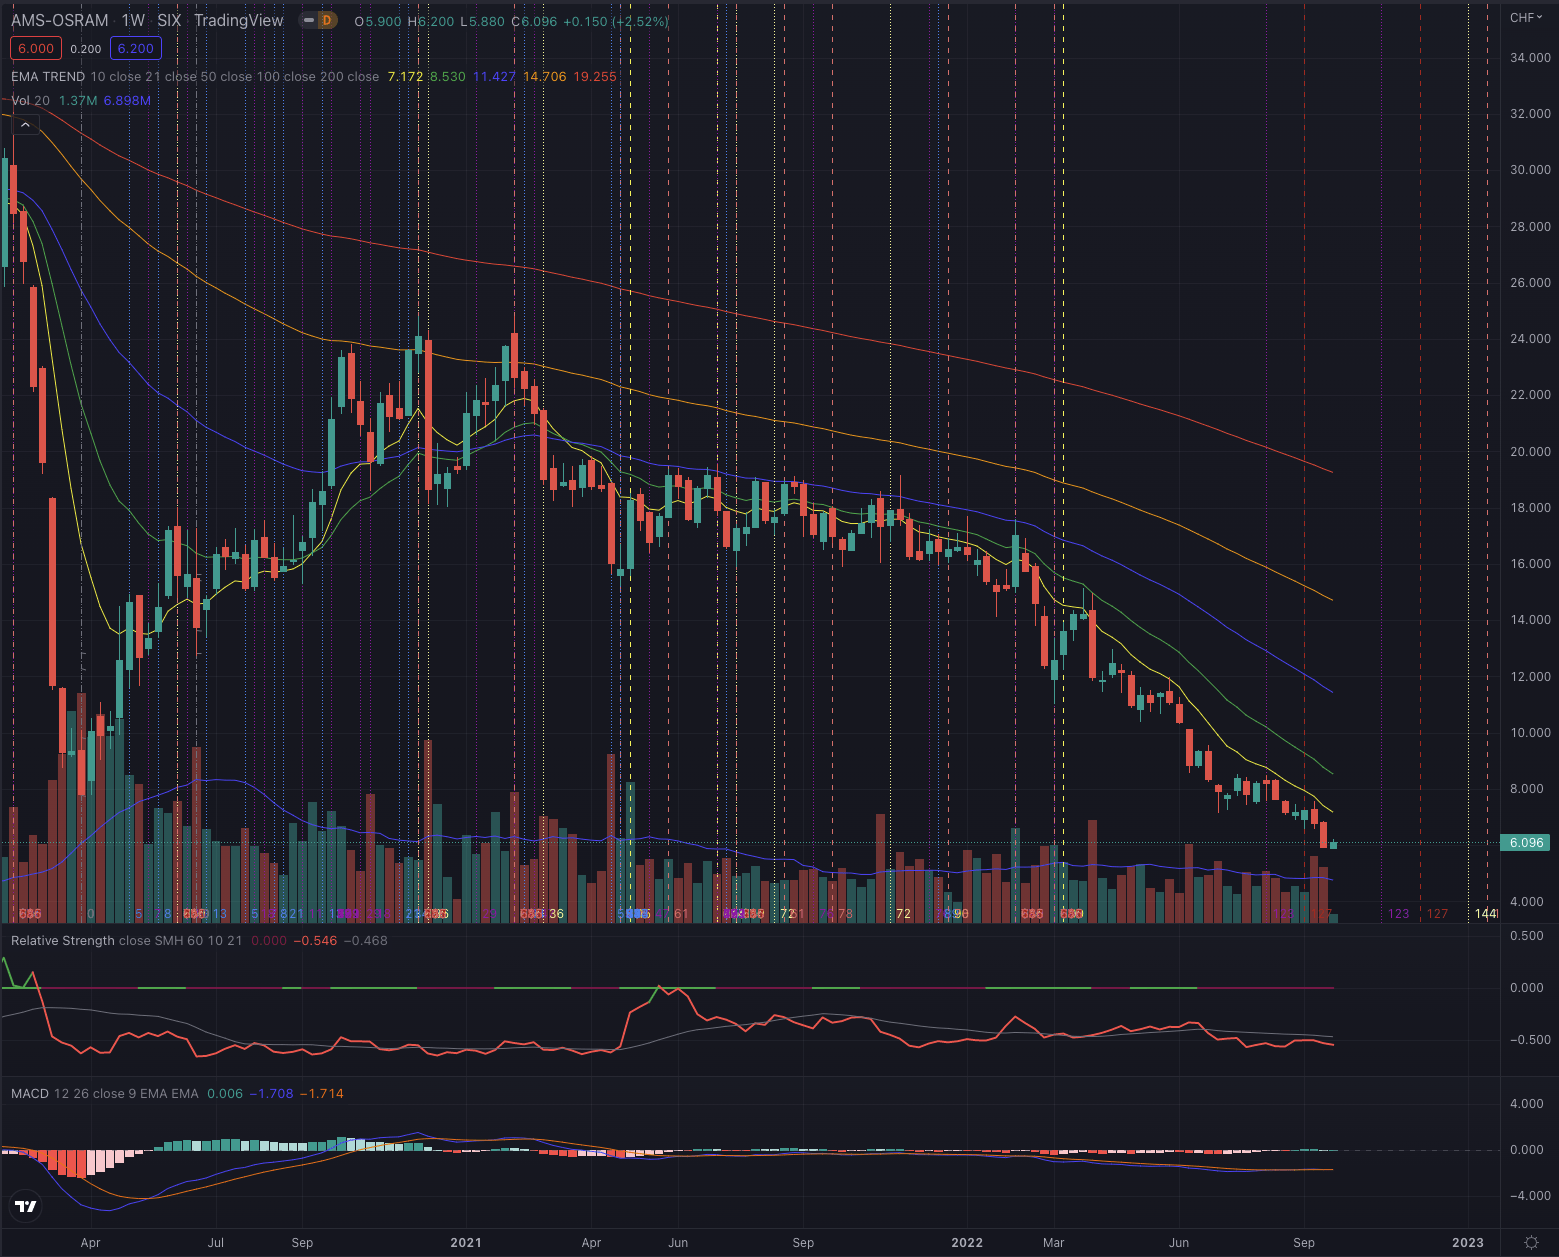
Technically, the stock is still in a very negative situation. It shows a negative momentum confirmed by its MACD, and increasing selling pressure in the past two weeks. The stock has very strong overhead resistance not only formed by its trailing moving averages, but also by the lows marked during the pandemic and more recently during its downtrend.
What is coming next
I expect ams-OSRAM AG stock to continue performing relatively negatively in the short term, as it seems that the bottom is still not hit, and all relevant indicators are suggesting that a possible turnaround is still out of sight. Sporadic short-term reversals cannot be excluded, as the stock seems excessively extended. With such strong overhead resistance, I would not expect those retracements to last long. The actual price levels have not been seen since 2012, hinting at the fact that management has practically destroyed more than 10 years of value creation for shareholders. Economically, it’s a disaster, and I wonder how the present leaders of the company can still justify their positions and very generous salaries when looking at the stock’s performance.
Author, using TradingView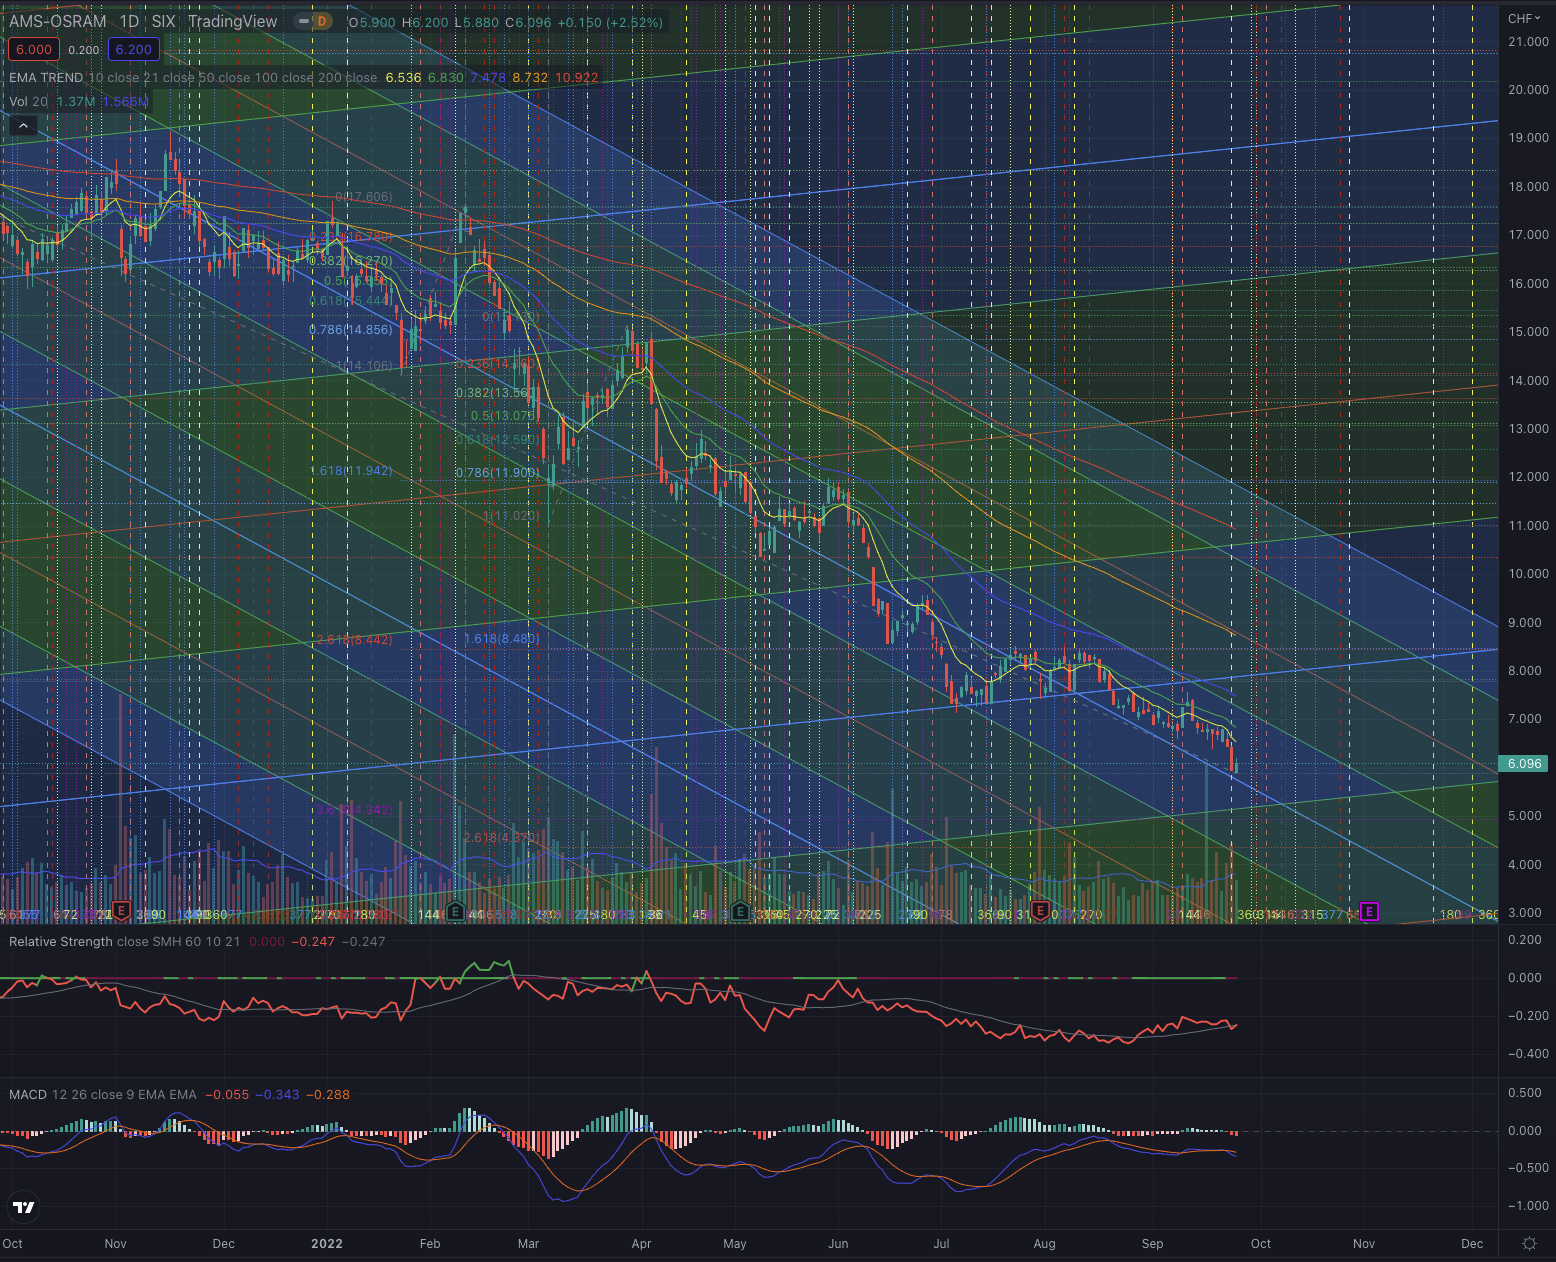
If the stock continues in its decline, the next most important price levels that could offer some support are seen around CHF 5.25 and CHF 5.00 (or approximately $2.60 and $2.45). The closest resistance levels are instead formed by its trailing moving averages, and further at CHF 7.80 (or $4.50) and around CHF 8.50 (or approximately $6), levels that would need strong conviction and substantial buy-side volume to overcome.
Investors should closely observe the price action and how the stock behaves at this crucial support level, and how an eventual attempt to overcome its resistance is confirmed or rejected, by particularly observing the trading volume in both directions. As the last few sessions showed, with a substantial spike in sell-side volume leading to new multiple-year lows, this could be the start of a short-term bottoming attempt, but it’s too early to make any conclusive statement in this sense. If the selling pressure continues, the stock could continue in its stubborn downtrend. If the stock instead manages to reverse and gains in positive momentum with stronger relative strength and increasing volume, I see a significant chance that it could attempt to test the ceiling of the downtrend channel and the EMA50, before trying to reach the previously mentioned short-term resistance levels. A breakout over its EMA200 will instead take a long time, as the stock is still clearly in stage 4, and would first need to build a sound base, by reducing its negative extension, before starting to form breakout attempts in the first stage of a new cycle.
The bottom line
Technical analysis is not an absolute instrument, but a way to increase investors’ success probabilities and a tool allowing them to be oriented in whatever security. One would not drive towards an unknown destination without consulting a map or using a GPS. I believe the same should be true when making investment decisions. I consider techniques based on the Elliott Wave Theory, as well as likely outcomes based on Fibonacci’s principles, by confirming the likelihood of an outcome contingent on time-based probabilities. The purpose of my technical analysis is to confirm or reject an entry point in the stock, by observing its sector and industry, and most of all its price action. I then analyze the situation of that stock and calculate likely outcomes based on the mentioned theories.
ams-OSRAM has many elements that indicate the stock is technically in a very difficult situation, despite concluding the company may be significantly undervalued fundamentally. In my previous article, I put the accent on more fundamental aspects, while here I purposely disclose my opinion based on technical analysis and address this article to more short-term traders.
From a technical perspective, the stock is not in a buy position as it is persistently in a downtrend and continuously forming lower lows. I, therefore, change my rating based on purely technical aspects and from a near-term perspective, as even by updating and becoming more pessimistic on the projections, my valuation model still offers significant upside potential based on the company fundamentals. Although a short-term rebound could form, the risk at this point overshadows the short-term opportunities as a strong reversal seems not likely in these market conditions and the bottoming process would take some time before forming a sound base from which to start a new significant uptrend.
Investors should be prepared for ongoing higher volatility for ams-OSRAM AG stock, by considering the risk of falling toward new lows, as the general market and particularly stocks in the technology sector and semiconductor industry are still quite exposed to unfavorable market conditions.
Be the first to comment