

iQoncept/iStock via Getty Images
Rose’s Income Garden “RIG”
RIG value, total return is up 1.66% ytd from November 14th when SPY was down 15.85%.
The chart below shows Energy is the clear winner this year with positive returns and it just keeps on rising.
RIG goals include owning 50% income from defensive sector stocks which just happen to have 3 out of 4 of the next top performers as shown on the chart. Healthcare is included. Unfortunately one of those supposedly defensive sectors, communication services, has done the worst, but that is another story for another time/ article.
S&P Sector Performance YTD (Charles Schwab, Bloomberg)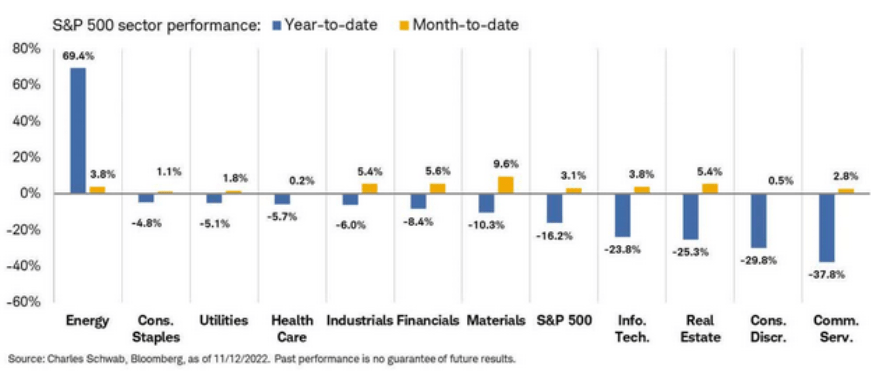
Returns for this month (appearing in yellow gold) show the materials sector is leading the way up with financials, along with industrials and real estate following.
Amgen (AMGN) is outperforming even those being up 6.3% for just these first few weeks in November and 14% over the last 30 days.
Amgen
Amgen develops, discovers and manufactures human therapeutics worldwide and is generally called “biotech” healthcare by nature. It incorporated in 1980 and is headquartered in Thousand Oaks, CA with over 14,000 employees and a 152 billion market cap.
Below is a Yahoo Finance chart today showing its 1 month performance.
Last 30 days price action for AMGN (Yahoo Finance)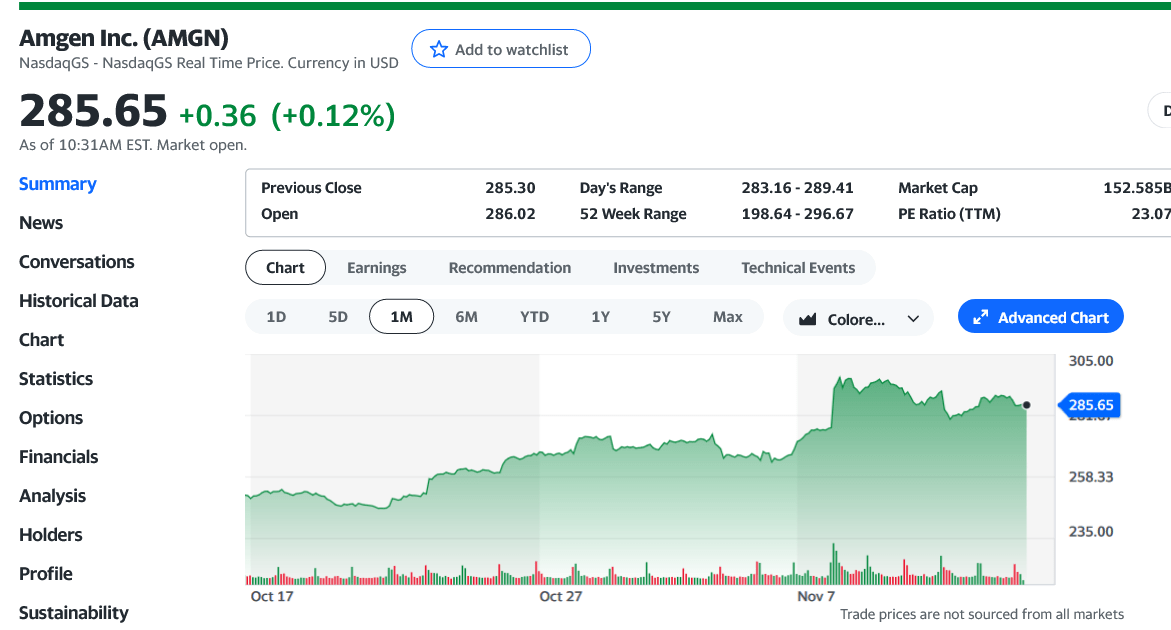
Yahoo Finance 23 analysts suggest an average price target of $265. The range is $180 to $325.
Value Line analysts suggest a price range of $198 to $294 for the next 18 months. It has a safety rating of #1, which is the safest.
Amgen FASTgraph
The first FASTgraph “FG” chart below from the Chuck Carnevale service, shows 5 years of earnings plus 2 years of estimates (dotted lines). The second chart is for normal price/earnings levels:
Amgen Earnings and Price graph (FASTgraphs by Chuck Carnevale) Amgen normal P/E movement (FASTgraphs C Carnevale)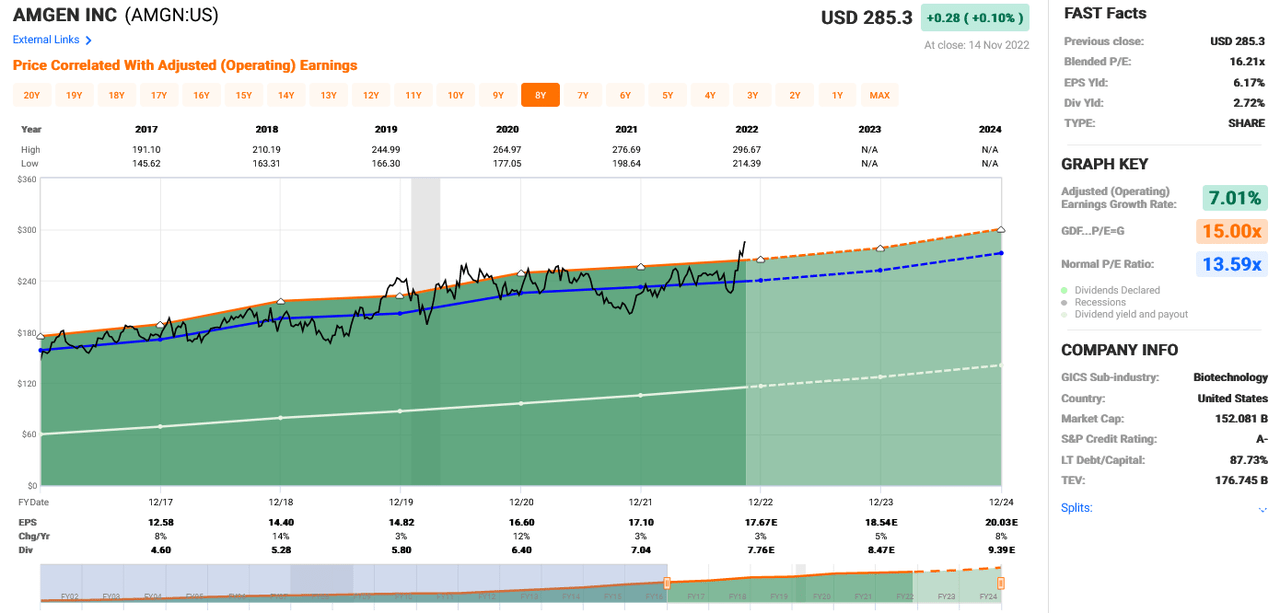
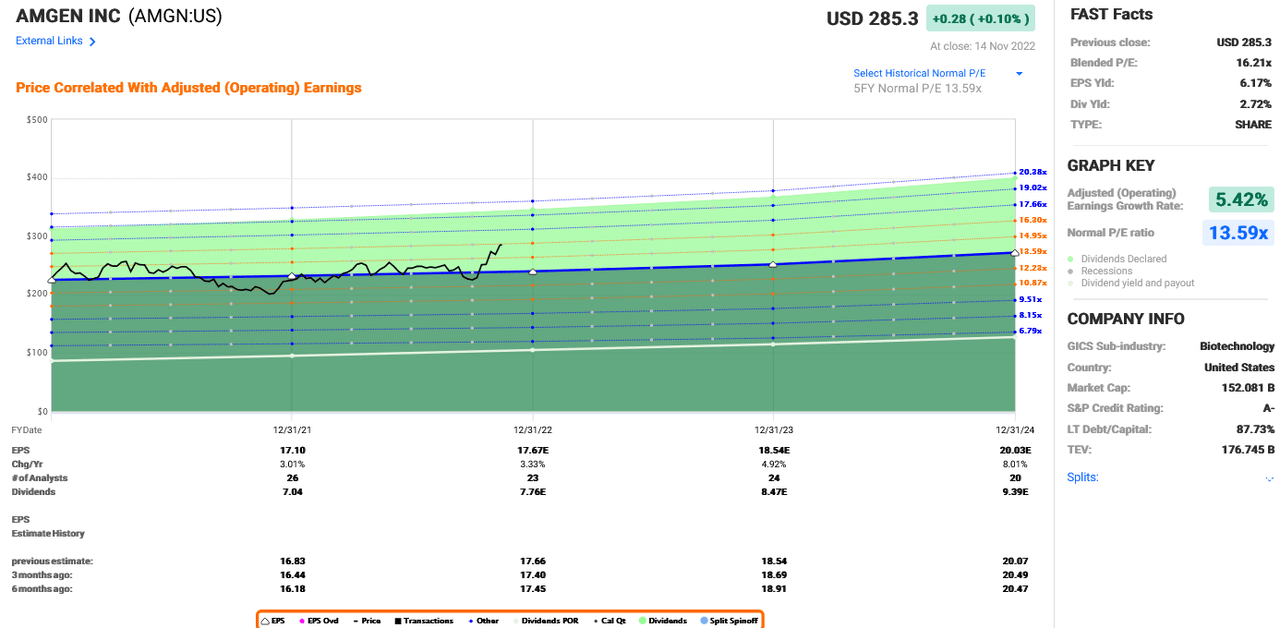
The black line on the chart is the price which is noted as $285.30 at the top. Blue line corresponds to the normal P/E of 13.6x as mentioned in the blue data on the right. It is hitting near an all time high valuation at a 16.2x P/E now.
Amgen started paying a dividend, as shown by the white line, in 2011 and has a 33% dividend growth rate for the last 10 years, but it has slowed to 12% average for the last 5 years. Last year’s raise was 10% and the FG is suggesting that again for 2023 and even into 2024. The next raise is due starting in 2023 for payment in March. The estimates are just that and nothing is ever for sure, but I do like its earnings possibilities as well as that excellent rising dividend rate.
Summary/Conclusion
RIG bought Amgen in November 2021 at $206.08 and has owned it now for 1 year. Its up 38.8% in RIG, which is quite the achievement for this market. I see it as one heck of a quality company that is selling for its price target out 18 months, for good reason along with that rising dividend record. No one owning it will be disappointed and it is for sure a hold if you do. I would suggest waiting for another pull back/ dip in this market to purchase it, but it is one to own for sure. When the next dividend payment is announced, I bet you see this one rise in price perhaps even more.
The Macro Trading Factory, run by The Macro Trader, is also outperforming SPY but by a lot more or 21.17% and is up and seeing green by 6.5% today.
Happy Investing All!
Macro Trading Factory is a macro-driven service, run by a team of experienced investment managers.
The service offers two portfolios: “Funds Macro Portfolio” & “Rose’s Income Garden”; both aim to outperform the SPY on a risk-adjusted basis, in a relaxed manner.
Suitable for those who either have little time/knowledge/desire to manage a portfolio on their own, and/or wish to get exposed to the market in a simple, though more risk-oriented (less volatile), way.
Each of our portfolios, spanning across all sectors, offers you a hassle-free, easy to understand and execute, solution.
Be the first to comment