

DarioGaona
It’s been a rough year for the Silver Miners Index (SIL), which has suffered a 23% year-to-date decline, even underperforming the S&P 500 (SPY), which is on track for its worst year in over a decade. However, investors in both indexes can take solace in that they have hopefully steered clear of Americas Gold and Silver (NYSE:USAS), a stock that has lost over 80% of its value the past two years and that’s measuring from the height of its recent rally. The performance shouldn’t be surprising, with the ‘transformative’ Relief Canyon Mine being a massive disappointment and share dilution being a regular occurrence.
Fortunately, the stock has staged a relief rally over the past couple of months with a backdrop of rising silver prices, erasing much of its year-to-date losses and possibly luring some investors into the stock. However, little has changed to justify the recent rally, and the company is on track for another year of double-digit share dilution, the one area where the team has been consistent over the past few years. So, with a poor track record of delivering on promises, a weak balance sheet, and margins pressured due to a pullback in base metals prices, I continue to see Americas Gold and Silver (AG&S) as an inferior way to play the sector.
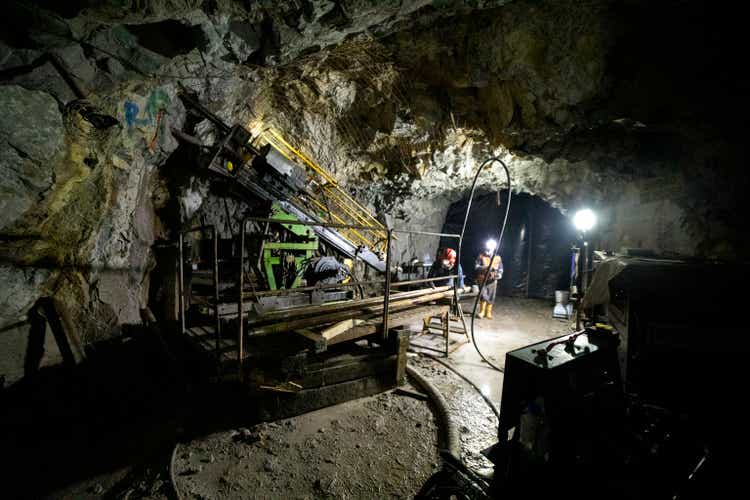
Galena Operations (Company Presentation)
Q3 Results
AG&S released its Q3 results last month, reporting quarterly production of ~331,000 ounces of silver, ~9.4 million pounds of zinc, and ~5.9 million pounds of lead (~1.34 million silver-equivalent ounces). This represented a sharp increase from the year-ago period when the company’s Cosala Operations were temporarily suspended and similar production levels to its most recent quarter. However, the company saw a significant decline in margins with a drop in silver and base metals prices, with the latter reducing its by-product credits and leading to a spike in all-in-sustaining costs [AISC]. Let’s take a closer look below:
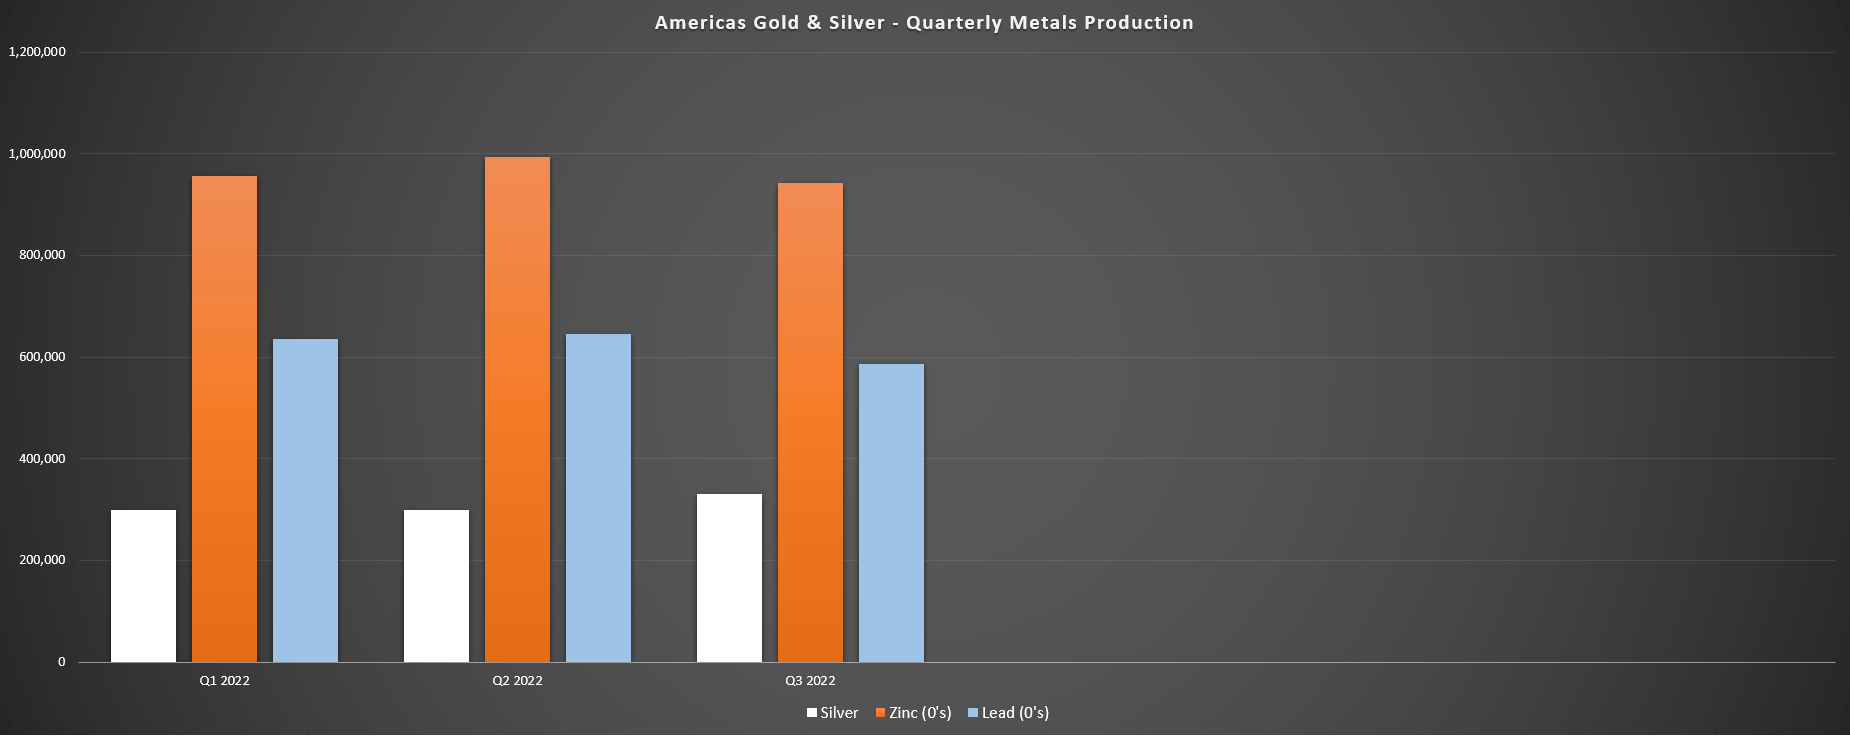
AG&S – Quarterly Metals Production (Company Filings, Author’s Chart)
As shown in the chart above, AG&S has seen a steady ramp-up in silver production as the year has progressed, with production up over 10% vs. Q1 2022 levels (re-opening ceremony at Cosala) despite a focus on mining high-grade zinc areas to maximize cash flow. During Q3, the asset produced ~186,000 ounces of silver, ~9.4 million pounds of zinc, and ~3.77 million pounds of lead (~1.09 million silver-equivalent ounces) at a respectable AISC of $4.35/oz. However, these figures were up sharply from Q2 2022 levels. The company noted that the focus going forward would be on developing and increasing production from the Upper Zone, which carries higher grades than the Main Zone.
While the cost performance at Cosala was decent relative to the industry average, it’s worth noting that this is a relatively small mine on a silver production basis, yielding barely 600,000 ounces of silver per annum at the current run rate even if it is low cost relative to other Mexican operations. In addition, while costs were low, we saw a material jump sequentially ($4.35/oz vs. [-] $25.89/oz) due to the reduced by-product credits. This was primarily related to lower base metals prices. The one benefit to Cosala’s negative AISC is that they’ve helped mask extremely high costs at its Galena Complex in Idaho. So, with Cosala’s costs jumping in Q3, it’s no surprise that AG&S’ consolidated costs tripled in the period.
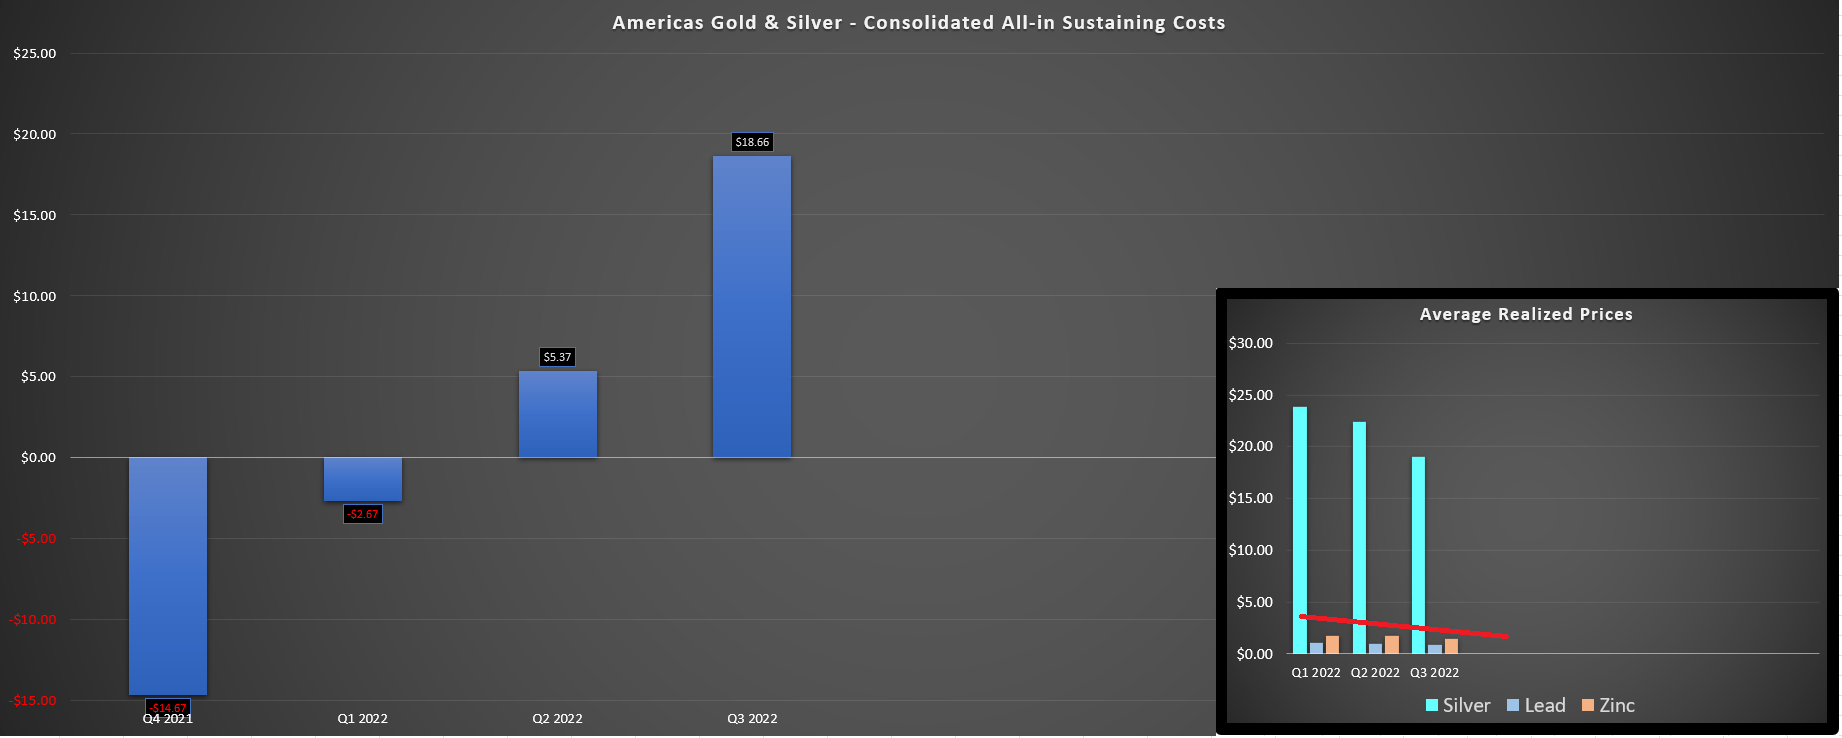
AG&S – Consolidated AISC & Average Realized Metals Prices (Company Filings, Author’s Chart)
Moving over to the Galena Complex, AG&S saw attributable production of ~145,000 ounces of silver and ~2.1 million pounds of lead in Q3, a sharp decline from Q2 2022 levels (~171,400 ounces of silver and ~2.53 million pounds of lead). This was related to fewer tonnes processed, lower silver and lead grades, and lower recovery rates. AG&S noted that silver production was impacted by the poor quality of cemented backfill, which required remedial work on affected stopes (since completed). The good news is that production should improve in Q4 due to production from higher-grade silver stopes.
As some might be aware, Galena is a very high-cost operation, reporting AISC of $28.67/oz in Q2 2022 and $27.55/oz in H1-2022. However, with lower sales volumes and weaker base metals prices, costs spiked to $37.00/oz in Q3 2022, a nearly 30% increase sequentially and nearly double the company’s average realized silver price of $19.07/oz. Unfortunately, this led to consolidated AISC margins of just $0.41/oz in the period vs. $17.08/oz in Q2 2022. Not surprisingly, this led to a cash outflow of $6.7 million in the period combined with increased capex on its replacement Galena Hoist, resulting in AG&S ending the period with just over $2.0 million in cash and a negative working capital position ($16.7 million).
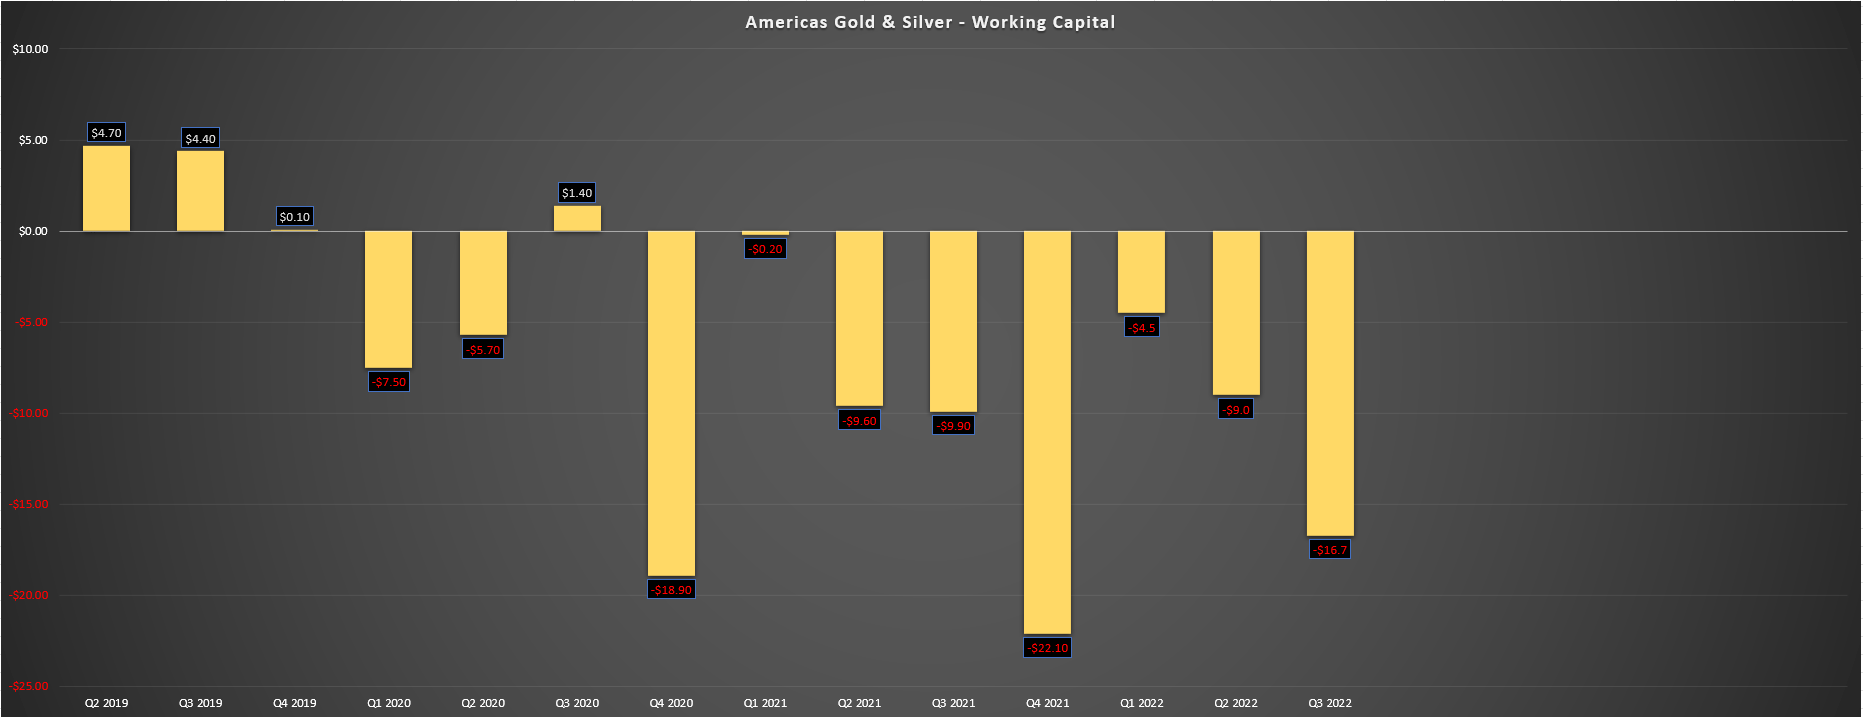
AG&S – Working Capital (Company Filings, Author’s Chart)
The bull case for AG&S that the company continuously highlights is that Galena will be a much more robust operation once the Galena Hoist Project is complete (planned commissioning in December) with increased hoisting capacity and improved operational flexibility. While this will certainly benefit this mine that is processing just ~100,000 tonnes per annum and will reduce the impact of fixed costs, I’m less optimistic that this asset can maintain AISC below $16.00/oz, which is required to generate a consistent profit. So, while this project being near completion is a positive development and should improve operating costs, we’ll need to see how significant the impact is in FY2023.
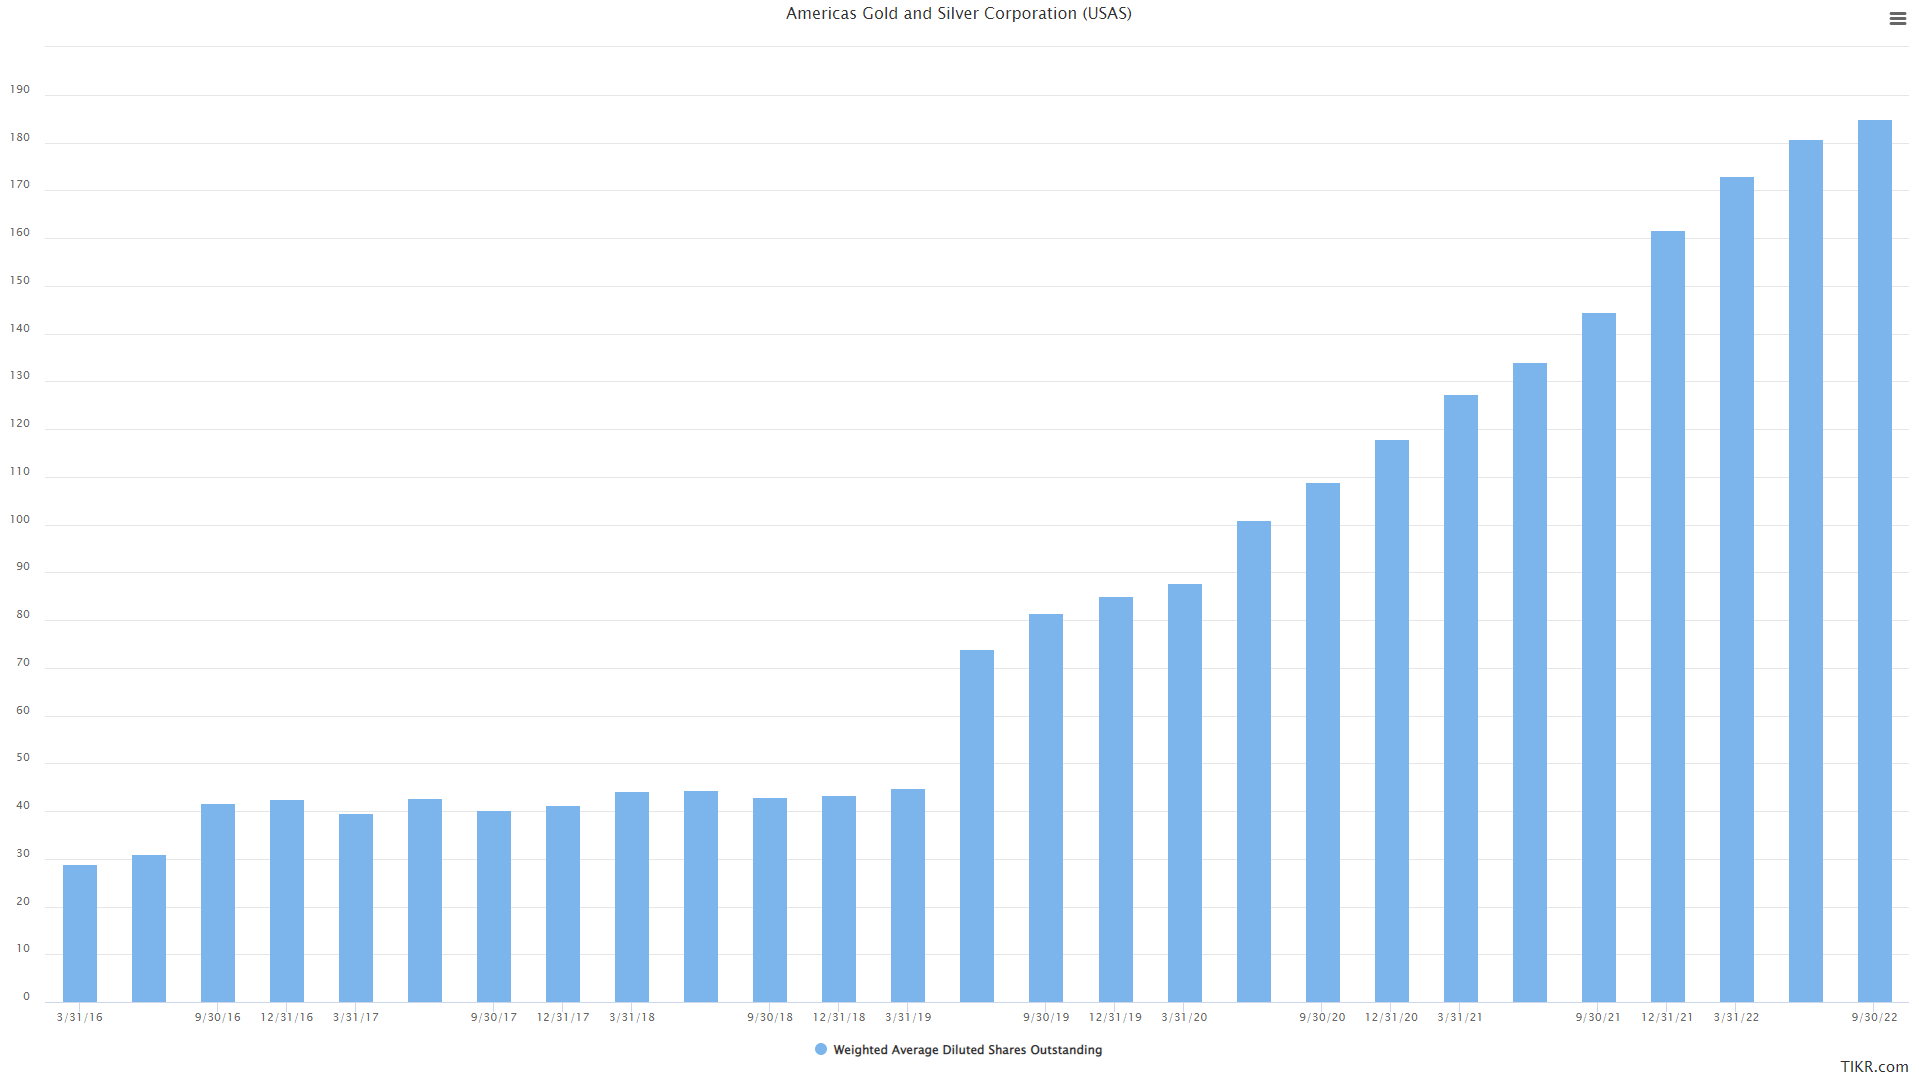
AG&S – Share Count Progression (TIKR.com)
That said, even if this asset can improve, there are two major negatives. The first is that the company only has a 60% ownership of this asset after announcing a strategic joint venture to sell 40% of the asset to help turn around the operation. The second is that in the process of turning around this operation and failing to build a sustainable operation in Nevada (Relief Canyon), AG&S’ share count has increased from ~74 million shares to ~199 million shares, and the share dilution is likely to continue into 2023 given the weak balance sheet. So, while production might be increasing from a low base, and this might appear to be a growth story, it’s certainly not a production per share story, and that is all that should matter to investors.
As discussed in previous updates, if a company is not growing or maintaining its per-share metrics (cash flow, production) in this sector, it is better to own the metal. This is because any upside realized from higher metals prices will be offset by the increased share count, making it very difficult to enjoy positive returns in that stock when per-share metrics are trending lower. Past examples that I have warned of are Pure Gold (OTCPK:LRTNF), McEwen Mining (MUX), and Great Panther (OTC:GPLDF), and Americas Gold and Silver is a serial offender in this category of consistent share diluters and one of the worst examples of this sector-wide.
Recent Developments
Looking at recent developments, AG&S reported a net loss of $24.6 million on revenue of $18.3 million in Q3. The bulk of this loss is related to a $13.4 million further impairment on its Relief Canyon Mine in Nevada. This has pushed year-to-date net losses to $34.2 million despite benefiting from strong base metals prices in H1-2022. The company noted that while leaching has continued at this mine, where mining operations were suspended shortly after start-up (1,900 ounces of gold produced year-to-date), the technical studies completed on metallurgy have not yet identified an economical way to resume near-term production. This is certainly not positive, with the construction and start-up of Relief Canyon leading to irreparable damage in AG&S’ share count with little to show for it.
AG&S noted that the impairment was based on the decrease in valuations of comparable companies sector-wide and determined by the fair value of contained GEOs at Relief Canyon based on a market approach of comparable companies.
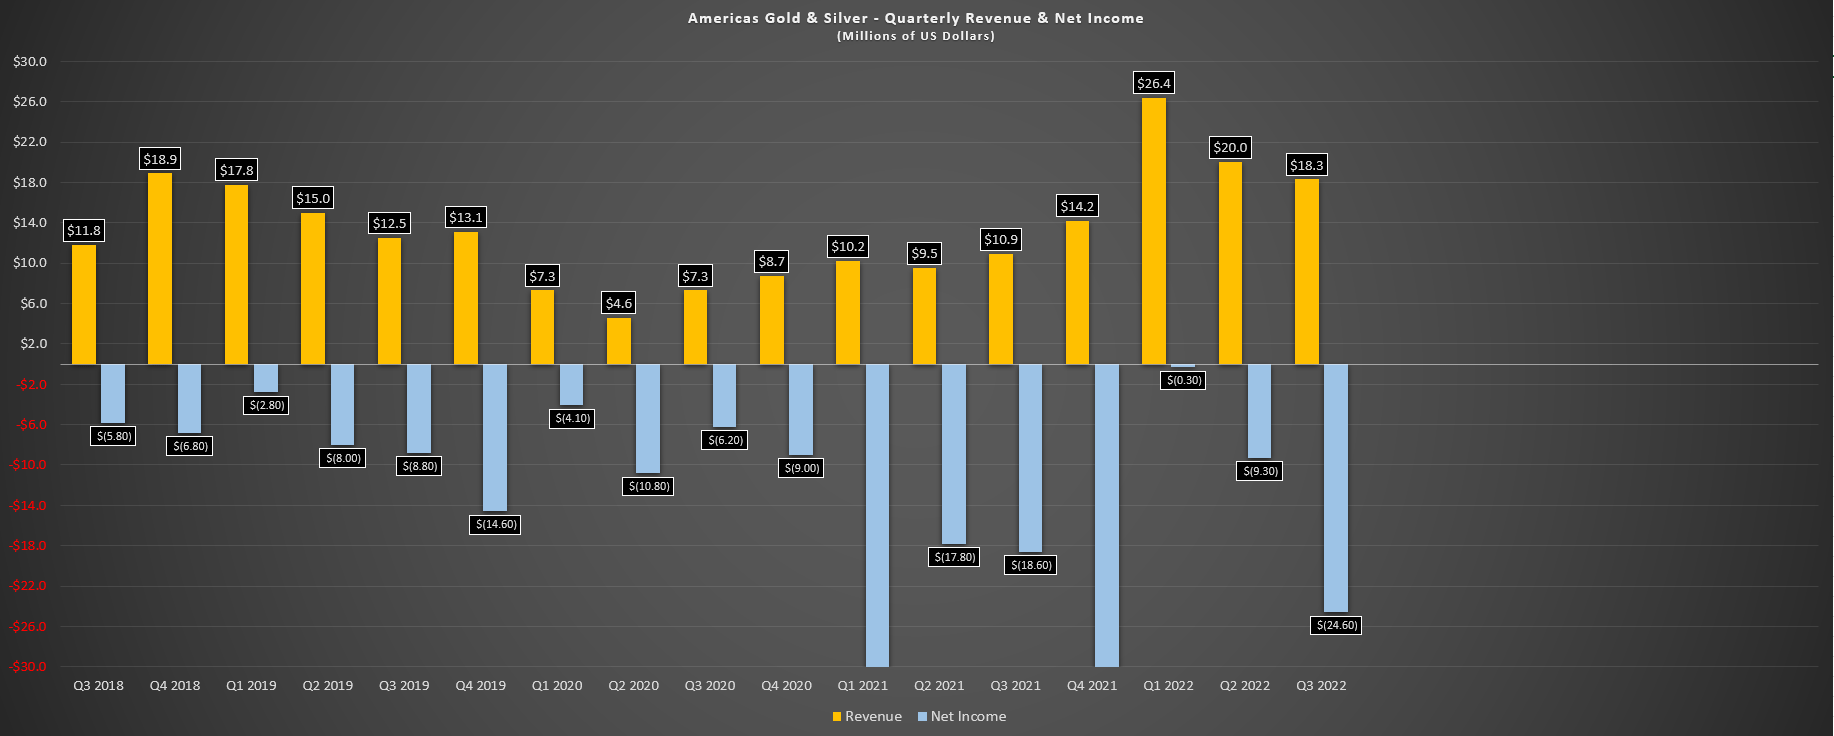
AG&S – Revenue & Net Income (Company Filings, Author’s Chart)
Even if we subtract the additional impairment at Relief Canyon in Q3, this is still clearly not a business that is generating consistent profit with a large cash outflow in Q3 and another year of net losses. Some investors might take solace in that the Galena Hoist Project could be a game-changer, and all major components have been delivered to the site, with it set to be operational in Q1 2023. However, given the poor track record here of delivering on promises, the fact that there’s no guarantee that this will be a robust operation, and the fact that AG&S practically gave away 40% of this asset while other companies were busy making transformational acquisitions below $1,500/oz gold, it isn’t easy to be optimistic here.
In terms of highlighting the track record, it’s worth noting that AG&S had ~40 million shares in 2017 (following a 12 to 1 share consolidation) and annual production of ~2.62 million silver-equivalent ounces in FY2016. Today, the company’s share count has increased nearly five times to ~199 million common shares outstanding, yet production has not even doubled (2022 guidance: ~5.0 million SEOs). Hence, investors are actually getting less than half the ounces per share they hold than they were several years ago. However, the company still has considerable debt (convertible debenture of C$18 million), and a fixed-ounce contract encumbers it at Relief Canyon, where it must deliver ounces regardless of whether this asset is in commercial production.
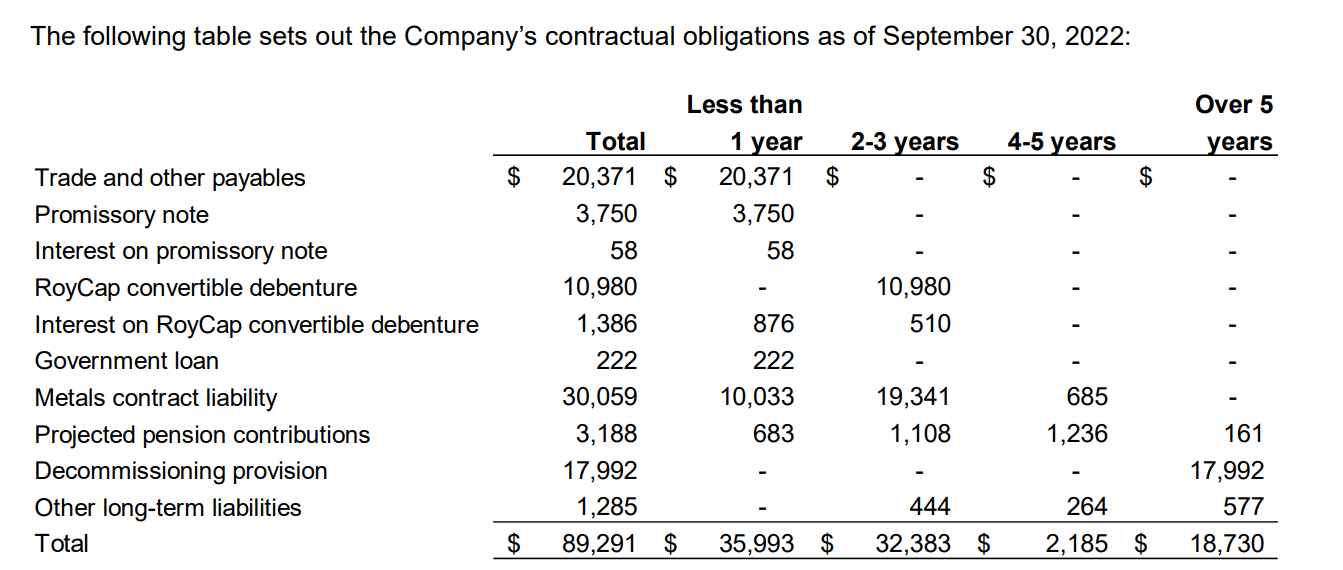
AG&S Contractual Obligations (Company Filings)
To summarize, further share dilution is likely on deck to satisfy these obligations when AG&S has one small asset generating limited cash flow and another asset that’s still bleeding cash: Galena.
The only positive development worth noting, which could be the catalyst for the stock’s recent rally, is that zinc and lead prices have rallied off their Q3 lows, and the silver price is back above the $22.00/oz level. This should help the company from a by-product standpoint (costs) and a revenue standpoint. That said, base metals prices are still well below their H1-2022 levels when AG&S was benefiting from considerable by-product credits, and if a business is reliant on multi-year highs in a commodity to comfortably make money at both of its operations, this isn’t a business worth investing one’s capital in, at least in my view.
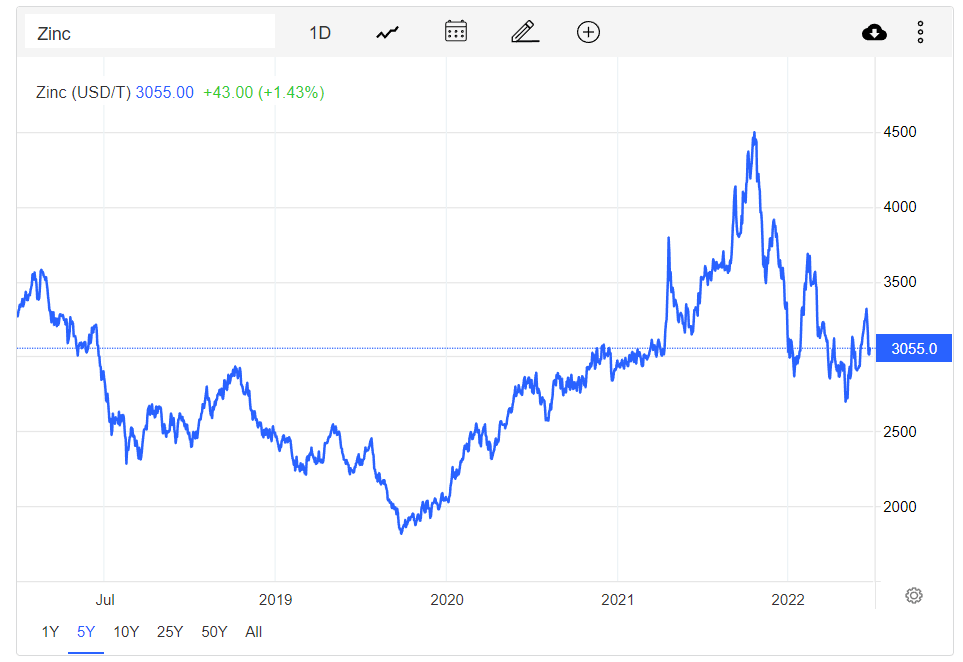
Zinc Price (TradingEconomics.com)
Valuation & Technical Picture
Based on ~213 million fully diluted shares and a share price of US$0.61, AG&S trades at a market cap of $130 million, which would appear very cheap for a company set to produce over 2.0 million ounces of silver next year. However, it’s important to note that the share count is a constantly moving target with share dilution on its common shares of more than 20% in the past ten months alone (2021 year-end: ~165 million shares), and further dilution is likely with convertible debentures at a 9.5% interest rate (due Q2 2024) and a consistent negative working capital position despite completing multiple capital raises this year at extremely unfavorable prices (capital raises at US$0.68 per share in June, US$0.50 per share in September).
Given that the share count is a moving target, it’s nearly impossible to determine if AG&S is undervalued, given that the share count keeps rising, impacting its valuation. For example, one might have concluded that AG&S was undervalued when it started the year with ~160 million shares at US$0.80 per share ($128 million market cap). However, with the share count increasing significantly, the stock is down over 25% yet still trading at a similar market cap. Until one can have high confidence that share dilution is finally in the rear-view mirror, which I don’t see today given the balance sheet and liabilities, I see the stock as best to be avoided.
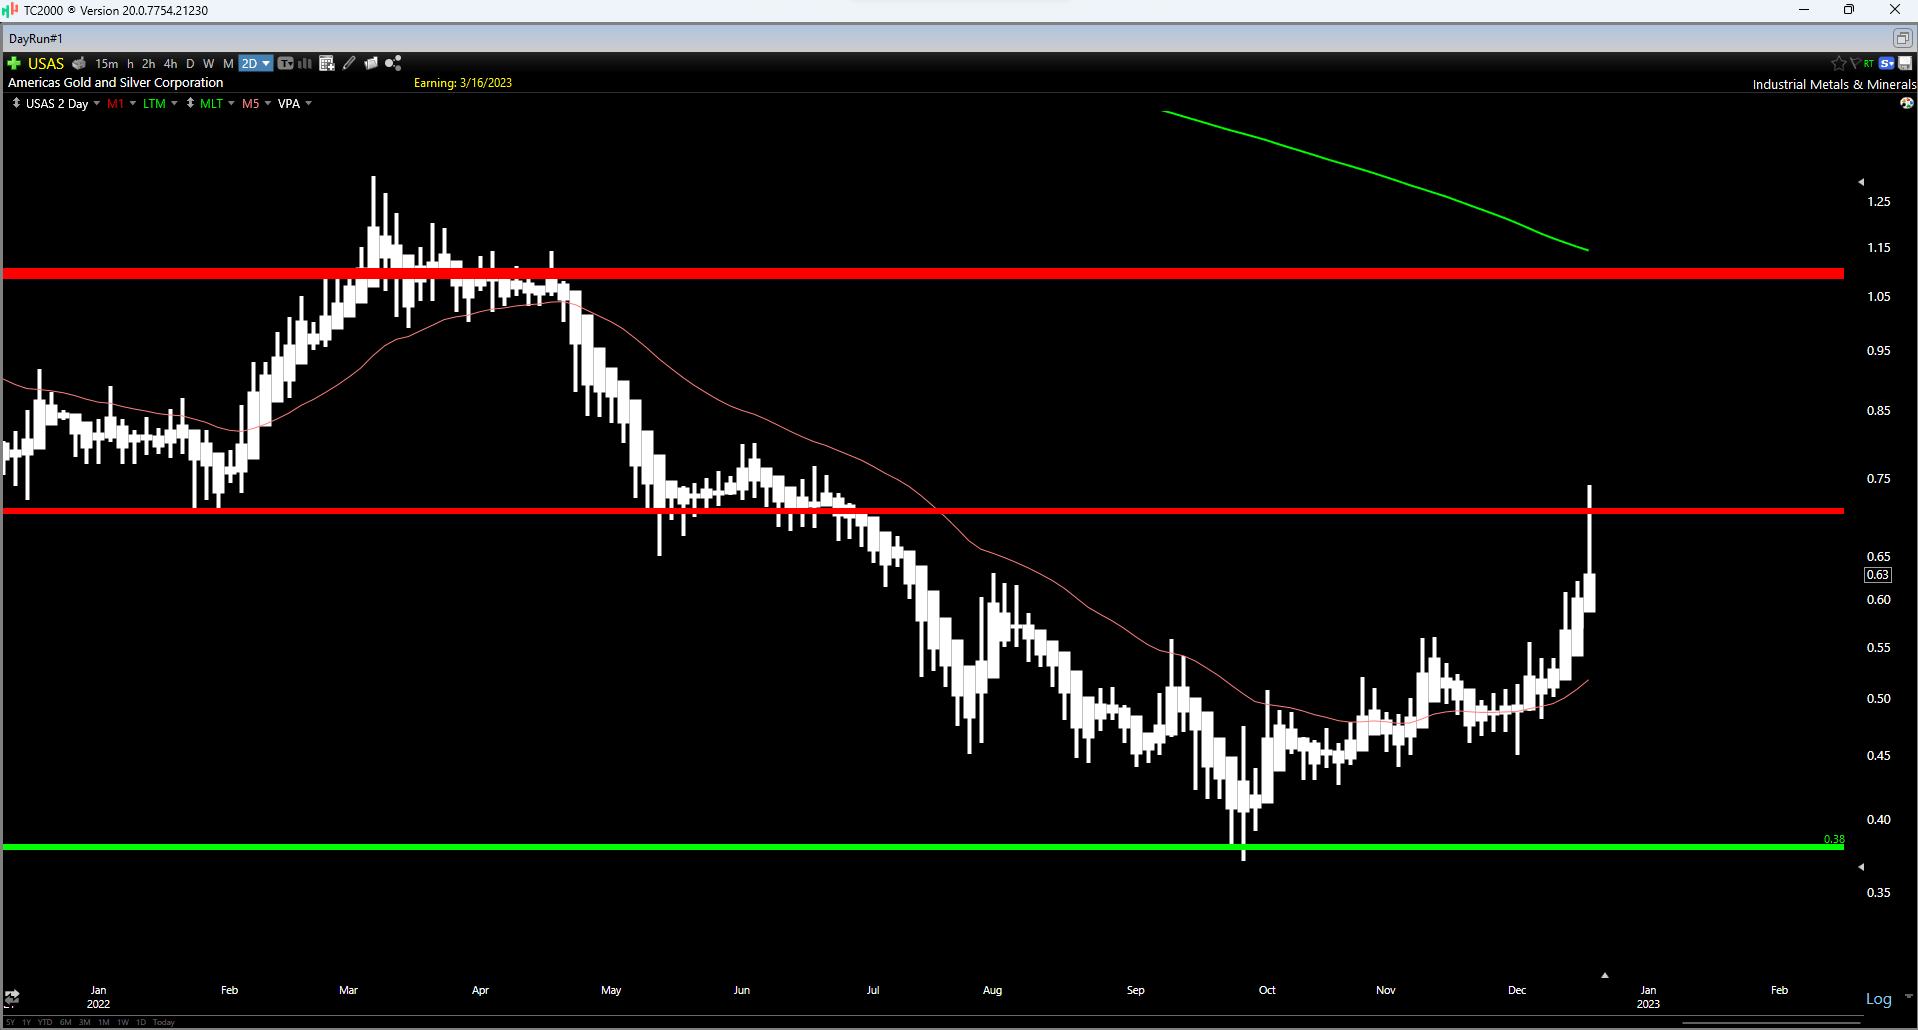
USAS 12-Month Chart (TC2000.com)
Finally, if we look at the technical picture, some investors might be getting excited that the stock is breaking out. However, I would argue that it is simply rallying into a broken support level at US$0.68, where it looks like it has been rejected. Meanwhile, the next strong support level doesn’t come in until US$0.38, so even after this pullback from its highs, USAS has less than $0.10 in potential upside to resistance and $0.23 in potential downside to support, resulting in an unfavorable reward/risk ratio of 0.39 to 1.0. Hence, the technical picture confirms the stock is nowhere near a low-risk buy zone.
Summary
We’ve seen a significant improvement in the balance sheets of gold producers and increased capital discipline over the past three years, with a sharp decline in the number of expensive acquisitions that ultimately lead to destruction in shareholder value. However, while most of the sector has changed its stripes, AG&S has not, and despite over two years of strong metals prices that should have allowed it to get its act together finally, we continue to see double-digit share dilution. Given this inferior setup, I see no way to justify owning the stock. Instead, I see a much more attractive setup in producers destined to grow resources, cash flow, and production per share, and one company with all three in spades is i-80 Gold (IAUX) – a superior buy-the-dip candidate.
Be the first to comment