

mihtiander/iStock via Getty Images
Thesis
American Tower (NYSE:AMT) showed up on our radar as its valuation dropped to a secular low as you can see from the following chart. In terms of dividend yield, it is currently yielding 3.01%. It is not only the peak level in a decade but also far exceeding its average of 1.73% and also the normal range of oscillations. In terms of price to FFO as seen in the bottom panel, the picture is not as dramatic but is still screaming a sizable discount. Currently, the P/CFO multiple for AMT is about 19.9x. To put things under historical perspective, the multiple for AMT has fluctuated in the past between 16.3x and 32.8x with an average of 22.2x. Therefore, its P/CFO multiple is below its historical average by more than 12%.
And the thesis of this article is that such large discounts have created favorable odds for long-term investors given its profitability and growth potential. As to be detailed in the rest of this article, yes, there are risks involved, especially due to its high leverage and hence high volatility in the near term. However, I see the current valuation contraction as overblown and has more than compensated for these risks already.
Source: Seeking Alpha data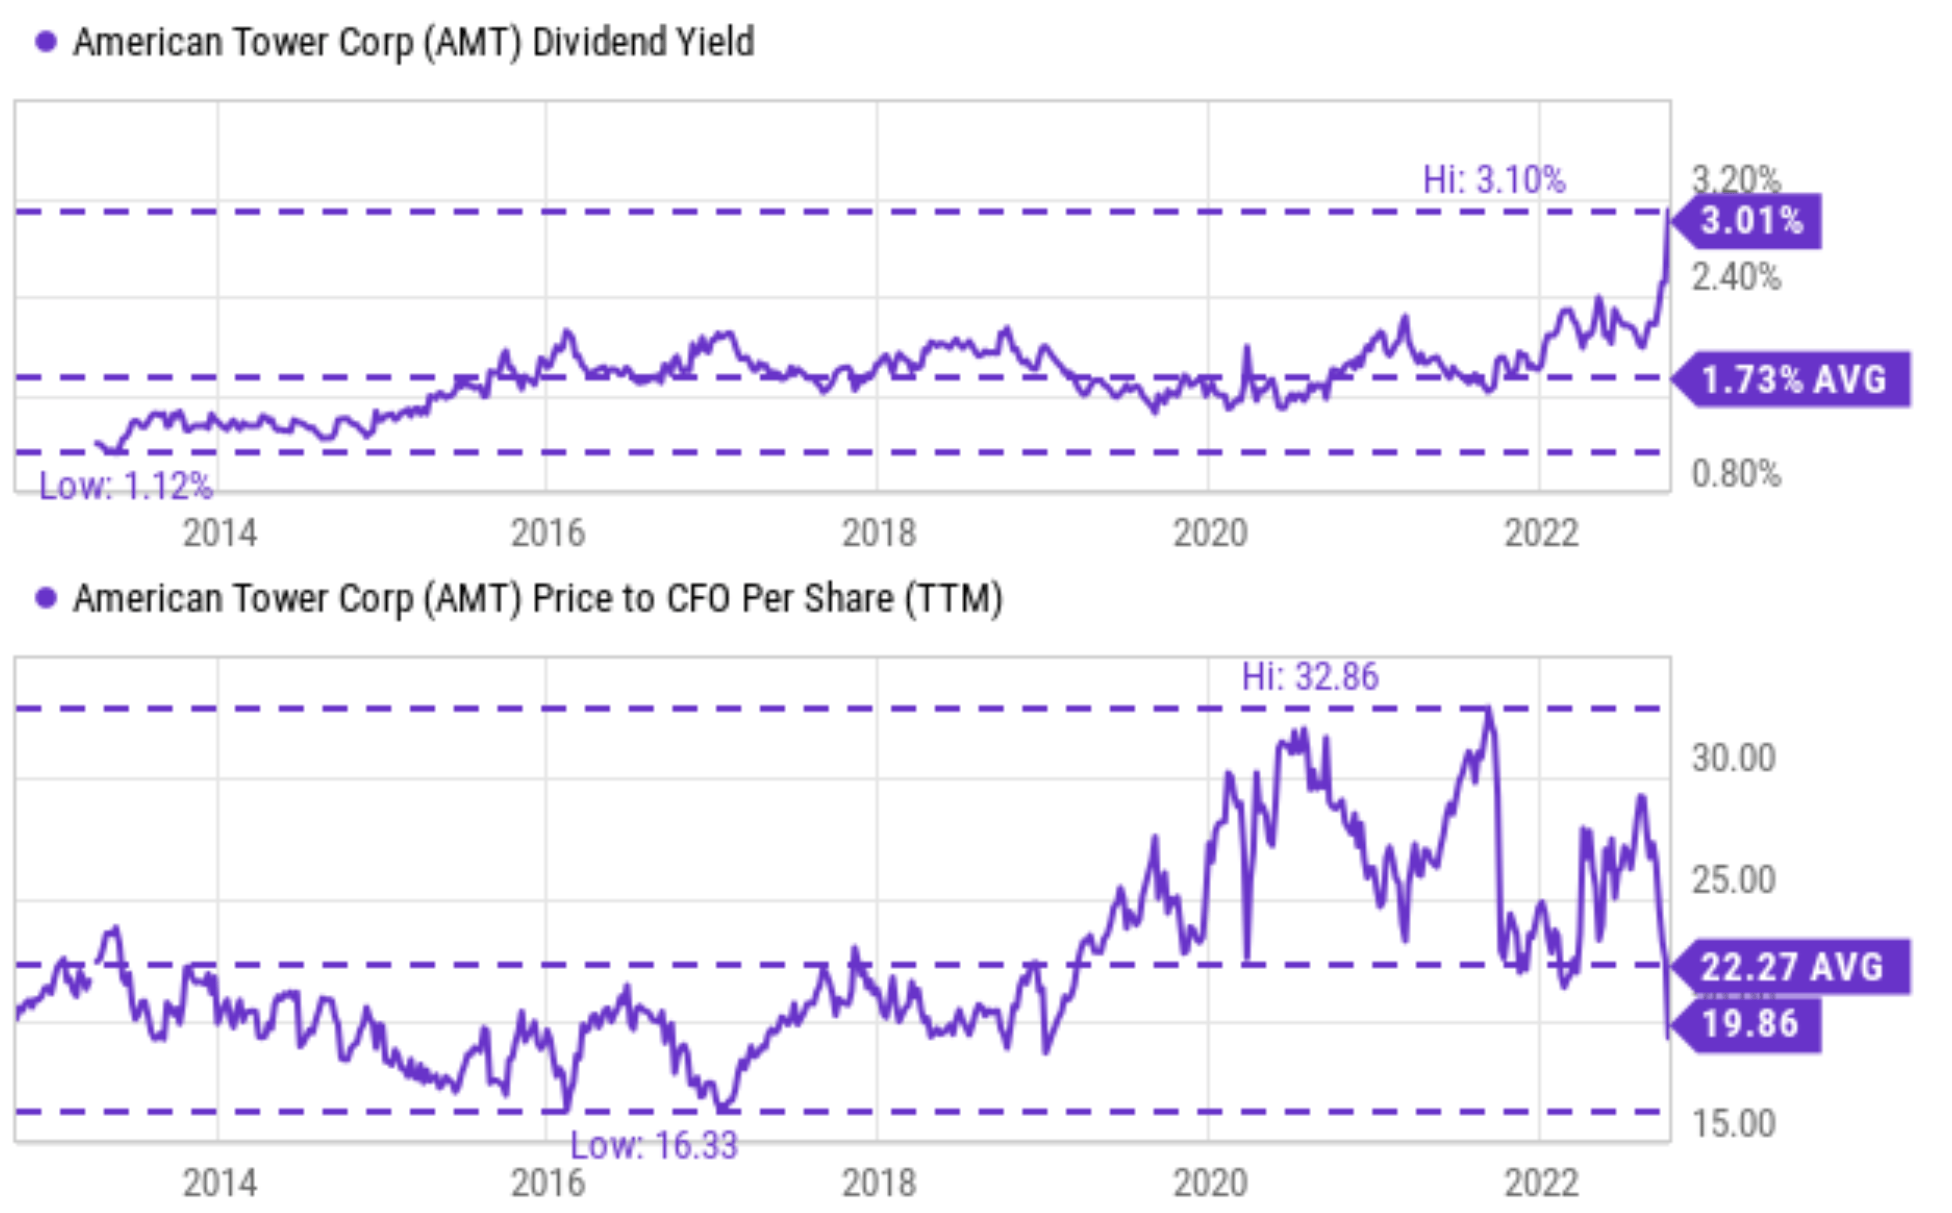
The positives: Peak profitability and healthy growth prospects
AMT posted good results during the first half of 2022. Revenues jumped 20% through the first two quarters, from the like-2021 period to an aggregate of $5.33 billion. Thanks to its scale and global footprint, its growth is fueled by aggressive expansion around the world. For example, in the past quarter, its topline grew 20% in Latin America, 14% in Africa, and Europe saw a growth of nearly threefold. Adjusted funds from operations (“AFFO”) increased a healthy 4% through the midpoint of 2022. EBITDA margins remained at a secular peak of 66.6%, more than 800 basis points above its historical average of 58.2%. Return on equity (“ROE”) is near a peak level too. Currently, its ROE hovers around 48.7%, almost 2x higher than its long-term average of 25.8% and quite close to its peak of 54.2% in a decade.
Looking forward, I anticipate the growth to continue given the secular support and given the exponential growth of our data needs (see the second chart provided below). As a global leader, AMT is best positioned to capitalize on such a secular trend. It has the means and scale to purpose sizable infrastructure projects. It continues to expand its leading global network. For example, its capital expenditures exceeded $772M during H1 of 2022, compared with $620M in a similar span last year. These will help augment its footprint to 2,961 communications sites around the world and also enhance its existing facilities.
Source: Seeking Alpha data Source: ipcisco.com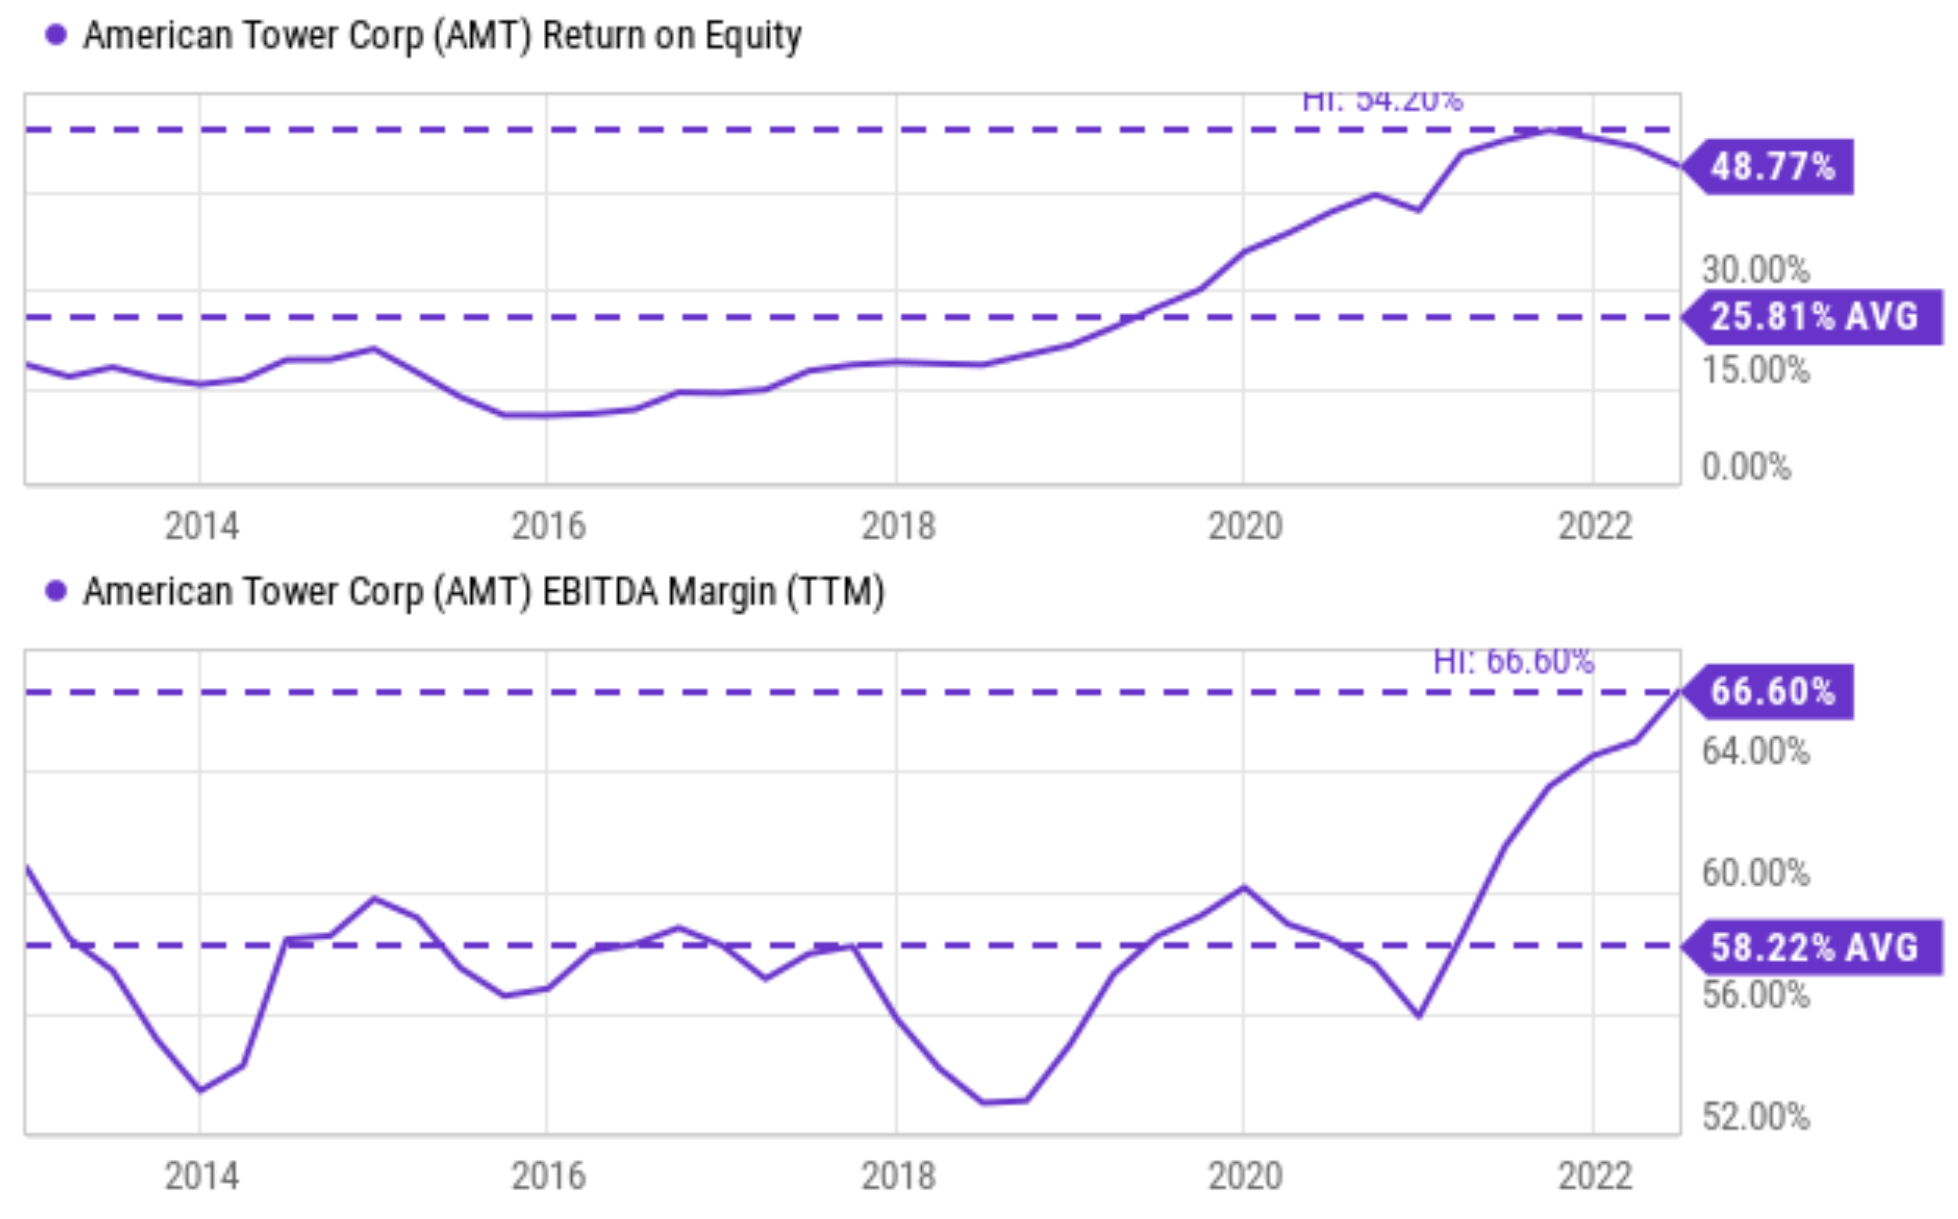

The negatives: High leverage and volatility
Although the fast expansion comes at the cost of a stretched balance sheet. Long-term debt climbed quickly in recent years as you can see from the top panel of the chart below. It was about $24 billion even back in 2002, and it now exceeded $40 billion already. In the second quarter of 2022 alone, its debt went up 13% from the prior year’s level. The debt-to-total capital ratio dipped a bit from a peak level of ~89% a year ago to the current level of 85.4% (as shown in the mid panel). Even for the capital-intensive wireless tower industry, such a leverage is quite high.
Although thanks to its robust profit growth, the debt is a bit less alarming when normalized by its earnings. For example, its debt-to-EBITDA ratio currently stands around 5.86x. The ratio has fluctuated from as low as 4.8x to as high as 6.2x in the past decade with an average of 5.46x. So, its current ratio is admittedly higher than the average, but only by a relatively mild margin of about 7%.
Source: Seeking Alpha data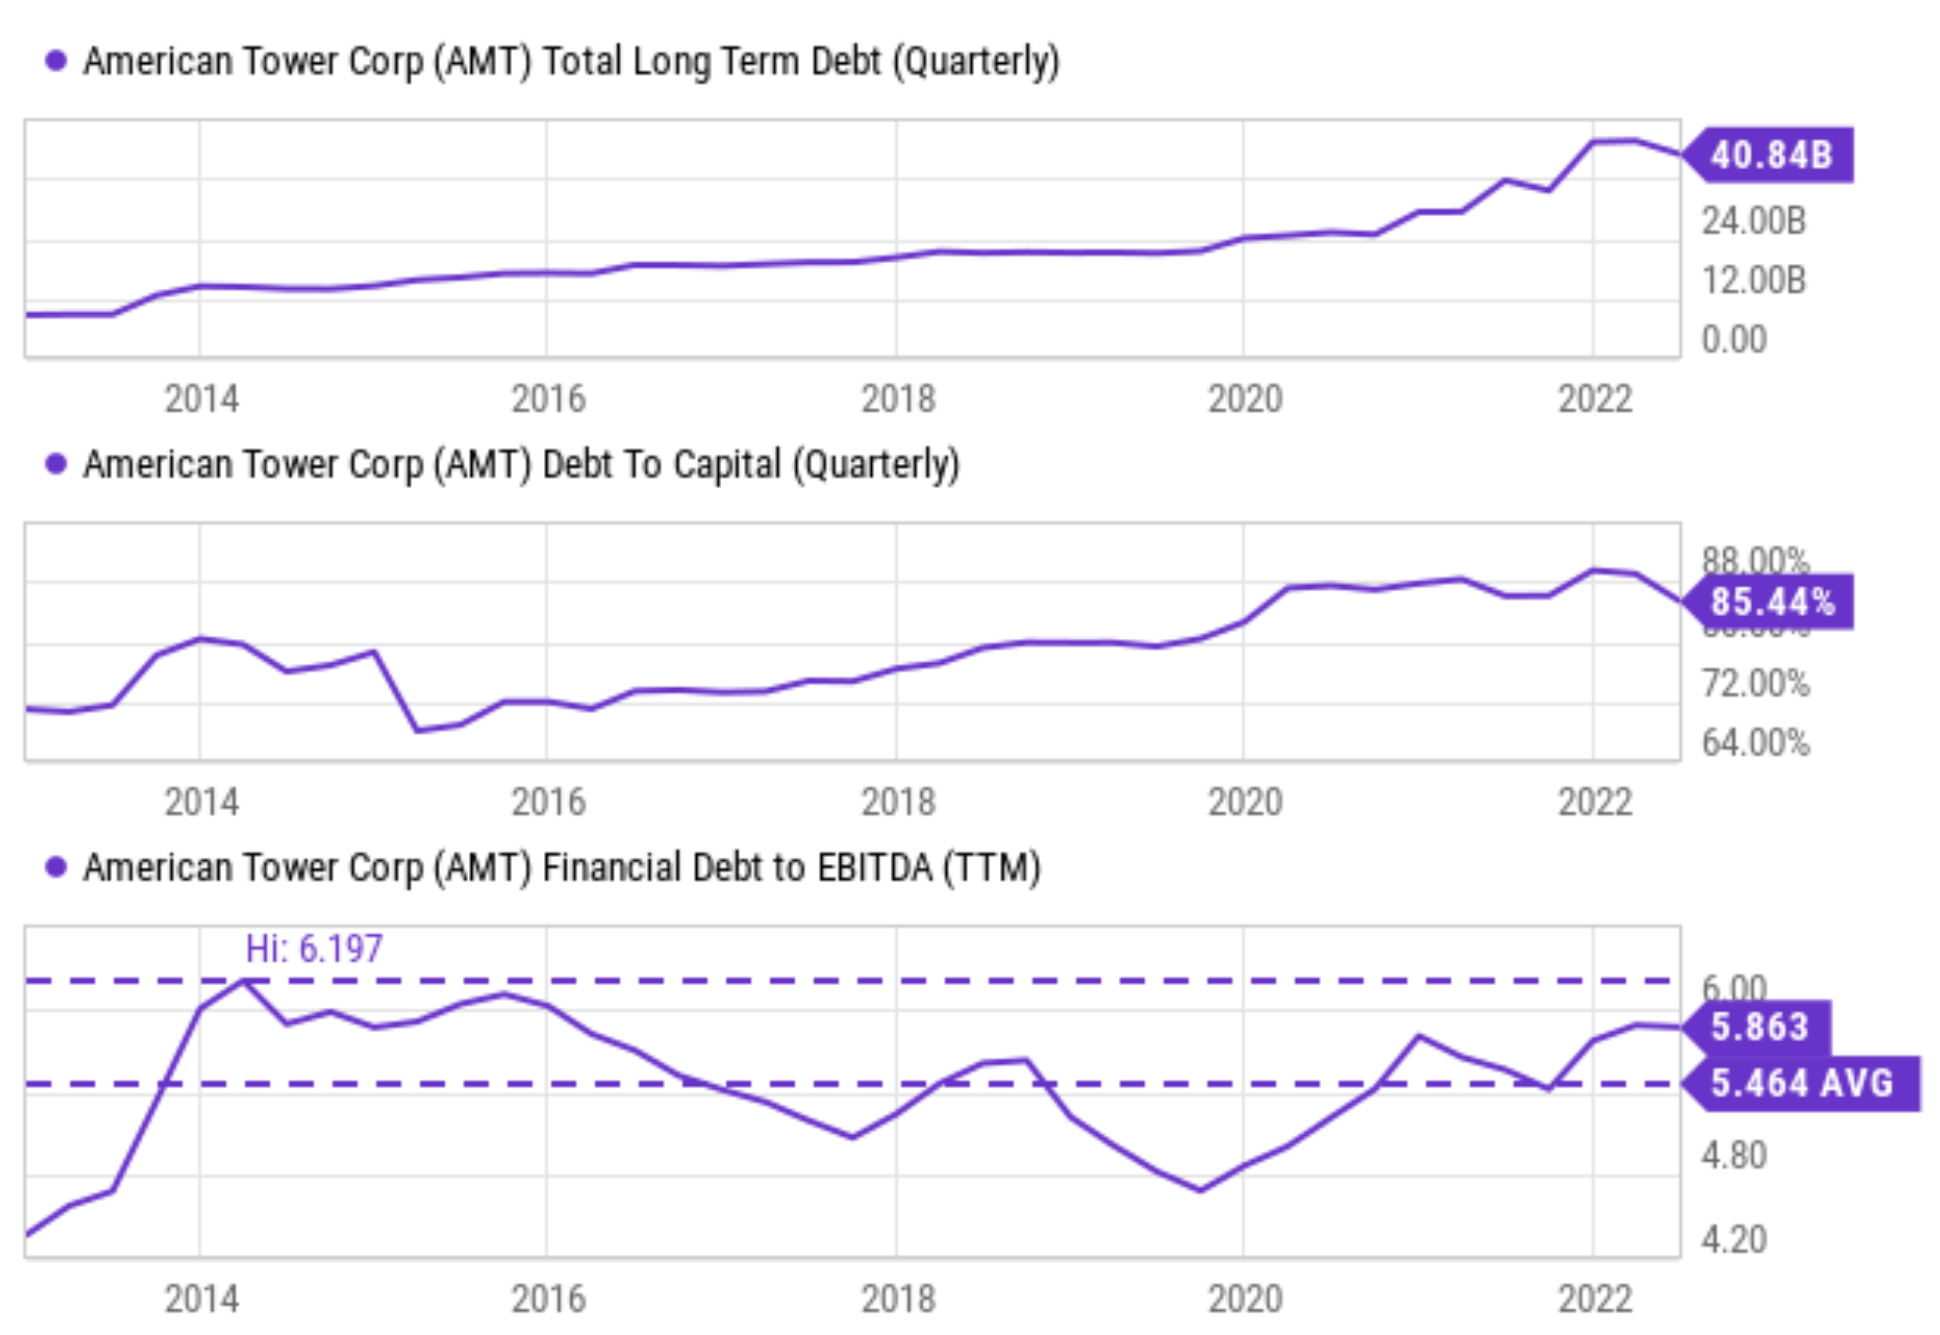
Partly due to its higher leverage and partly due to the overall market turbulence, the stock has been exhibiting large volatility lately as you can see from the following chart. The stock is currently suffering a more than 38% correction off its recent peak, and a correction of this magnitude has never occurred before. Actually, the stock has suffered corrections larger than 20% off the high only 3 times in the past decade. And all three times have occurred in the recent 1 year or so since mid-2020 as seen. Potential investors definitely should be prepared for such large volatility going forward.
Source: Author based on Seeking Alpha data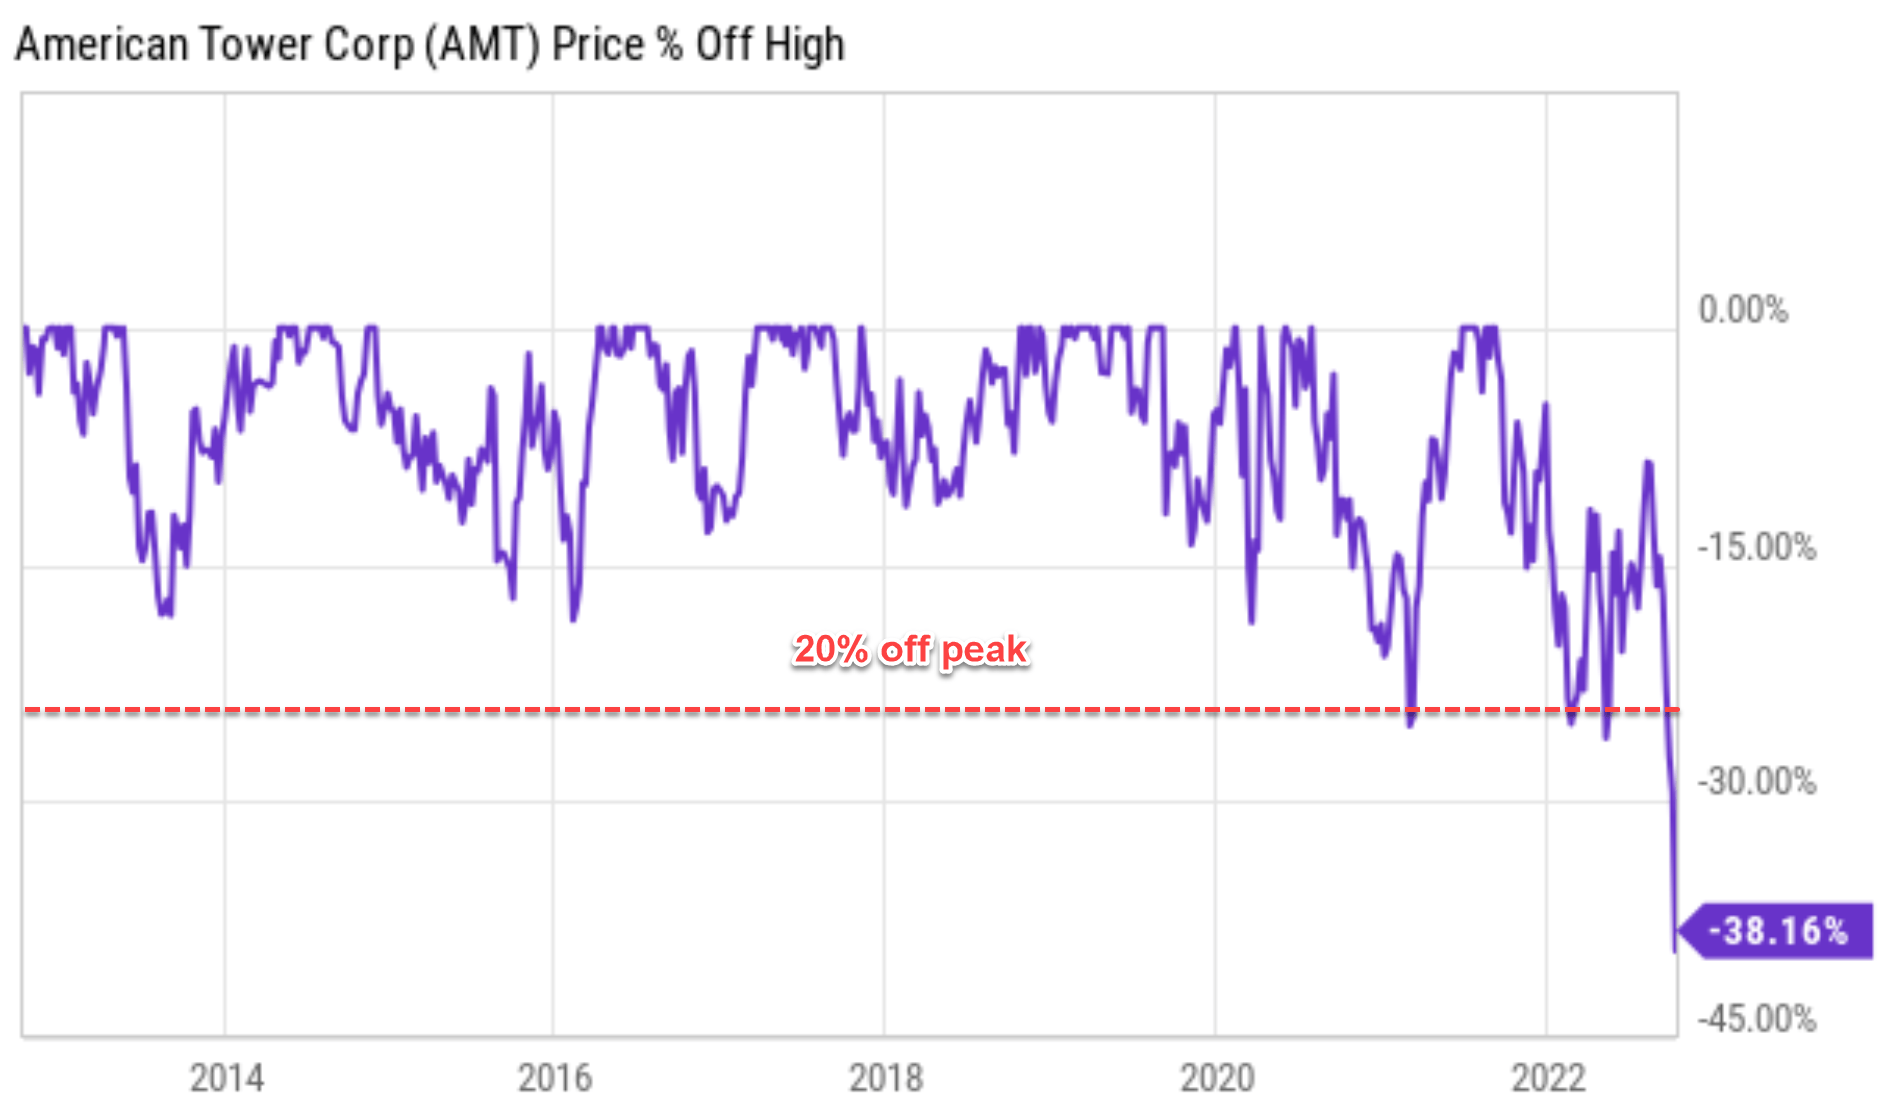
Risks and final thoughts
To recap, there are good reasons to be tempted to do some bottom fishing here with AMT. There surely are risks ahead, both due to macroeconomic conditions and also headwinds specific to AMT. Potential investors do need to be aware of its high leverage and hence high volatility going forward. However, my thesis is that the combination of valuation contraction, its profitability, and secular support has more than compensated for these risks already.
Especially for long-term investors, these near-term issues are largely noise as shown in the chart below. The chart shows the sensitivity of long-term returns with respect to the entry price. The red triangle shows a return projection (about 8.1% per annum) at the current price. The return consists of about 5.5% of owners earning yield (at ~22x P/FFO multiple) and about 2.6% of growth (assuming 10% reinvestment rates and 25.8% average ROE as shown above). And the green box shows the return change when the entry price changes from $165 to $200 (i.e., about 10% from the current price level in both directions). As you can see, such a seemingly large entry price variation only leads to about 0.4% of annual return change in the long term.
Source: Author based on Seeking Alpha data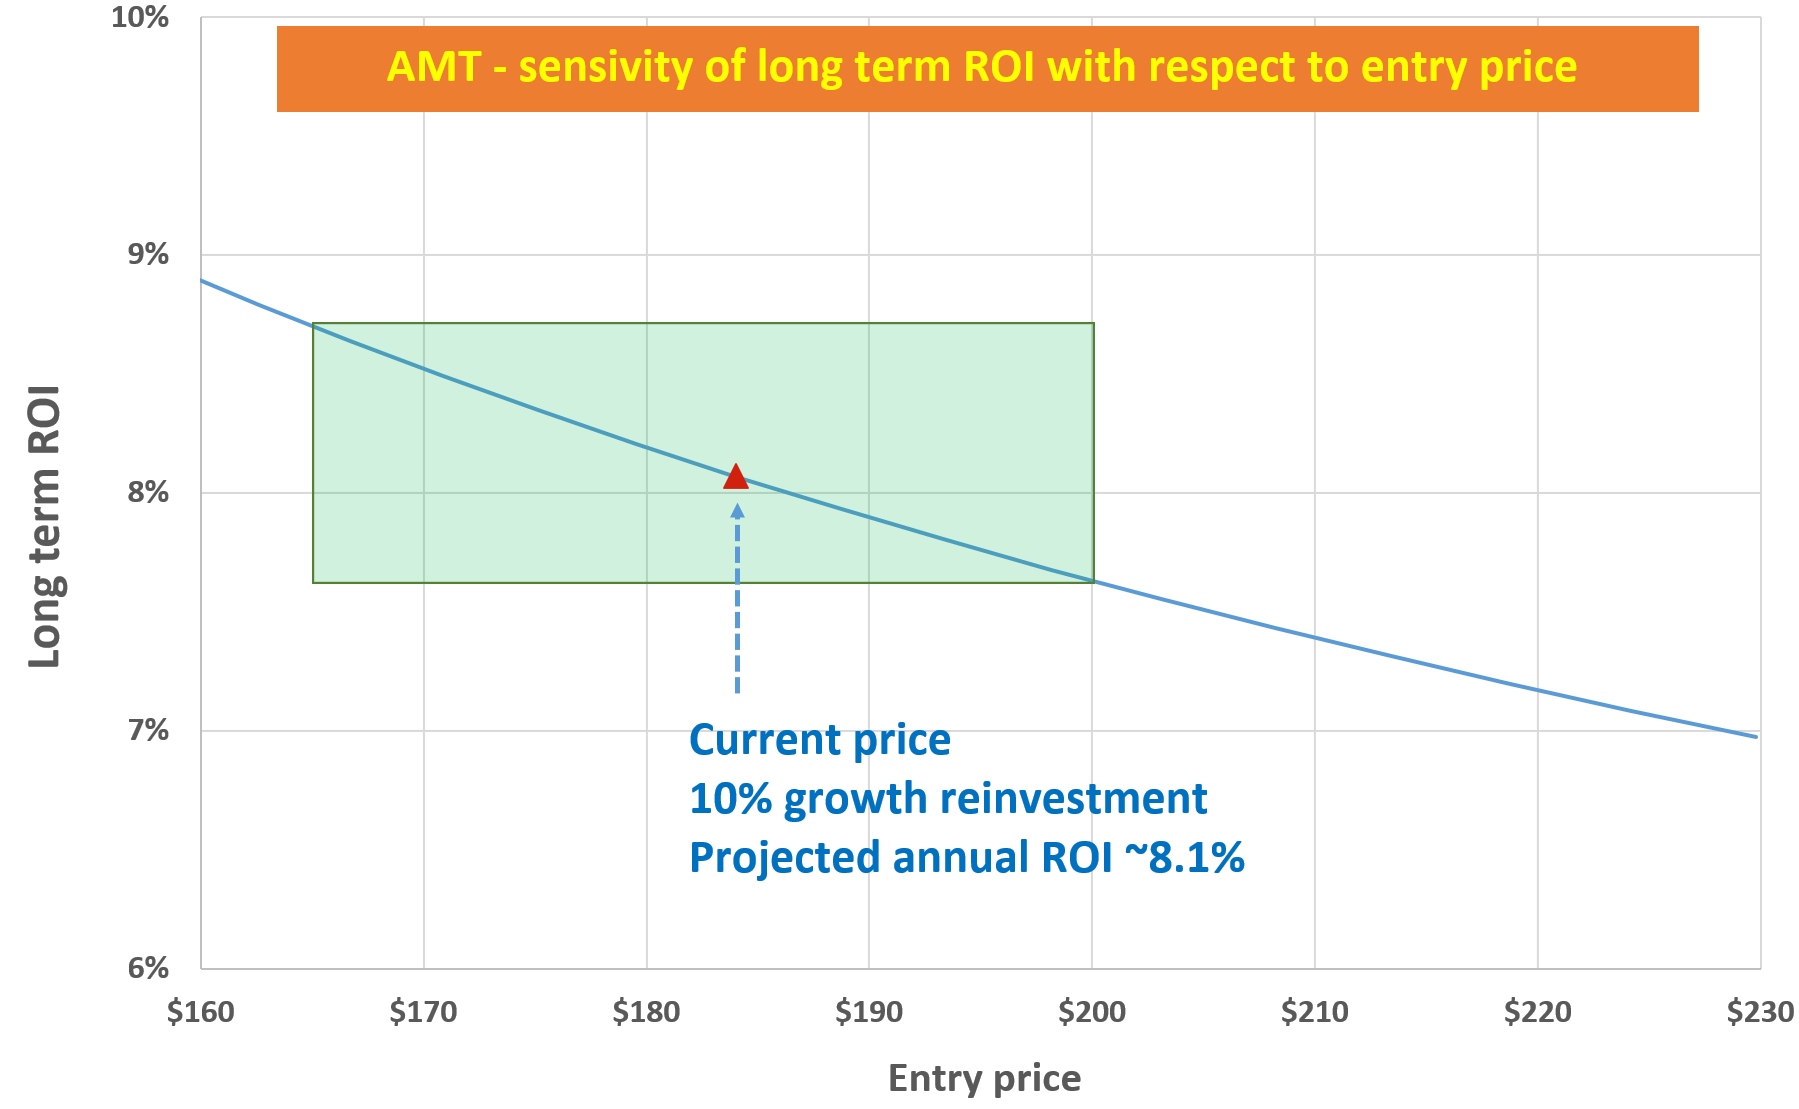
Be the first to comment