

everydayplus/iStock via Getty Images
by Levi at StockWaves; produced with Avi Gilburt
Fundamentals Of The Banking Sector With Lyn Alden
Lyn Alden provides much more detailed information and analysis to our members on a regular basis. Here are a few brief snippets from some recent commentary on the banking sector:
My outlook for the banking sector is mixed, but seems to differ considerably from the consensus.
I’m rather uncertain about the pricing of most risk assets in 2023, including bank stocks, due to recession risk. However, if a recession does occur, I don’t think the banking sector will be at the epicenter of it like it was in the 2008 recession. I think a lot of macro analysts are ‘fighting the last battle’ and assuming that if a recession occurs, it would devastate the banking system. I think the banking system is one of the stronger areas of the economy currently, and is priced inexpensively.
In other words, I would say that I am ‘less bearish’ on banks than the market seems to be, even though I’m not exactly pounding the table on them yet. I like them for diversification and generally think they’ll outperform the S&P 500 over the next five years, inclusive of dividends.
In 1929 and 2008, banks were at the epicenter of the crisis, and were subsequently recapitalized. In the 1940s and 2020s, banks were/are not at the epicenter of the crisis.
Now, that doesn’t mean banks wouldn’t be negatively-affected by a recession. Rather, it means they’re not going to be at the epicenter of it, and they’re in pretty good shape leading up to it.
The biggest risk for banks is loan losses. If the US economy enters a major recession, as many people are worried about, then bank assets will be impaired as some significant percentage of their loans are defaulted on. While this risk is material, I think it’s already well-accounted for in bank stock prices.
In my view, too many investors are fighting the last battle and assuming every recession will be a repeat of 2008, even if conditions (e.g. bank balance sheets) are completely opposite.
(AXP) – Another Of Our 22 Mega Cap Stocks Poised To Move Higher
It was back in mid-November of last year that our lead analysts in StockWaves published a list of 22 Mega Cap stocks with potential for new all-time highs into 2023. Zac Mannes and Garrett Patten scoured hundreds of charts to filter them down to these 22 possibilities.
We then marry those technicals with favorable fundamentals to find high probability setups.
StockWaves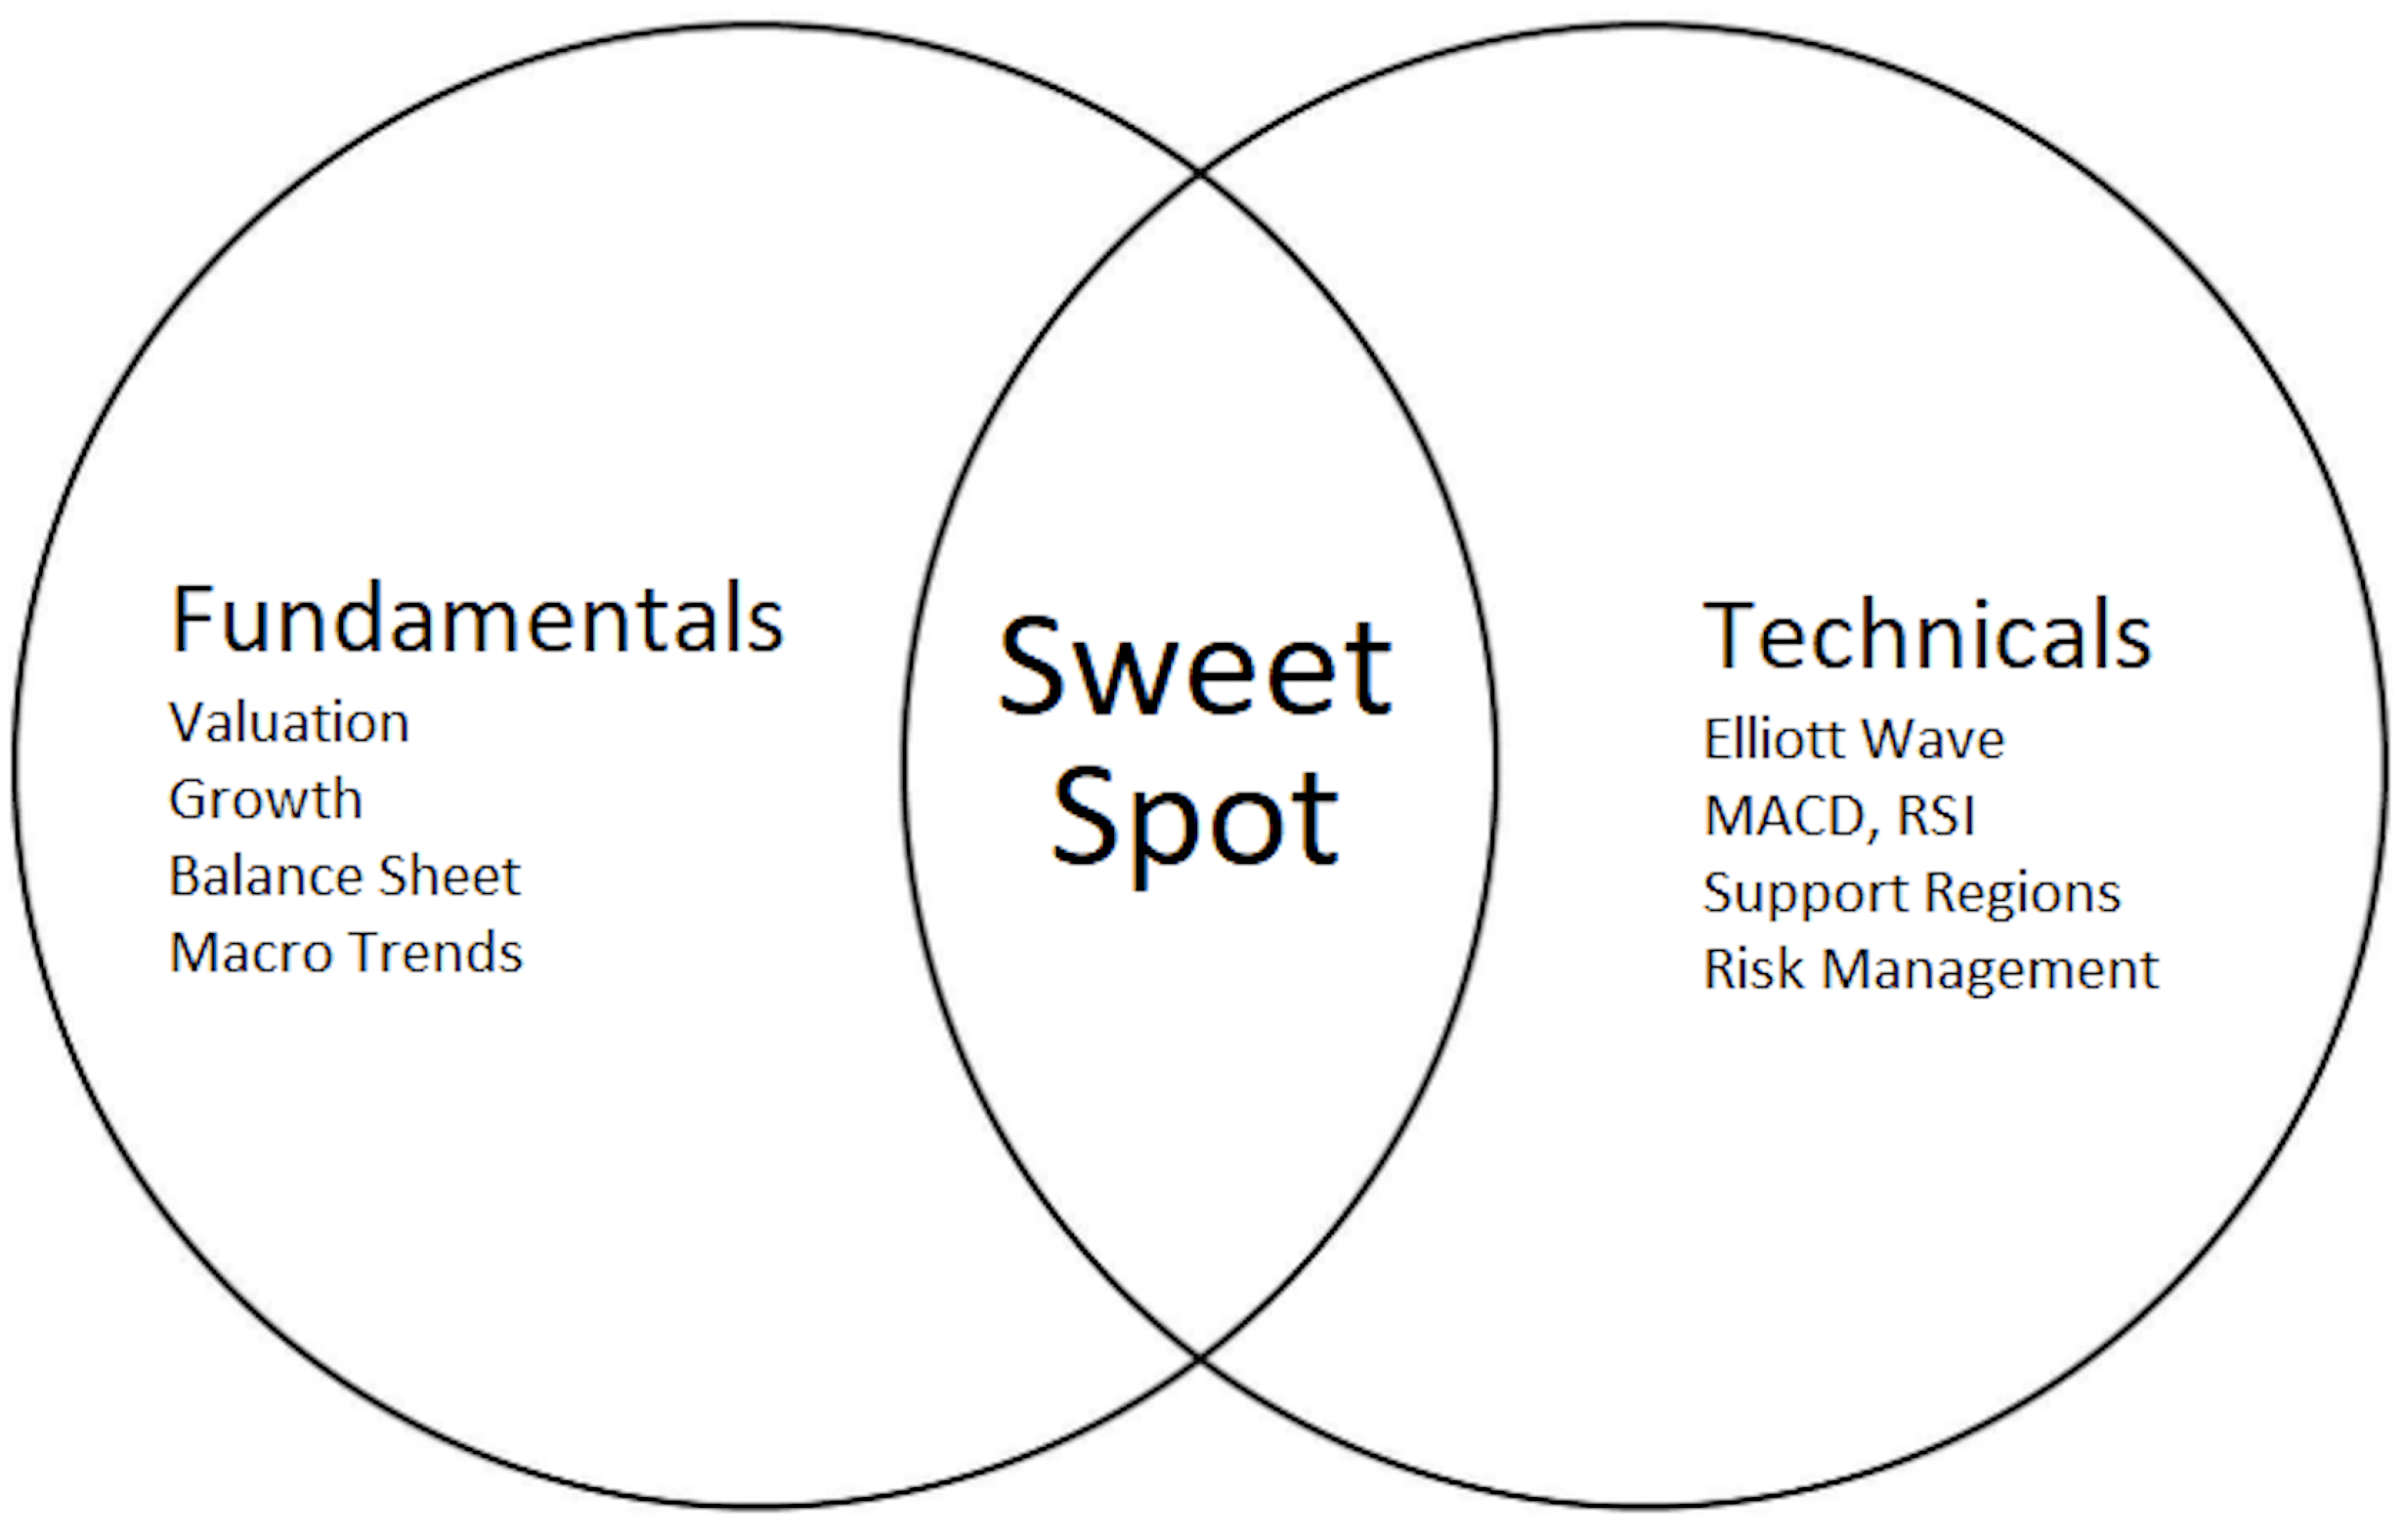
The Current Technical Setup For American Express (NYSE:AXP)
StockWaves / MotiveWave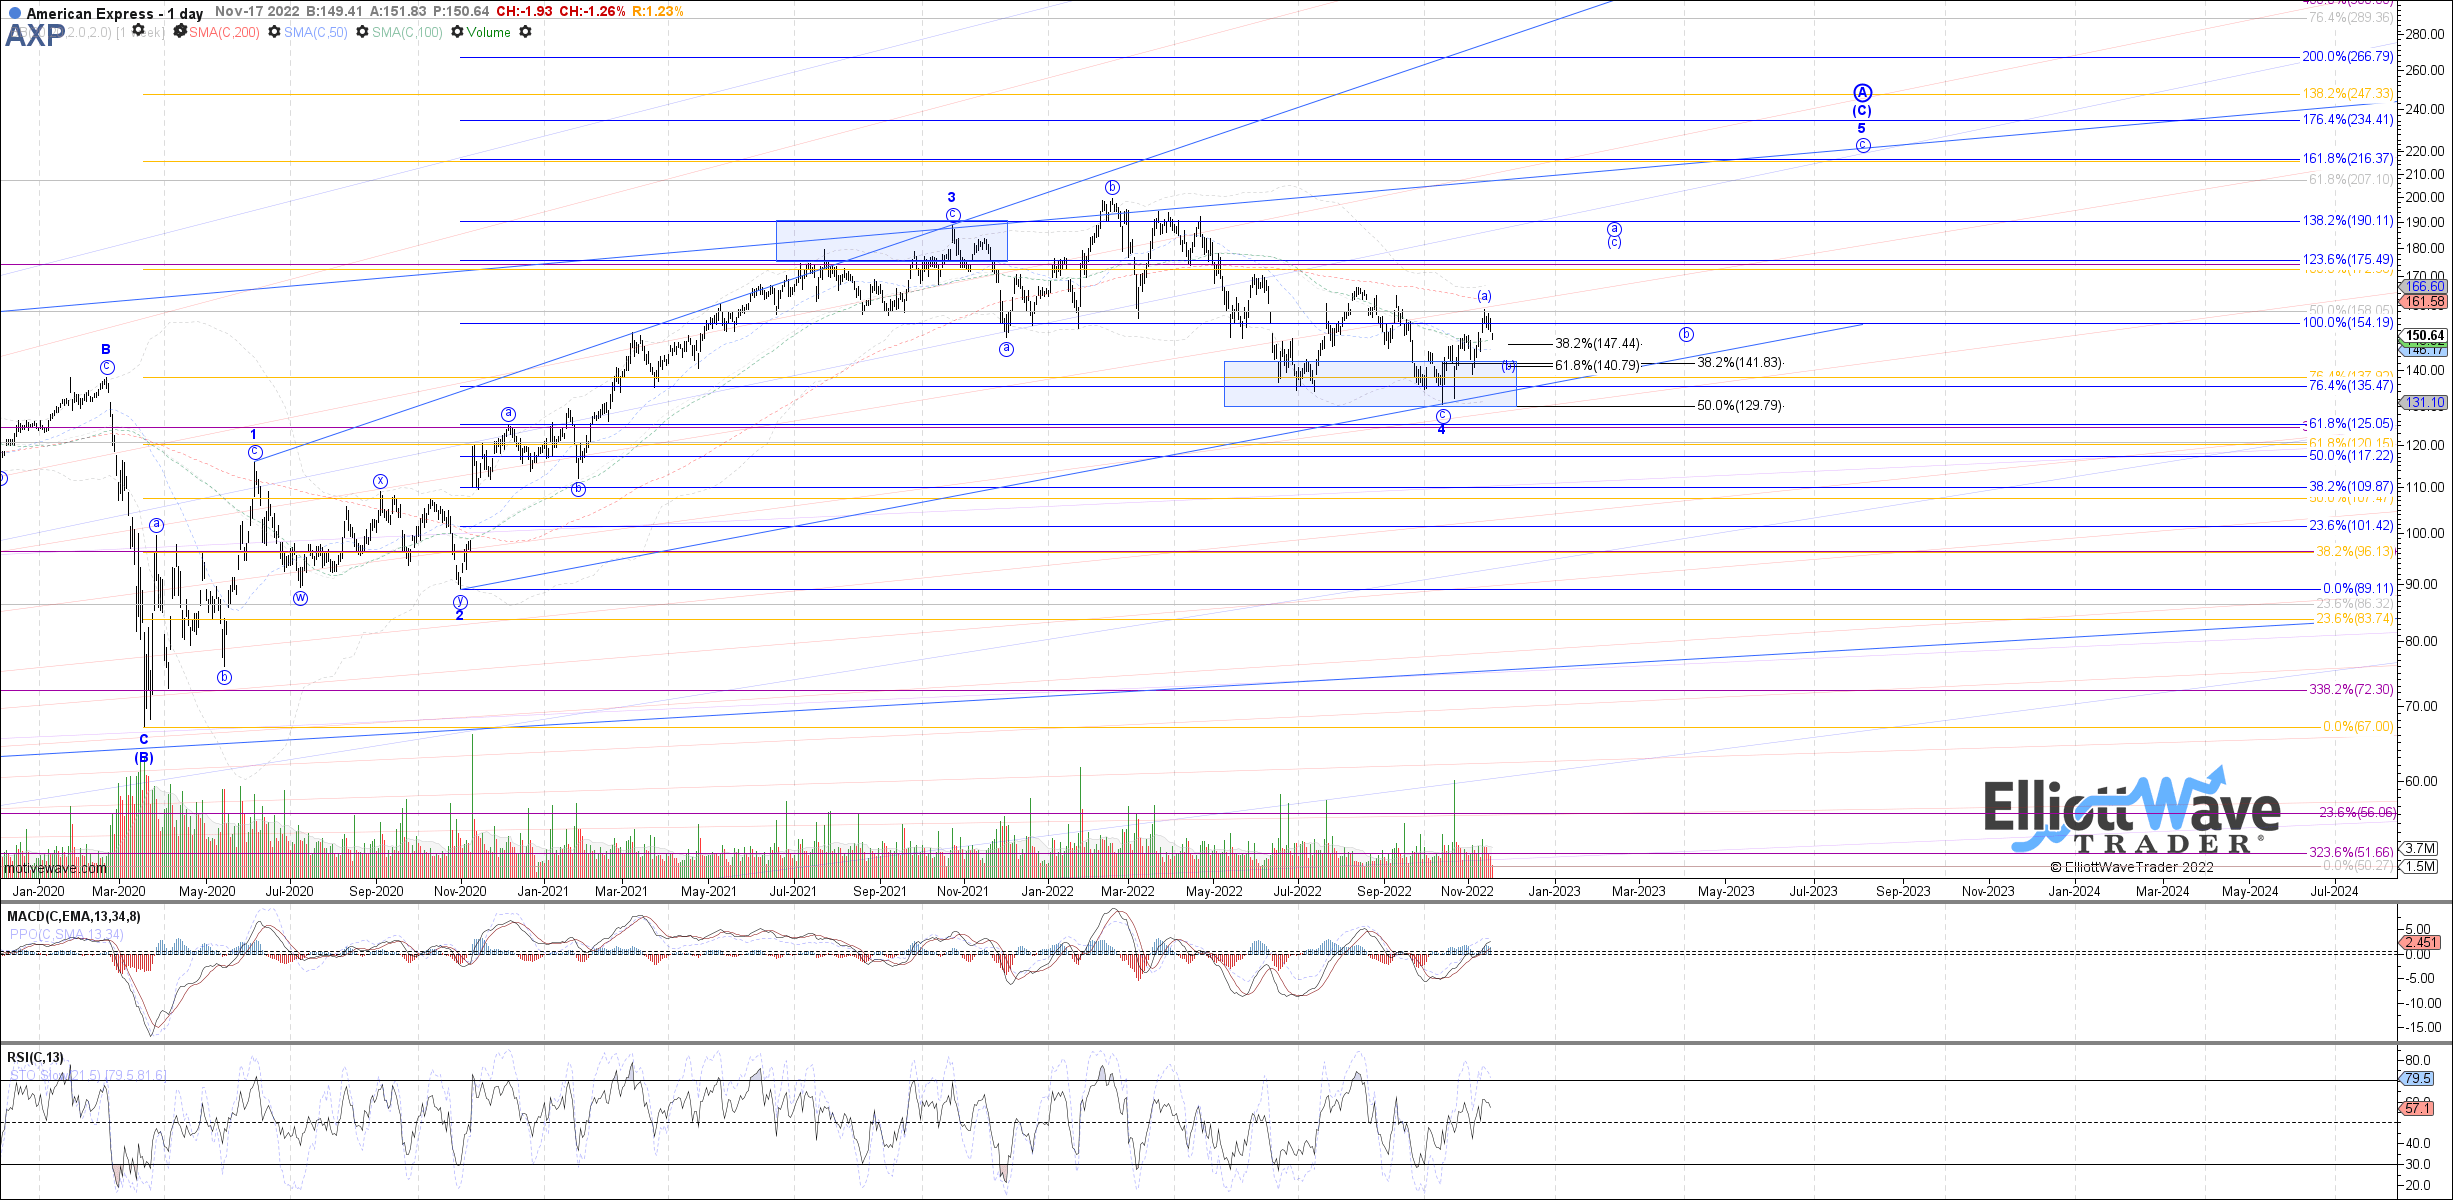
As you can see from the chart shared above, our current expectation is for AXP to see $216 or higher sometime in 2023. It has already taken the first steps up from the October 2022 low to fill out this anticipated structure.
StockWaves / MotiveWave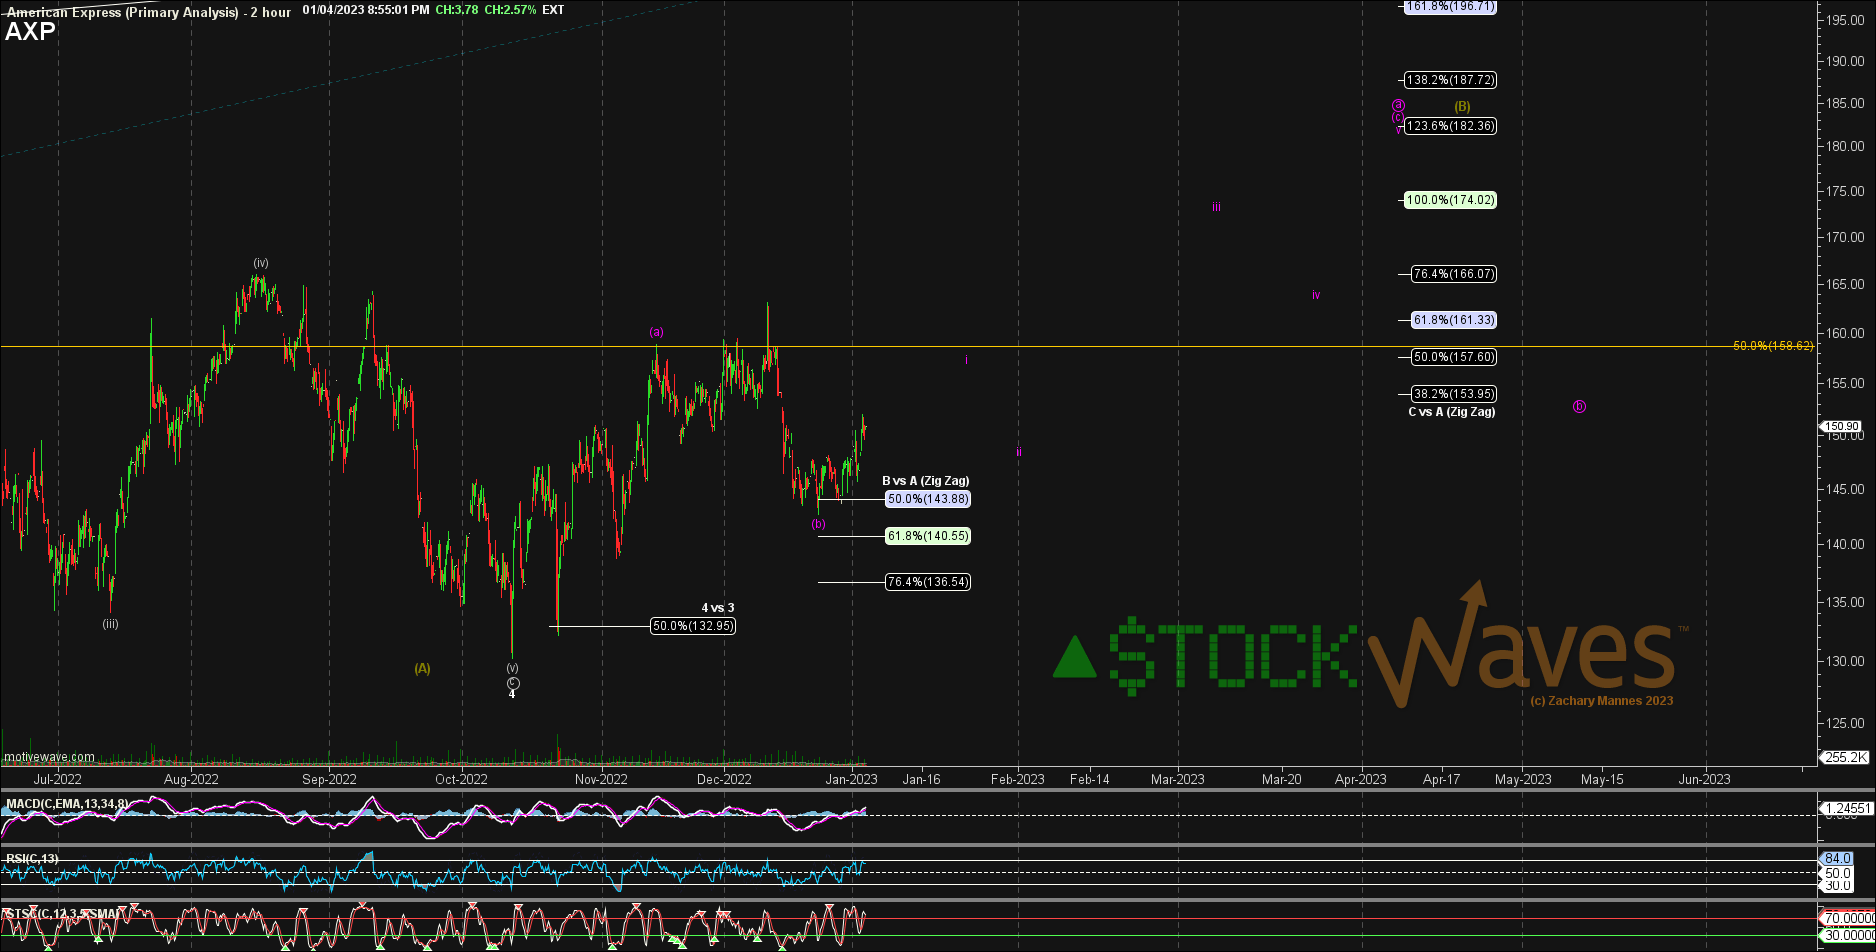
Note in this updated chart how the subwave path may unfold going forward. And well, you can see the price targets we see as probable. The two highest probability swing trading opportunities will likely be in the respective ‘c’ waves of the larger circle ‘a’ and circle ‘c’ of the larger wave 5 of [C] of a Primary A wave.
Why All The Alphabet Soup?
This is a nomenclature standard that, once understood, will change the way you view markets forever. Elliott Wave analysis, when correctly applied, is the only methodology that we know of that will provide current context as to where we find ourselves at any point in time in the markets.
To simplify and specify this to AXP, we see the stock as reaching for an important high sometime this year. It is likely that once this high is struck, it will be long-lasting and provoke significant corrective action.
Risks And Conclusion
Should AXP break back below the low struck in October of last year, that would have us reassess our current viewpoint. There are of course the macro variables in play as well. At any moment in the stream of time, risks exist. However, we view the market from a probabilistic standpoint. So, in the here and now, we see the likely path as higher into 2023. (Read into the next section to see why)
We Invite You To Learn The True Nature Of Markets
In the latter part of 2018, Avi Gilburt, Founder of ElliottWaveTrader.net, published a six-part series of articles that here on Seeking Alpha entitled, “This Analysis Will Change The Way You Invest Forever”.
(Part One, Part Two, Part Three, Part Four, Part Five, Part Six)
Here is a brief excerpt from Part Three of that series, in which Avi discusses Phi (the first part of the article explains this fully) and its role in Elliott Wave analysis:
The Elliott Wave theory is also based upon Phi, as Elliott Wave postulates that markets move in 5 steps forward, and three steps back (a Phi relationship). Phi, when used appropriately in conjunction with Elliott Wave, can be an incredibly predictive market tool. The internal wave structure within an Elliott Wave analysis must display relationships based upon Phi in order to be able to appropriately predict the next move within a market with any form of accuracy. In fact, after you identify the appropriate Elliott Wave pattern within a market, you are often able to then identify the next move of the market with shocking accuracy based upon a Phi-based target.
Now we know that movements in markets occur within waves, as discovered by R.N. Elliott, and we know that decision making and changes in trend are governed by Fibonacci mathematics and the properties of Phi. So, how do we apply this to our own trading to generate profits?
Stay tuned for next week’s installment when we begin to move into the meat of Elliott Wave analysis, followed by our own discovery we call ‘Fibonacci Pinball’. This is the meat of what we are working our way up towards. This should give you much greater insight into where we are within a trend so that you can align your portfolios to match the trend, as well as the maturity of the trend.
This Last Point Is Highly Important To The AXP Chart
Yes, we see AXP with a high-probability setup to reach new all-time highs in 2023. But after that, it will likely have reached the ‘maturity of its trend’ and be involved in protracted corrective action for some time thereafter.
I would like to take this opportunity to remind you that we provide our perspective by ranking probabilistic market movements based upon the structure of the market price action. And if we maintain a certain primary perspective as to how the market will move next, and the market breaks that pattern, it clearly tells us that we were wrong in our initial assessment. But here’s the most important part of the analysis: We also provide you with an alternative perspective at the same time we provide you with our primary expectation, and let you know when to adopt that alternative perspective before it happens.
There are many ways to analyze and track stocks and the market they form. Some are more consistent than others. For us, this method has proved the most reliable and keeps us on the right side of the trade much more often than not. Nothing is perfect in this world, but for those looking to open their eyes to a new universe of trading and investing, why not consider studying this further? It may just be one of the most illuminating projects you undertake.
Be the first to comment