

Sundry Photography
American Electric Power (NASDAQ:AEP), like many other utilities, has substantially sold off in recent months on fears of rising interest rates. Higher interest rates make it more expensive for utilities to refinance debt as well as making bond yields more attractive relative to utilities’ dividends. The Fed raised interest rates by 75 bps on September 21st. Fed Chairman Jerome Powell also strongly emphasized the commitment to bringing inflation down. While the market had been anticipating the hike, the commentary sparked a sell off, especially in rate-sensitive industries. From the 12-month high closing price of $105.18 on September 12, AEP fell 22% to close at $81.74 on October 12th. Over this same period, the Utilities Select Sector SPDR ETF (XLU) fell by 21% vs. a decline of 12.9% for the S&P 500 (SPY). AEP has returned a total of +2.1% for the YTD vs. -4.4% for XLU and -18.1% for SPY.
Seeking Alpha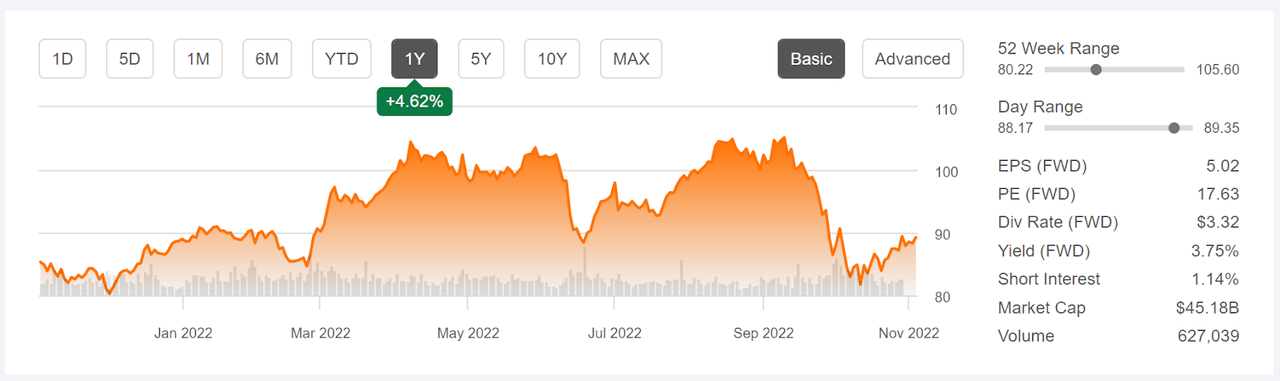
12-Month price history and basic statistics for AEP (Source: Seeking Alpha)
AEP has been turning in solid earnings over the past year, slightly beating the consensus EPS estimate in each of the past 4 quarters. There is a modest multi-year upward trend in earnings and the consensus estimate is for EPS growth of 6.3% per year over the next 3 to 5 years.
ETrade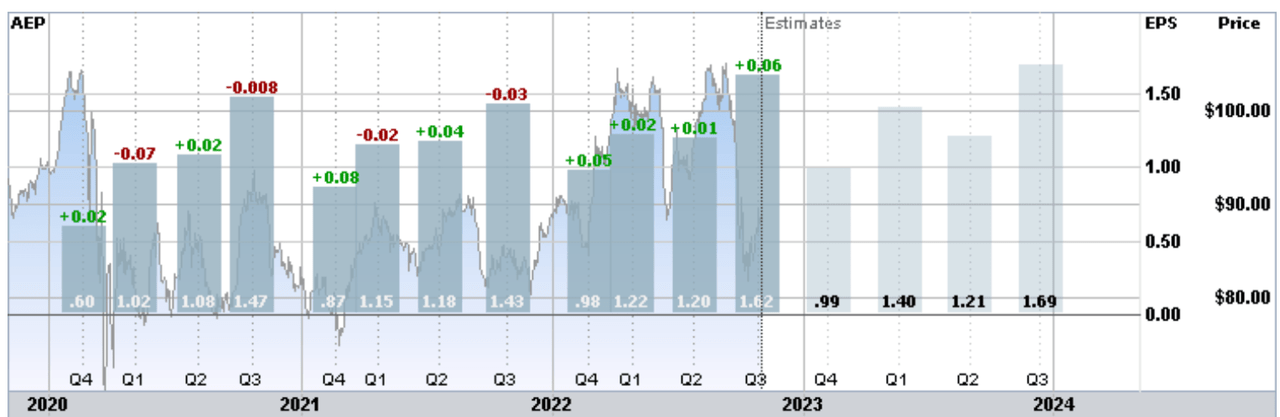
Historical (3 years) and estimated future quarterly EPS for AEP. Green (red) values are amounts by which EPS beat (missed) the consensus expected values (Source: ETrade)
I calculated the correlations between monthly total return for AEP and the percentage change in the 10-year Treasury yield. As expected, rising bond yields tend to correspond to negative returns. The correlation is -22% over the past 10 years and -16% over the past 20 years. These are fairly modest correlations, suggesting that the scale of the sell-off in the shares driven by interest rate expectations may be an overreaction.
I last wrote about AEP on February 11, 2022, at which time I rated the stock as a buy, even though interest rates were rising. At that time, the forward P/E was 19.1, as compared to 17.6 today. The Wall Street analyst consensus rating was a buy and the consensus 12-month price target corresponded to a total return of 15.8% over the next year. Along with looking at fundamentals and the Wall Street consensus outlook, I also consider the market-implied outlook, a probabilistic price forecast that represents the view implied by options prices. The market-implied outlook for AEP was strongly bullish to the middle of June and slightly bullish to January of 2023. The expected volatility calculated from the market-implied outlooks was quite low, 21%. I noted that the options trading volume on AEP was quite thin, so I interpreted the market-implied outlook with some caution. Even with the declines since mid-September, AEP is still up slightly since my post.
Seeking Alpha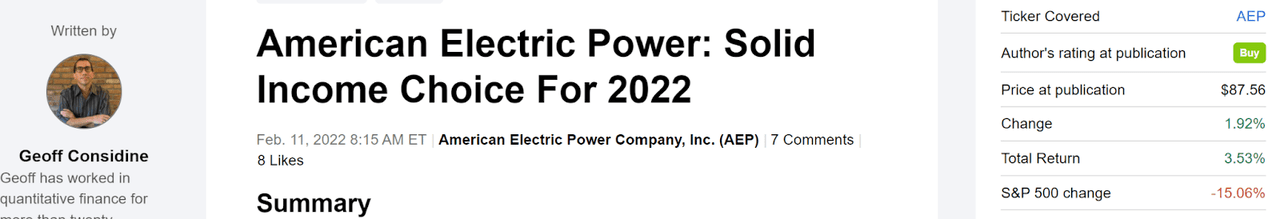
Previous post on AEP and subsequent performance vs. the S&P 500 (Source: Seeking Alpha)
For readers who are unfamiliar with the market-implied outlook, a brief explanation is needed. The price of an option on a stock is largely determined by the market’s consensus estimate of the probability that the stock price will rise above (call option) or fall below (put option) a specific level (the option strike price) between now and when the option expires. By analyzing the prices of call and put options at a range of strike prices, all with the same expiration date, it is possible to calculate a probabilistic price forecast that reconciles the options prices. This is the market-implied outlook. For a deeper explanation and background, I recommend this monograph published by the CFA Institute.
I have calculated updated market-implied outlooks for AEP and I have compared these with the current Wall Street consensus outlook in revisiting my rating.
Wall Street Consensus Outlook for AEP
ETrade calculates the Wall Street consensus outlook for AEP by aggregating the views of 9 ranked analysts who have published ratings and price targets in the last 3 months. The consensus rating is a buy and the consensus 12-month price target is 10.2% above the current share price, implying a 13.95% total return over the next year. The spread in the individual price targets is quite low, adding some confidence in the predictive value of the consensus.
ETrade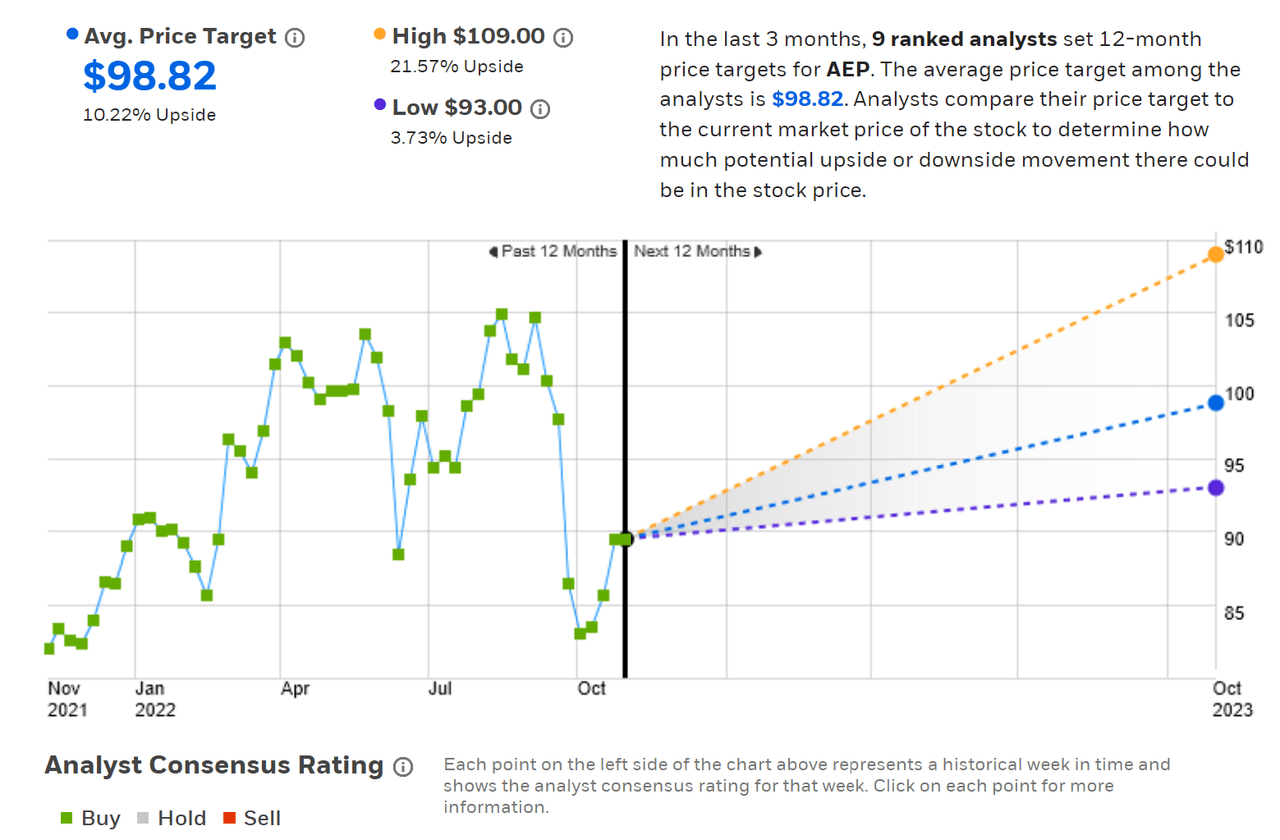
Wall Street analyst consensus rating and 12-month price target for AEP (Source: ETrade)
Seeking Alpha’s version of the Wall Street consensus outlook is calculated using the views of 18 analysts who have issued price targets and ratings over the past 90 days. The consensus rating is a buy, consistent with ETrade’s results, but the expected 12-month return is slightly lower (price return of 7.5%, total return of 11.23%).
Seeking Alpha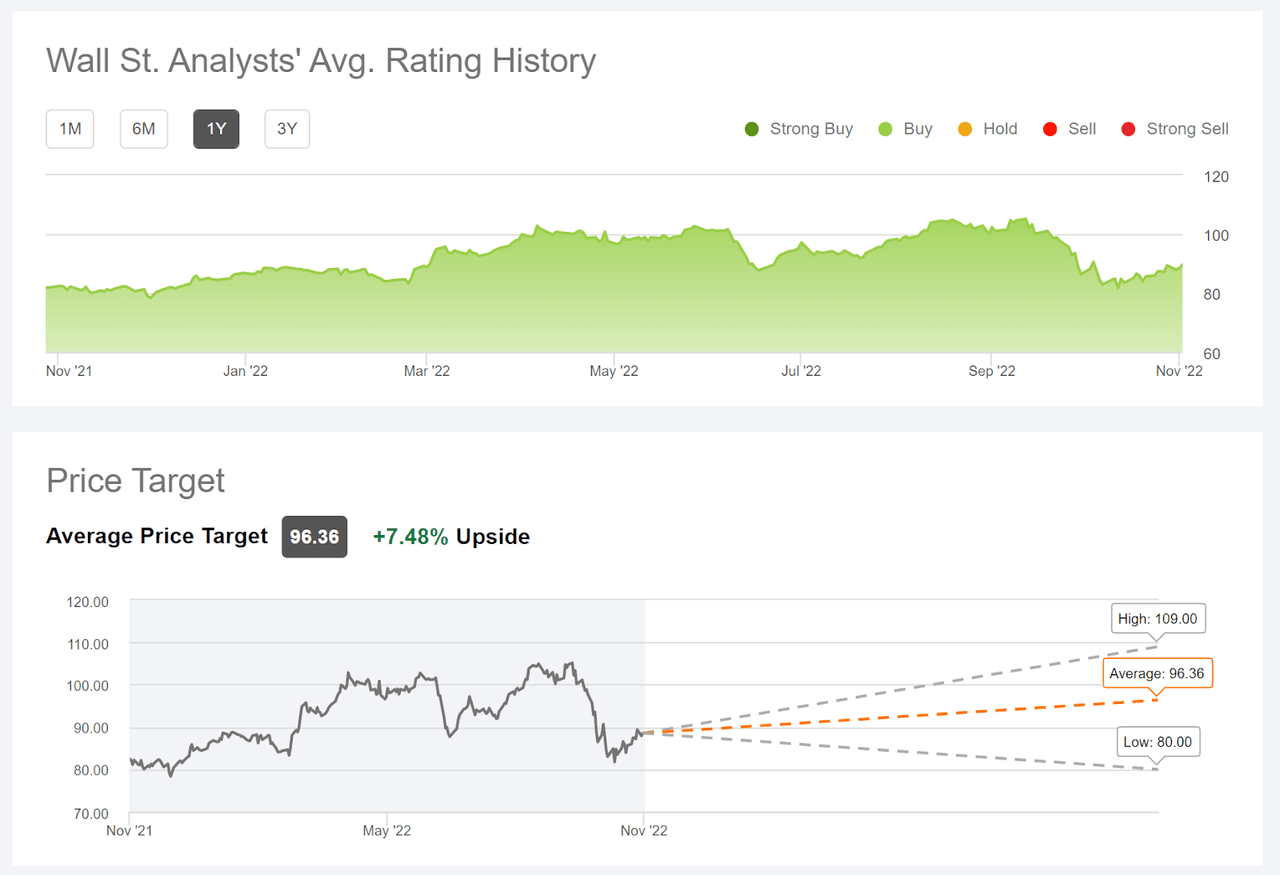
Wall Street analyst consensus rating and 12-month price target for AEP (Source: Seeking Alpha)
The Wall Street consensus rating on AEP has been a buy over all of the past year and the shares have significantly outperformed the broader market. Back in April, the Wall Street consensus corresponded to a total return of 18.4% over the next year. Today, the expected total return is 12.6% (averaging the consensus price targets from ETrade and Seeking alpha and adding the dividend). For context, AEP’s trailing 5-, 10-, and 15-year annualized total returns are 6.7%, 9.8%, and 6.5% per year, respectively,
Market-Implied Outlook for AEP
I have calculated the market-implied outlook for AEP for the 2.6-month period from now until January 20, 2023 and for the 14.6-month period from now until January 19, 2024, using the prices of call and put options that expire on this date. I selected these two expiration dates to provide a view through the end of 2023 and through the end of 2024. I typically like to include an outlook to the middle of the next year, but the options trading volume for May of 2023 (there is no June expiration date) was too thin for this to be meaningful.
The standard presentation of the market-implied outlook is a probability distribution of price return, with probability on the vertical axis and return on the horizontal.
Geoff Considine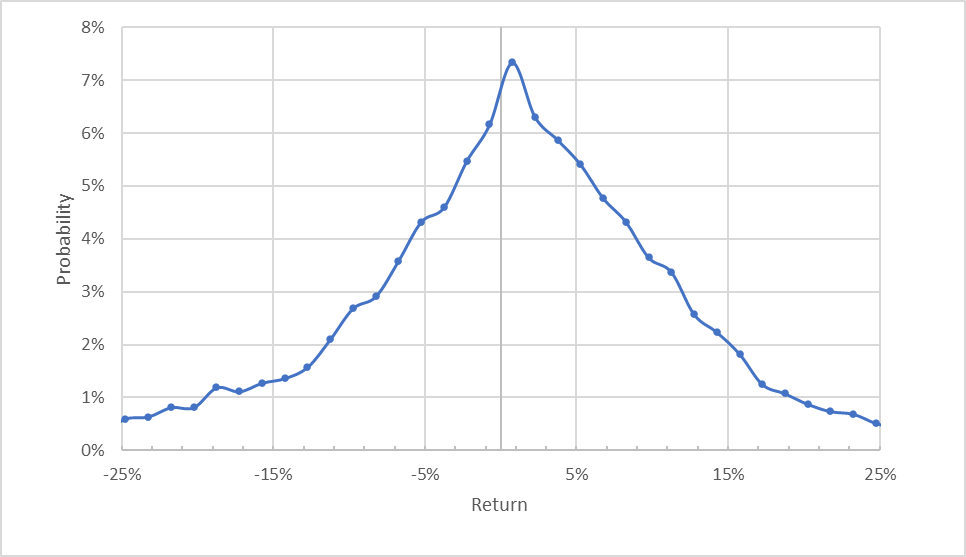
Market-implied price return probabilities for AEP for the 2.6-month period from now until January 20, 2023 (Source: Author’s calculations using options quotes from ETrade)
The outlook from now until mid-January of 2023 is very slightly tilted to favor positive returns, with the maximum probability corresponding to a price return of 0.75%. More notable, however, is the negative skewness which pushes up the probabilities of a range of returns. Compare, for example, the probability of having a +5% return to that of a -5% return. The expected volatility calculated from this distribution is 27.4%, notably higher than the value back in February (about 21%). This is quite a high level of volatility for a major utility.
To make it easier to compare the relative probabilities of positive and negative returns, I rotate the negative return side of the distribution about the vertical axis (see chart below).
Geoff Considine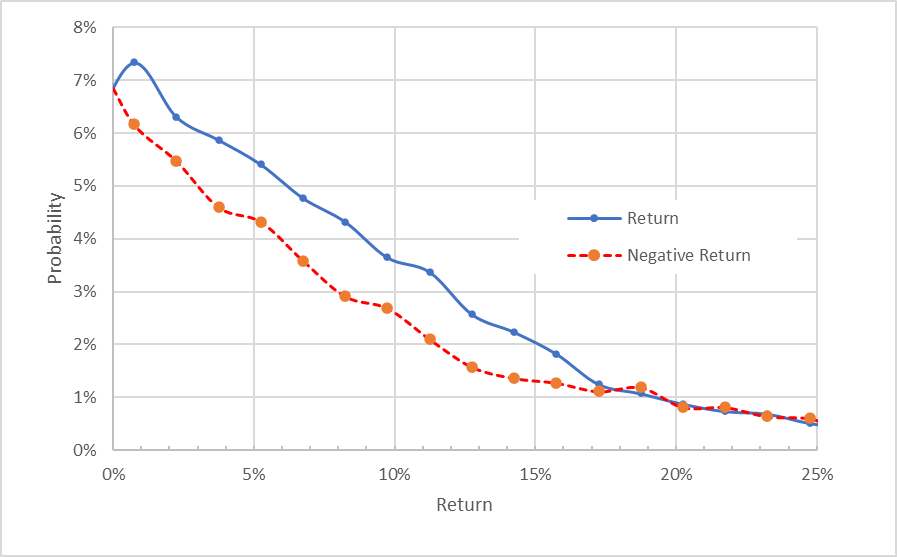
Market-implied price return probabilities for AEP for the 2.6-month period from now until January 20, 2023. The negative return side of the distribution has been rotated about the vertical axis (Source: Author’s calculations using options quotes from ETrade)
This view clearly shows that the probabilities of positive returns are consistently higher than the probabilities for negative returns, across a wide range of the most-probable outcomes (the solid blue line is above the dashed red line over the left ⅔ of the chart above). This is a bullish outlook for AEP.
Theory indicates that the market-implied outlook is expected to have a negative bias because investors, in aggregate, are risk averse and thus tend to pay more than fair value for downside protection. There is no way to measure the magnitude of this bias, or whether it is even present, however. The expectation of a negative bias reinforces the bullish interpretation of this outlook.
The market-implied outlook for AEP for the 14.6-month period from now until January 19, 2024 has probabilities of positive and negative returns that match fairly closely, although the probabilities of positive returns are more often elevated relative to those for negative returns than vice versa. This outlook is interpreted as slightly bullish. The expected volatility calculated from this distribution is 26.4%.
Geoff Considine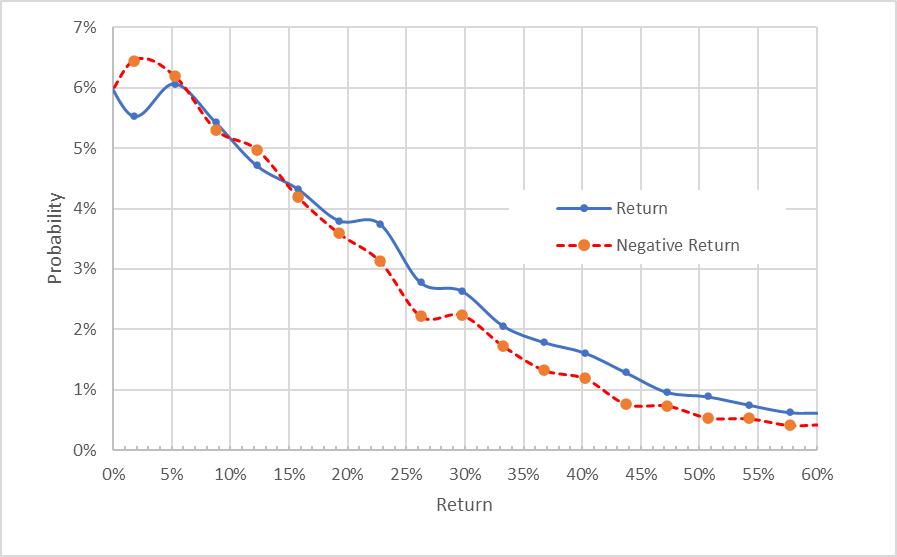
Market-implied price return probabilities for AEP for the 14.6-month period from now until January 19, 2024. The negative return side of the distribution has been rotated about the vertical axis (Source: Author’s calculations using options quotes from ETrade)
The market-implied outlooks for AEP continue to be bullish, although less for the longer-term outlook. The expected volatility is consistent between these two outlooks.
In my February analysis, I noted that I had sold covered calls against my position in AEP. With the rise in the expected volatility over the recent months raises the option premium income that selling the calls provides. As I have been writing this post, I bought shares of AEP for $90.40 and sold call options with a strike price of $90, expiring on January 19, 2024 for a premium of $10.28. This net position provides 10.93% in income (accounting for the $0.40 by which these options are in the money) over the next 14.56 months. In addition, I can expect to receive $3.32 in dividends (4 payments of $0.83), assuming no dividend increases, for an additional yield of 3.67%. Altogether, the total income is expected to be 14.6% over this period, for an annual income of 12%. There is a fairly high probability that the shares will be above the strike price when the options expire, in which case the options will be executed and my upside on the net position will be the income generated by selling the calls and from the dividends.
Summary
After a strong start to the year, shares of AEP fell rapidly in response to the Fed’s strong commitment to curbing inflation. Even so, AEP has performed far better than the overall market so far in 2022. The forward P/E has fallen since February. The Wall Street analyst consensus rating is a buy, as it has been for all of the past year. The consensus 12-month price target corresponds to a 12.6% total return for the next year. As a rule of thumb for a buy rating, I want to see an expected total return that is at least ½ the expected volatility (26%-27% from the market-implied outlook). Taking the consensus price target at face value, AEP falls slightly short of this threshold. The market-implied outlook is bullish to mid-January of 2023 and slightly bullish to mid-January of 2024. I am maintaining my buy rating on AEP. As discussed above, selling at-the-money covered calls has become increasingly attractive because of the elevated volatility in AEP at this time.
Be the first to comment