

FangXiaNuo
American Airlines Group Inc. (NASDAQ:AAL) is selling off slightly in pre-market trading, despite the company’s Q3 earnings beat and revenues that fell in line with consensus estimates. If anyone had doubts about the recovery in the travel business, they can now rest assured that the COVID-19 crisis is a thing of the past for airlines.
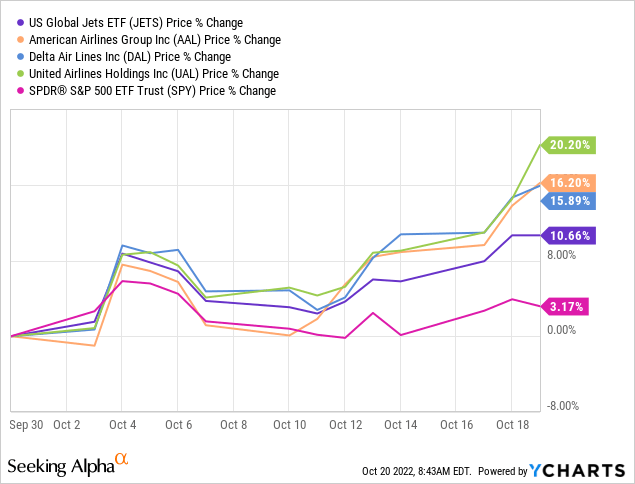
That said, I believe it is now time to look forward. Sentiment ahead of Q3 was probably overly downbeat, which helps to explain why the strong financial results delivered by the U.S.-based airlines so far have led to the sector (JETS) climbing 11% in October and rising (see below). Soon enough, strong demand will become old news, and momentum should give way to fundamentals-based investing – at which point I continue to see the airline sector as a speculative play, and AAL at a disadvantage relative to most of its key peers.
American Airlines impress in Q3
American’s earnings print did not deviate much from what some of its competitors had already posted in the past few days. Relative to the comparable quarter in 2019, before the start of the pandemic, passenger revenues climbed a respectable $1.4 billion from $11 billion, despite today’s challenging labor environment causing total capacity to be down nearly 10%.
Load factor of 85.3%, a metric that measures occupancy, nearly matched the comparable 2019 figure. This is clear evidence that the pandemic is no longer holding passengers back on their travel plans, although the figure still lagged what Delta Air Lines (DAL) and United Airlines (UAL) have reported by nearly two percentage points in both cases.
What propelled American’s revenue the most relative to 2019, let alone last year, were substantially higher revenues per seat flown: an increase of 25%. Clearly, passengers are reaching deep into their pockets to finally go on their summer vacations after a long COVID-19 winter. Again, this should not have been a surprise to analysts and investors, as Delta and United had already reported similar TRASM (total revenue per available seat mile) increases of 23% and 26%, respectively.
Two items caught my attention and set American apart from the other legacy carriers in Q3. First, CASM-ex (a metric that measures operating costs per unit excluding certain items, like fuel) increased 13.9% vs. 2019. While the number is high at face value, it is: (1) consistent with the realities of constrained capacity; and (2) better than what peers Delta and United have reported. This line may have contributed the most to American’s EPS beat.
Second, the company’s Latin America business, which usually accounts for roughly half of American’s international travel revenues, did much better than I expected. Segment revenues climbed 31% vs. 2019 on much better execution than Delta and United, while both revenue passenger and available seat miles (RPM and ASM) increased around 5% from pre-pandemic levels.
Now, look forward
After seeing Delta’s and United’s numbers in the past week, the easy part was to predict that American Airlines’ Q3 would be solid and fueled by strong demand in the summer months. The hard part is figuring out what happens next, particularly in 2023, as the global economies face rampant inflation, rising interest rates, and what consensus sees as an inevitable recession ahead.
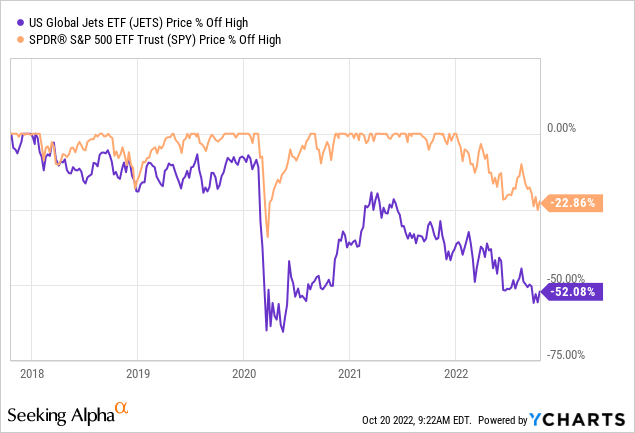
The airline industry is a notoriously cyclical business that tends to perform best during the early stages of economic expansion. Given the macroeconomic landscape, I believe that investors should be cautious when adding airline shares to their portfolios, even though the sector is trading cheaply after falling 50% from its all-time high of early 2018 (see below).
For the sake of diversifying a portfolio or maybe setting up long-short positions, I would probably choose DAL and UAL within the Big 3 legacy carrier group over AAL. This is the case because, during a period of uncertainty, I would favor quality over a more speculative approach.
The key factors that steer me away from AAL include: (1) a noticeably less robust balance sheet (see chart below); (2) unit margins that are the lowest within the direct peer group; and (3) an international mix that leans too heavily on Latin America and not enough on the more lucrative Atlantic business.
DM Martins Research, data from company reports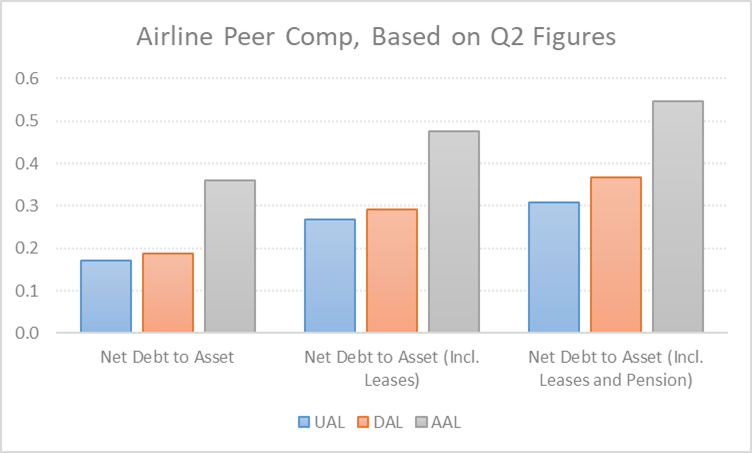
Be the first to comment