

jetcityimage
Investment Thesis
Amazon.com, Inc. (NASDAQ:AMZN) has been a victim of recent macroeconomic headwinds of rising interest rates, the Russia-Ukraine conflict, and supply-chain disruptions. In spite of all these headwinds, the company remains profitable in bottom-line margins and maintains a healthy cash balance on its balance sheet. This is in stark contrast to other smaller players in the same e-commerce industry like Sea Ltd (SE).
However, AMZN’s valuation by P/E looks alarmingly high when compared to other Big Techs like Meta Platform (META), Google (GOOG, GOOGL), and Microsoft (MSFT). However when adjusted for AMZN’s “growth CAPEX,” the company’s financial strength actually looks comparable to other peers in the comparison list.
When adjusted for “growth CAPEX,” AMZN’s negative free cash flow can be perceived to have a cash burn duration of close to 2 decades. This is assuming the company does not raise additional cash using non-operating means. Assuming that most investors’ investing horizon is not more than 2 decades, this cash burn rate is almost unlimited.
Company Overview
AMZN is a company that probably needs no introduction. It is one of the most dominant Big Tech companies in the IT industry. I wrote an earlier article titled: “5 Amazing Business Segments To Keep The Company On Top Of The Game” to describe comprehensively the overwhelming quality of its 5 main business segments. I will just briefly outline the main points:
- AMZN’s AWS cloud business dominates the cloud market by a wide margin, powering some of the most successful businesses in the world that are unlikely to go out of business. Examples include Netflix, HBO, Disney, Salesforce, and Adobe.
- AMZN’s e-commerce business dominates the online retail market share by a wide margin of 41%. The next ‘largest’ 11 companies do not come close. They are all having market shares in the single digits.
- AMZN’s advertising revenue is larger than even the most popular social media platforms of YouTube, Facebook, and Instagram.
- AMZN’s streaming subscription service has a subscriber base that is second only to Netflix. The subscriber base is higher than Disney+.
- AMZN’s “distribution and logistics” segment is on track to surpass UPS in U.S. package volume in 2022. In five years it is projected to have a logistics network so large that it won’t need to rely on UPS or the U.S. Postal Service.
Amazon’s Profitability
Amazon’s stock price has taken a beating, just like other tech stocks in the market due to the current macroeconomic headwinds. Here are some of the common reasons that have spooked investors.
Key Financial Figures (Seeking Alpha)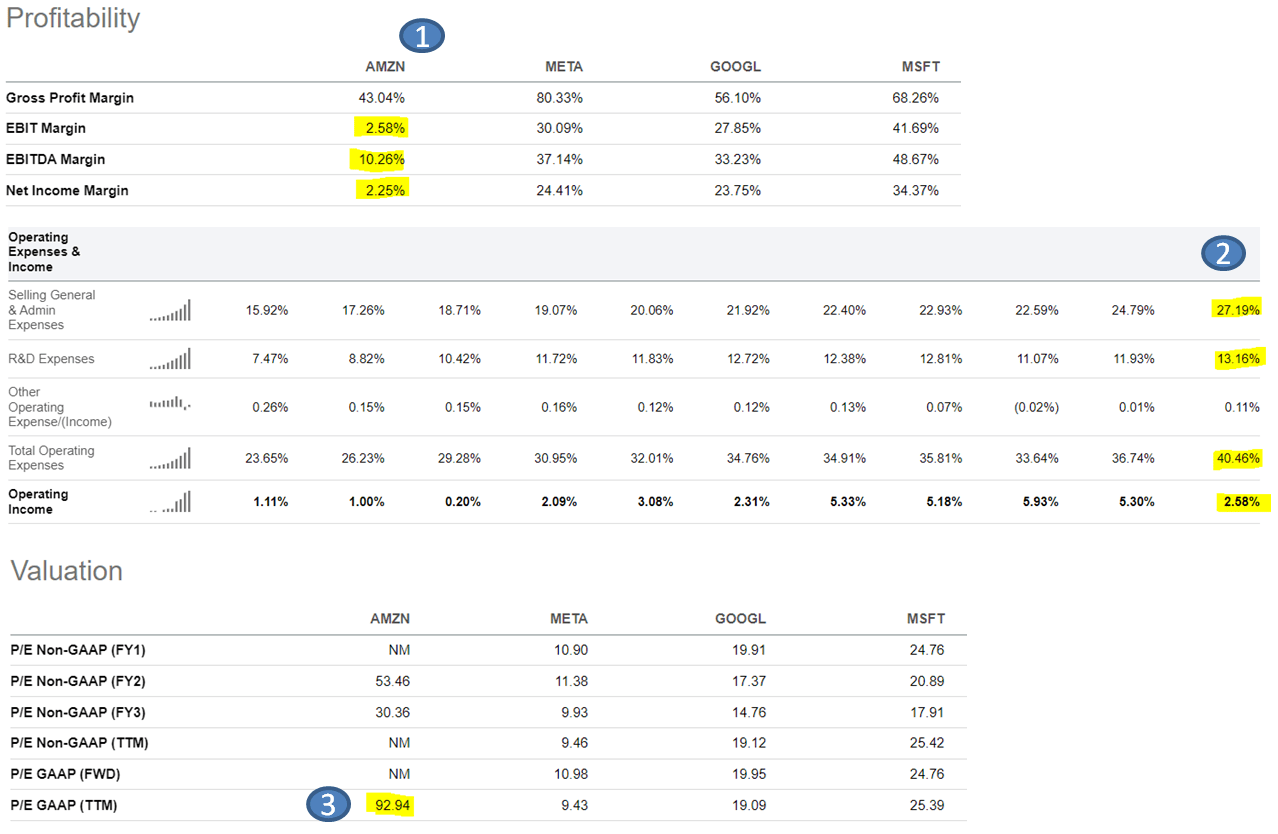
From the financial figures inferred from Seeking Alpha, we can understand that:
- In spite of the current macroeconomic headwinds, AMZN is still generally profitable by bottom-line margins. This is usually “great” for a “normal” company. But, as one of the world’s most valuable brands, most investors will not consider AMZN as a “normal” company. So, when compared to comparable peers of other Big Techs having net income margins in the twenties and thirties percentages, AMZN’s paltry 2.25% of net income margin is visibly much lesser.
- AMZN’s low bottom line margin is largely due to heavy investments in R&D, Selling, and General Admin. Although AMZN is a relatively mature business by market capitalization, it still incurs heavy expenses, similar to other smaller emerging growth companies. This might be one of the reasons why investors have reservations about the future profitability of the company.
- AMZN’s seemingly underperformance with respect to other big techs is further accentuated by the fact that its P/E ratio is a whopping 93 when its other peers are able to maintain a P/E range of 10 to 25
Generally, there are many companies right now that are struggling to maintain profitability due to macroeconomic headwinds of rising interest rates, supply chain disruptions, and Ukraine-Russia conflicts.
In my opinion, AMZN is not one of them. It is still profitable in the bottom line for most years since 2012, including the latest TTM period:
Income Statement (Seeking Alpha)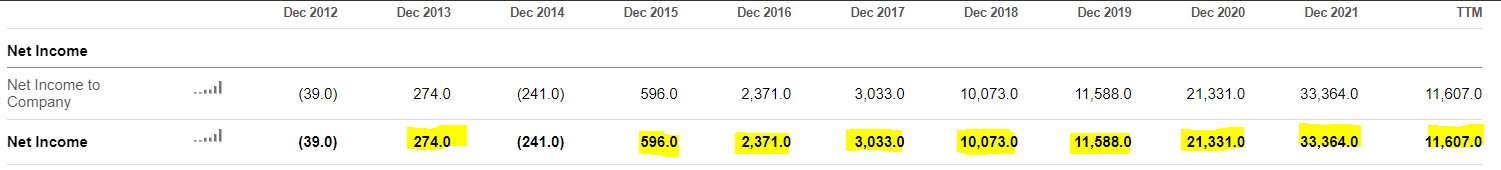
The company’s profitability only looks inferior only when compared to other big techs of similar size and business quality and scale.
Amazon’s Balance Sheet
Author’s Compilations (Seeking Alpha)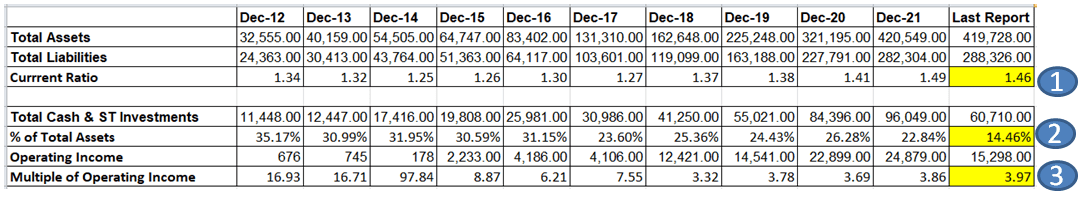
From the company’s balance sheet, we can understand that:
- It’s true that the company’s accumulated debt has been increasing over the years as inferred from the total liability. But the company’s continued investments have also resulted in a comparable increase in total assets in the same period. Overall, the accumulated increase in assets outstripped the increase in liability, resulting in a consistent current ratio that is greater than 1. which is generally “healthy.”
- AMZN’s cash balance is currently 60B, which is 14% of its total assets.
- The cash balance is close to 4 times its annual operating income.
Overall, the company still maintains a balance sheet that is largely “healthy.” Its latest current ratio is more than 1.4, which is one of the highest since 2012.
While AMZN’s cash balance has been consistently increasing every year since 2012, the company’s last reported cash balance of 60B is significantly lower than the high of 96B recorded at the end of 2021. Despite this unprecedented decrease, the amount of cash is still close to 4 times its annual net profits. In my opinion, this is still a decent amount.
Instead of growing its cash amount in its balance sheet, recently, the company decided to channel its profits to acquire more assets to expand its business even further. Since the company is not bleeding its cash reserves to maintain its recurring operating expenses, I think these expenses are reasonable.
Cash Burn Of Amazon Compared To Sea Limited
Both companies of Amazon and Sea Limited are in similar e-commerce space and both have been burning cash lately. As such, I think it is meaningful to compare how their cash burn rate fares with respect to each other.
Specifically, I want to know how much longer can they keep burning “negative free cash flow” before their “Total Cash & ST Investments” is fully depleted. This cash burning duration is calculated using “Total Cash & ST Investments” / “negative free cash flow” as shown in the table as “Cash Burn.”
Author’s Calculations (Seeking Alpha)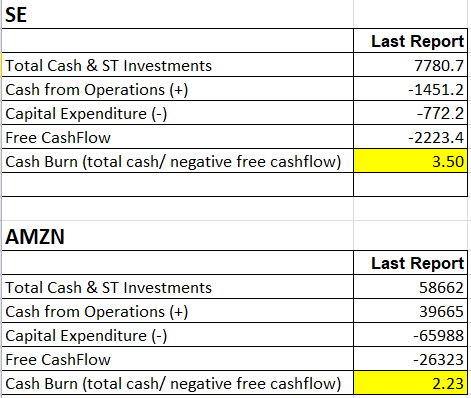
We can observe that:
- At one glance, it looks like SE can last longer than AMZN based on cash burn alone. (SE – 3.5 years vs AMZN – 2.23 years)
- But if AMZN wants to get back to positive free cash flow, it just needs to remove its extra ‘Capital Expenditure’ (“CAPEX”) used for future growth. It can easily become profitable simply by relying mostly on its current Cash from “Operations.”
- For SE, even if it removes all its CAPEX, its “Cash from Operations” is still not positive. That means even without expense in future growth, which is mostly recorded in CAPEX, its current operations are already drawing down its cash from its balance sheet.
In other words, AMZN can have cash going into its balance sheet every year just by drastically reducing its CAPEX, effectively foregoing investments in “future growth” and relying solely on its current operating cash flow.
For SE, even without spending on future growth, its current core operations are still eating into its cash balance, which demonstrates a more dire financial situation to deal with than AMZN.
Adjusting Free Cash Flow With Maintenance CAPEX
The earlier calculations of Cash Burns were made using the full CAPEX figure at face value. According to Divestopedia, there are 2 kinds of CAPEX: “growth” and “maintenance”:
Growth capex = Total capex – Depreciation (which is a proxy for maintenance capex).
Generally, growth CAPEX is used for future expansion which is expected to be short-term while maintenance CAPEX will persist in the long run and is needed to maintain its existing operations.
If we try to separate the Growth and Maintenance CAPEX, it would look like this:
Author’s Calculations (Seeking Alpha)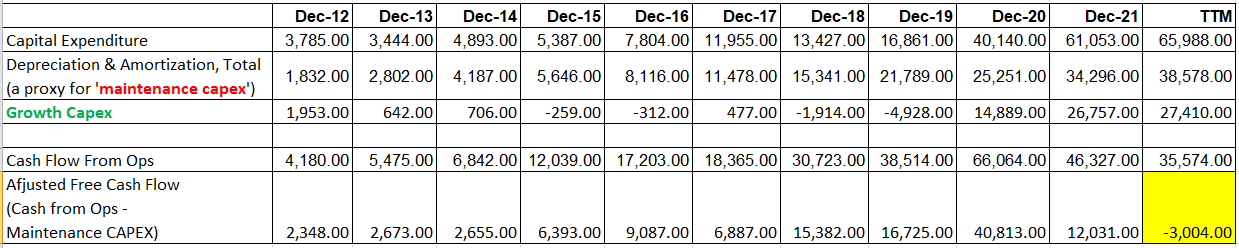
In the same table, I also assumed that AMZN’s CAPEX will only consist of maintenance CAPEX and calculated the free cash flow base on this assumption.
Author’s Calculations (Seeking Alpha)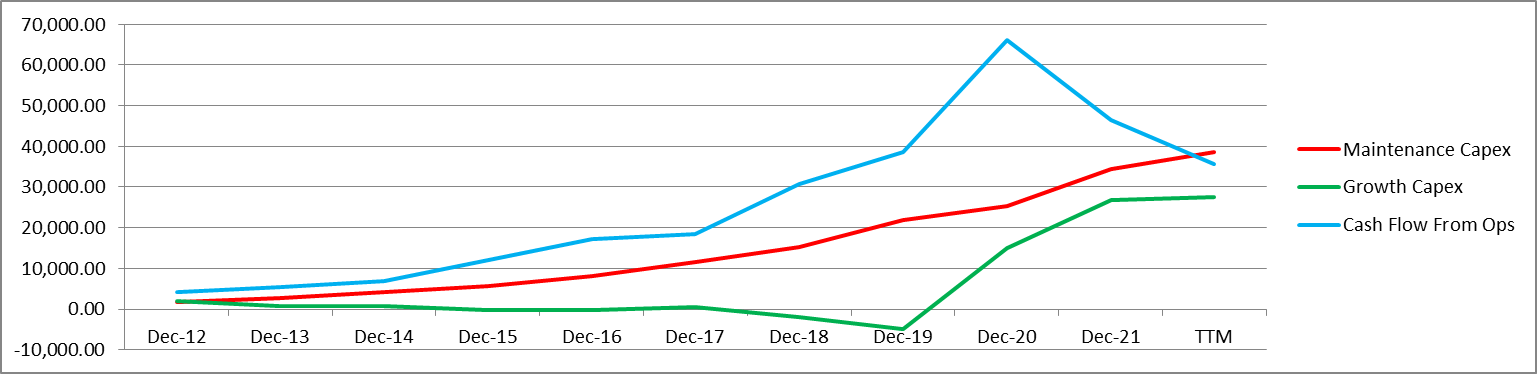
If we represent all these visually on a graph, we can understand that:
AMZN’s annual cash flow from operations has historically been higher than its maintenance CAPEX for the last 10 years and only dipped slightly below it during the latest TTM, resulting in a slight negative free cash flow. Investors should observe whether this downtrend will persist in the long run.
Let’s just assume that this latest (adjusted) negative free cash flow will persist and use this figure to calculate the Cash Burn using the same method as we did earlier.
Author’s Calculations (Seeking Alpha)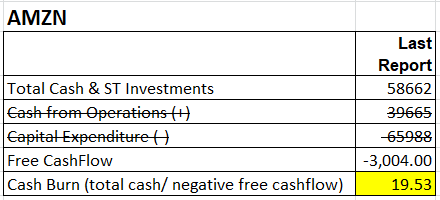
Now, we can see that AMZN has enough cash balance to burn for the next 2 decades (in theory). This is much more favorable than the earlier cash burn figure of just 2.23 years or SE’s cash burn of 3.5 years.
In summary, if we assume AMZN “rests on its laurels” from now onwards and stop investing in future growth CAPEX, its current cash burn in negative free cash flow is almost unlimited since I believe very few investors have an investment horizon of more than 20 years.
If its current growth CAPEX bears fruits, its future cash flow from operations might increase higher than its maintenance CAPEX (as it did historically), resulting in positive free cash flow and increasing cash balance.
Adjusting P/E Multiple With Growth CAPEX
Earlier, we discussed that AMZN’s growth CAPEX is close to 27.4B and this amount will not exist in the company’s expense if it ever chose to “rest on its laurels” without investing in future growth.
Now, we will discuss how the company’s P/E multiple will fare with other comparable Big Tech companies if this growth CAPEX is adjusted back to the company’s net income.
This is the current EPS and P/E of AMZN when compared with other comparable Big Techs:
Author’s Calculations (Seeking Alpha)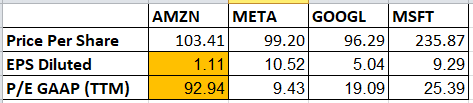
At one glance, we can see that AMZN’s EPS (at 1.11) is visibly much lesser than other peers. The P/E is also a whopping ~93 compared to other peers which are just in the low 2-digit range.
Since the 27.4B of ‘growth CAPEX’ is expected to be short-term spending, it is reasonable to exclude this spending to get a normalized perspective of AMZN’s profitability. If we do that, AMZN will have an additional EPS of $2.7 per share.
Author’s Calculations (Seeking Alpha)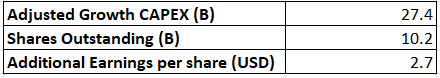
If we add this additional EPS back to the previous table, the P/E will then look comparable to other peers in the comparison list, just slightly lower than GOOGL. The PE is now comparable to MSFT:
Author’s Calculations (Seeking Alpha)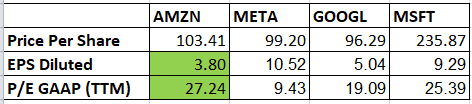
From this perspective, AMZN appears to be fairly valued with respect to other peers in the comparison list.
Valuations Using Sum Of Parts
The company broke down the revenue figures of its different business segments on its Investor Relations (“IR”) website. At one glance, we can see that the “Y/Y% Change” of all its business segments is still growing significantly despite the current macroeconomic headwinds.
Sales Revenue By Segments (Company Investor Relations Website)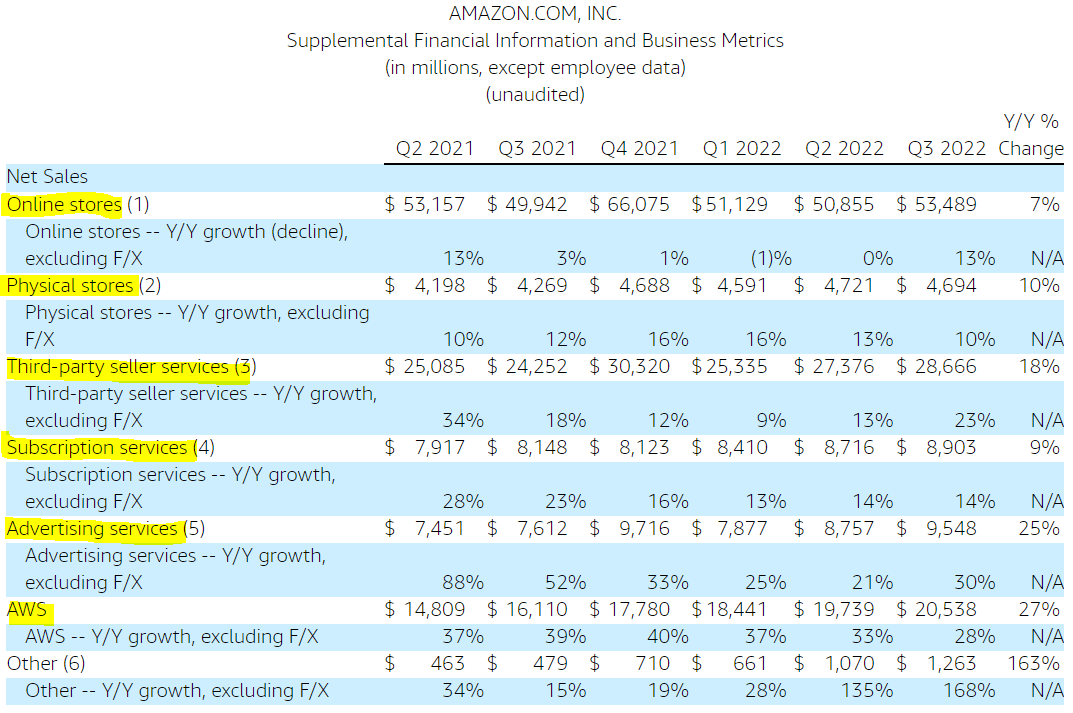
Using these figures and some estimated “Operating Margin” and expected “P/E” for each segment, I calculated the valuation of AMZN using the Sum Of Parts model.
Author’s Calculations (Investor Relations Website)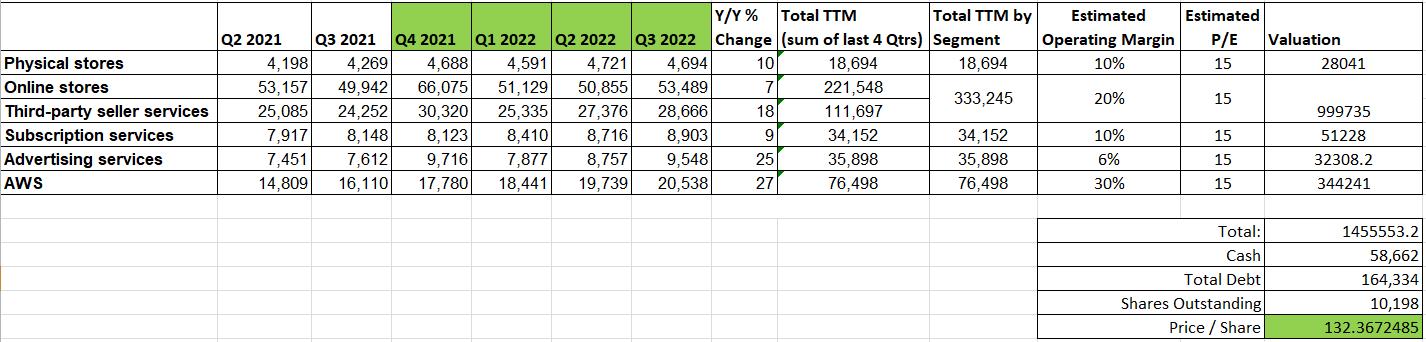
- The operating margin for its AWS segment has been explicitly reported to be 30% for the latest quarter on its IR website.
- Other margin figures are estimated based on my own opinion, referencing comparable industry EPS figures from Finviz.
- I have assumed all the segments will be priced based on the market average PE of 15.
The current price of close to $100 implied the stock is currently undervalued, presenting a good buying opportunity.
Risk
The huge CAPEX of AMZN is still the greatest risk for the company as I pointed out in my previous article. From the latest earnings call, management offers investors a sign of relief by announcing a significant reduction in CAPEX spending in the specific area of “fulfillment and transportation” (emphasis added):
For the full year 2022, we expect to incur approximately $60 billion in capital investments, which is broadly in line with what we spent in 2021. This represents an estimated reduction in fulfillment and transportation capital investments of approximately $10 billion compared to last year, as we’ve continued to moderate our build expectations to better align with demand. And this is offset by an approximately $10 billion year-over-year increase in technology infrastructure, primarily to support the rapid growth, innovation and continued expansion of our AWS footprint.
Although this cost reduction is offset by its increased spending to strengthen its AWS infrastructure, it indicates the company’s intention to progressively reduce its overall CAPEX.
With a cash-rich balance sheet, the company can still sustain a negative free cash flow for a long time as I discussed earlier. However, it might still take a few more years. Investors should be aware of this short-term risk and be patient.
Conclusion
Many companies like Nokia (NOK) used to be great and dominate the industry it operates in. Unfortunately, Nokia fails to innovate fast enough and eventually ceded its market dominance to Apple, when it launched its new revolutionary smartphone products.
In spite of having 5 great businesses as discussed in my previous article, AMZN does not want to “rest on its laurels” and risk becoming obsolete like Nokia. It invested greatly in growth CAPEX to maintain and capture even greater market shares to keep itself on top of the game.
Some companies like SE also have the ambitions to expand greatly internationally but lack the resources to do so in an environment of global headwinds. Towards the end of 2021, SE has been scaling back much of its international business to “improve efficiency.”
AMZN is not in such a dire situation as SE. It has both the ambition and financial capability to expand its already (relatively) successful business segments, even in the current global headwind.
The stock is currently undervalued, but the high spending in CAPEX might still persist for another 1 to 2 years. In my opinion, investors should consider this a great long-term investment opportunity.
Be the first to comment