

Michail_Petrov-96
Thesis
Readers familiar with our writings probably have already noticed two things about our investment already.
First, we have been concerned about the high valuation of Amazon (NASDAQ:AMZN) over the past. As you can see from the following chart, we have been cautioning readers since last year about its valuation risks (together with a few other short-term issues such as negative cash flow and rising fuel costs) over the past. Since then, its prices have corrected substantially from a peak of around $180 to a low of ~$100 recently.
Secondly, we are patient and disciplined investors. And moreover, being humans, we know that we cannot rely on our brains to enforce patience. It’s simply our brains’ nature to want to be impatient. So we have accumulated a checklist, or you can call it a cheat sheet, to aid us and help others with investment decisions. The ideas on the checklist probably deserve a separate article by itself. Today I will just highlight one item on the checklist, our patient test, under the context of AMZN.
It is a simple test. It simply looks for a so-called consolidate window (the yellow box shown below for example), and we give a stock extra thought when it has been trapped in a narrow consolidate window for at least 1 year. The idea has been detailed in our blog article here together with our other past cases (such as Lockheed Martin, British American Tobacco, et al).
Source: author based on Seeking Alpha.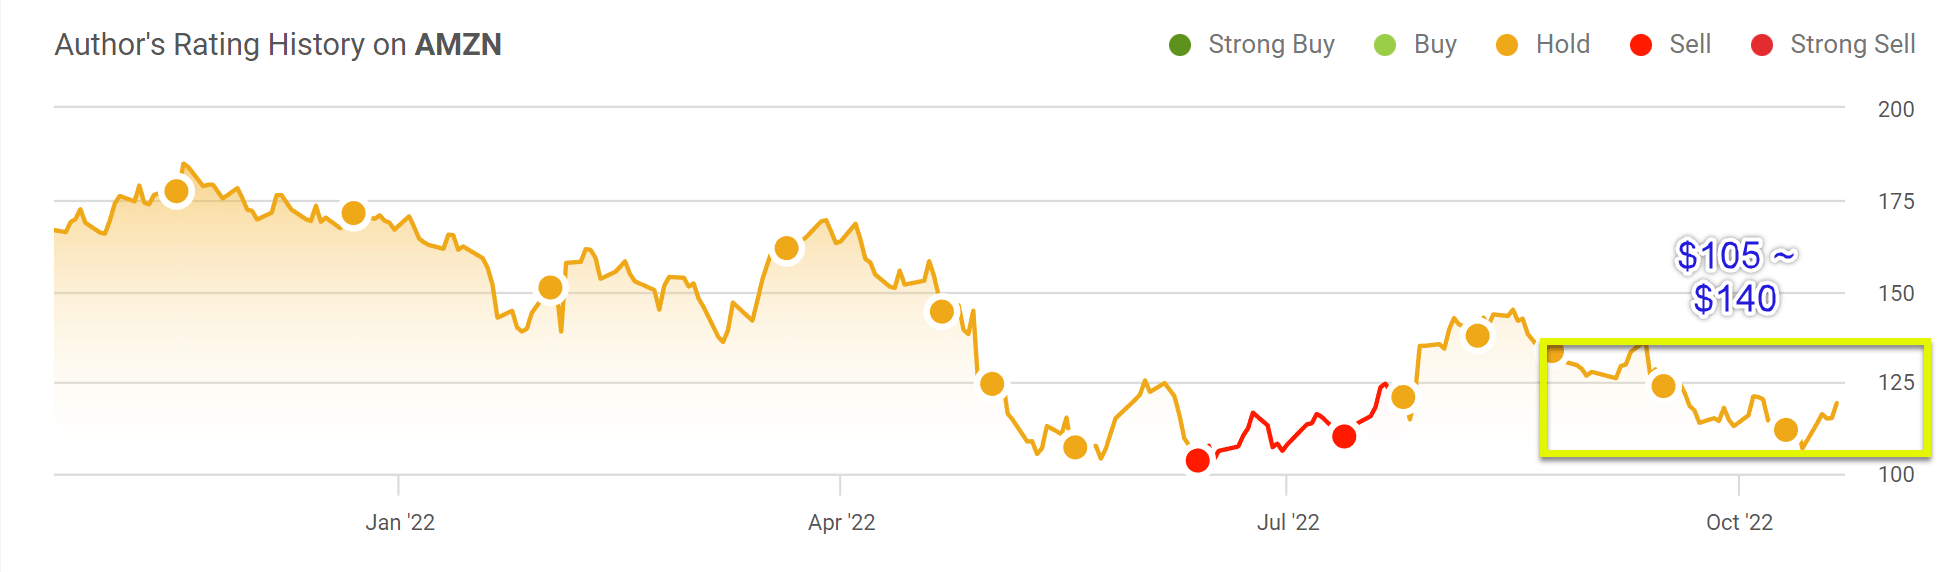
Specific to the AMZN stock, it has been trapped in a consolidation window between $105 and $140 since April/May 2022 as shown in the figure above. So it has spent about 1/2 a year in this window, getting close to passing our patient test and becoming interesting. An easier way to see the patient test is to use a Point & Figure Chart (“PFC”) like the one shown below. It’s an effective tool that long-term investors should learn to read in addition to (or instead of) the common price charts. You can find a detailed tutorial here and I will just point out a few highlights specific to AMZN here, which are the main considerations for the thesis in this article:
- The PFC charts filter out the daily noises and let investors see the long-term trend more effectively. For example, this chart condenses about 3 years’ worth of AMZN’s price movements into a few columns of Os and Xs. And you can also better see that the stock has been trading between $105 and $140 since April/May 2022.
- Combined with the volume information, you can also easily see where/when the heavy trading occurred and get a good sense of the dominating market sentiment. For example, in the case of Amazon here, you can see that during April/May, it was traded at a heavy volume of 2.5 billion shares during a sharp price decline from ~$167 to a bottom of ~$103. The next heavy trading window occurred in August with 1.8 billion shares changing hands when the price rallied from $110 to about $145. Note that this heavy trading occurred in a narrower range than April/May trading, suggesting the stock is entering a consolidating phase and the market is not sure what to do about it. And as long-term investors, this is what we’d like to see.
And next, we will explore the implications of such a patience test should AMZN pass it.
Source: author based on stockcharts.com data.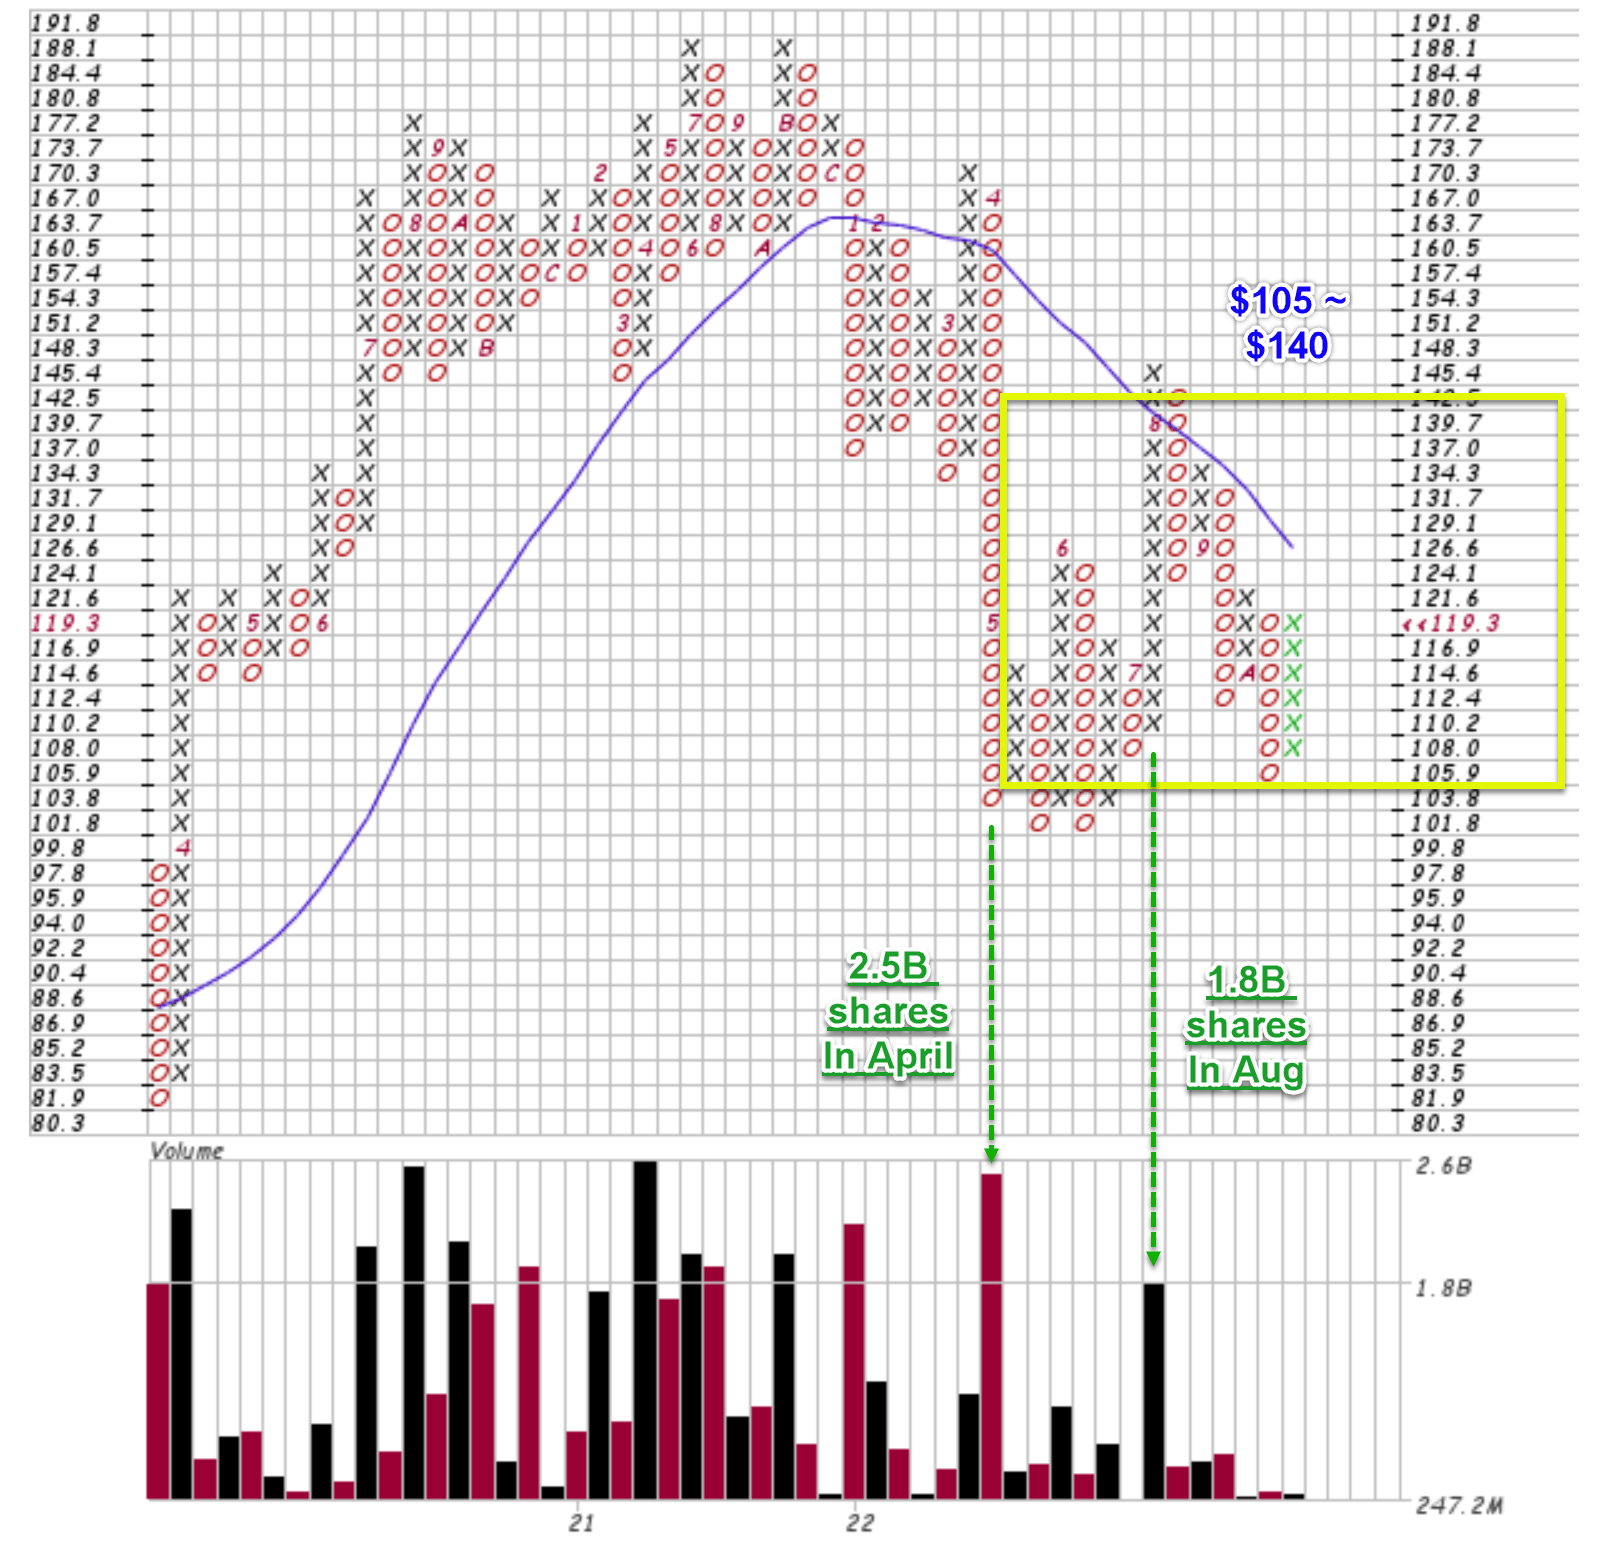
Amazon Stock Valuation Projections
First, such a price range would translate into a much more reasonable valuation for AMZN as you can see from the following table below. The consensus estimates project its EPS to be $2.23 in 2023 and to gradually grow to $9.49 in 2027. So the implied PE at a price of $105 is only 11.1x in five years and only 14.8x even at the upper bounds of the price range of $140.
Source: author based on Seeking Alpha data.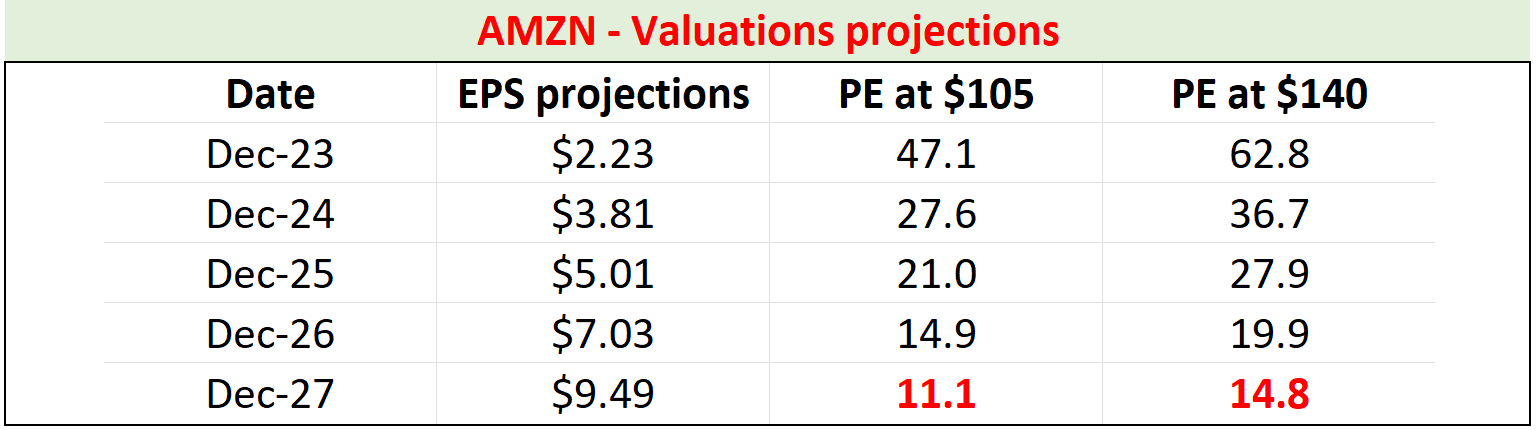
Growth and margin projections
Then next let’s examine closely if the above EPS growth and valuation projections could be supported by its business fundamentals. The consensus estimates also project its revenues to be $596B in 2023 and to grow to $974 in 2027. So if we assume its number of shares to be constant at the current level of 1.02 billion shares outstanding, then we can compute its profit margin as shown in the table below. As seen, its profit margin would gradually expand from 0.38% to 0.99% in the next five years.
Source: author based on Seeking Alpha data.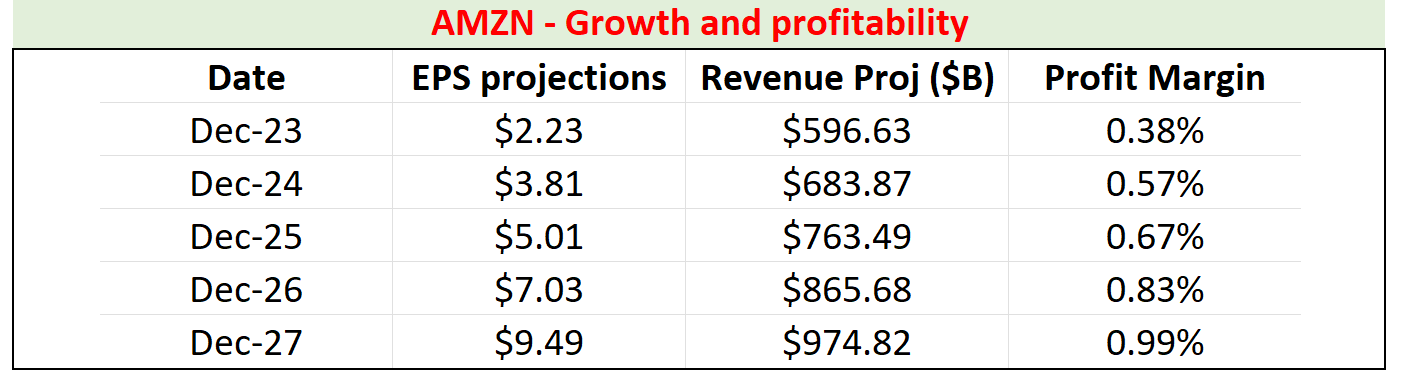
I view such an expansion as very feasible based on its historical record and also its peers as you can see from the following chart. The top panel shows that once AMZN became profitable around 2016, its profit margin has been above 2% most of the time. And as seen from the mid panel, such a margin is quite consistent with more mature retailers like Walmart (WMT), whose average margin over the past 10 years has been 2.7%. Finally, the bottom panel shows Alibaba (BABA) as a foreign counterpart of AMZN. BABA’s margin has been on average 31% over the past 8 years (which invited regulatory attention). But even after tightened regulations, its margin still stands at 4.6%, far above the projected 0.99% margin for AMZN.
Source: Seeking Alpha data.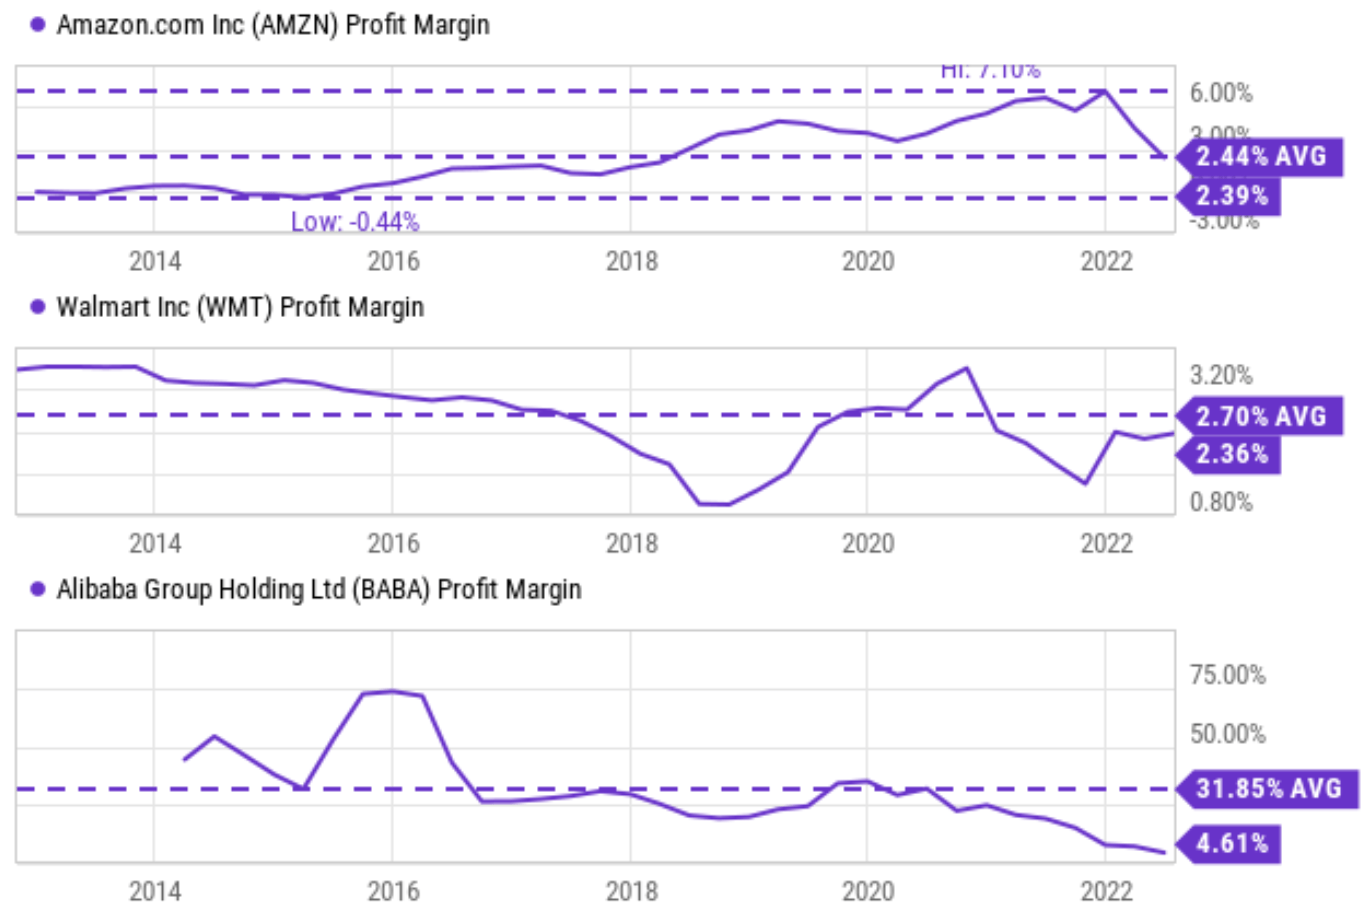
Finally, note that the above consensus estimates projection translates into a 10.3% CAGR growth rate in the top line and a 33.6% growth rate in EPS. Investors should not be too alarmed by the 33.6% EPS growth rate. It is indeed very high on the surface, but it is achievable once you consider it only requires 10.3% topline growth and a modest margin expansion which would be still below its peers and its historical averages. And there are plenty of catalysts to support both topline growth and margin expansions. A few key catalysts in the next 5 years include A) the secular growth of eCommerce market share gains both in the U.S. and overseas, B) AMZN’s successful track record of improving efficiencies, and C) also its track record of identifying high-margin and high-growth investment opportunities besides its retail and cloud computing segments. Specific and immediate examples of these long-term catalysts include:
- It has been rapidly expanding its cloud infrastructures into both new geographical and service segments.
- It has also been investing aggressively in its Prime Video content, and several of its shows are gaining momentum and are among the most popular shows.
- At the same time, it also announced that it will acquire the primary care organization One Medical. The deal marks another expansion into healthcare services,
Risks and final thoughts
in the near term, I see a range of uncertainties to pressure its profitability and also keep trapping its prices in a consolidation range. I anticipate macroeconomic factors such as inflation, supply chain pressures, and also currency exchange rates headwinds to keep challenging the operating environment in the remainder of 2022 and persisting well into 2023. The cost to ship containers overseas continues to be at an elevated level, and so does the cost of fuel and labor. The increasing AWS energy costs and also the incremental Prime Video content investment will both cancel off some of its profit gains.
To conclude, as patient and disciplined investors, we do not trust our own brains to override themselves. Some simple rules have proven to be effective to guide us against pitfalls. One of them is a patient test. After being concerned about AMZN’s valuation risks for more than a year, now we begin to see it both at a more reasonable valuation and also on its way to passing our patient test. It has been spending about 6 months in a consolidation window between $105 and $140 since April/May. If it spends another 6 months or so in this window, it could become an interesting opportunity considering its valuation implications and also its growth potential.
Be the first to comment