


Thomas Barwick
DISCLAIMER: This note is intended for US recipients only and, in particular, is not directed at, nor intended to be relied upon by any UK recipients. Any information or analysis in this note is not an offer to sell or the solicitation of an offer to buy any securities. Nothing in this note is intended to be investment advice and nor should it be relied upon to make investment decisions. Cestrian Capital Research, Inc., its employees, agents or affiliates, including the author of this note, or related persons, may have a position in any stocks, security, or financial instrument referenced in this note. Any opinions, analyses, or probabilities expressed in this note are those of the author as of the note’s date of publication and are subject to change without notice. Companies referenced in this note or their employees or affiliates may be customers of Cestrian Capital Research, Inc. Cestrian Capital Research, Inc. values both its independence and transparency and does not believe that this presents a material potential conflict of interest or impacts the content of its research or publications.
Let’s Dive Right In
As you know from the stock price, Amazon’s earnings were terrible. Right?
Well, not so much actually. Before we hit you with the tables and the charts and blah, let’s just get right to the problem here. The problem is (1) North America costs (2) International revenue weakness and (3) capex, meaning, far too much of it.
We don’t normally care to just copy/paste stuff from company reports into our notes, on account of everyone reading our stuff can just read the reports themselves. Our job is surely to say something useful about the numbers, not just regurgitate them here.
That said, this exhibit in AMZN’s earnings reports is essential viewing. It tells you where the malaise is. North American expenses and International revenues. The former are too high and the latter, too low. AWS (the compute services business) just kept on truckin’.
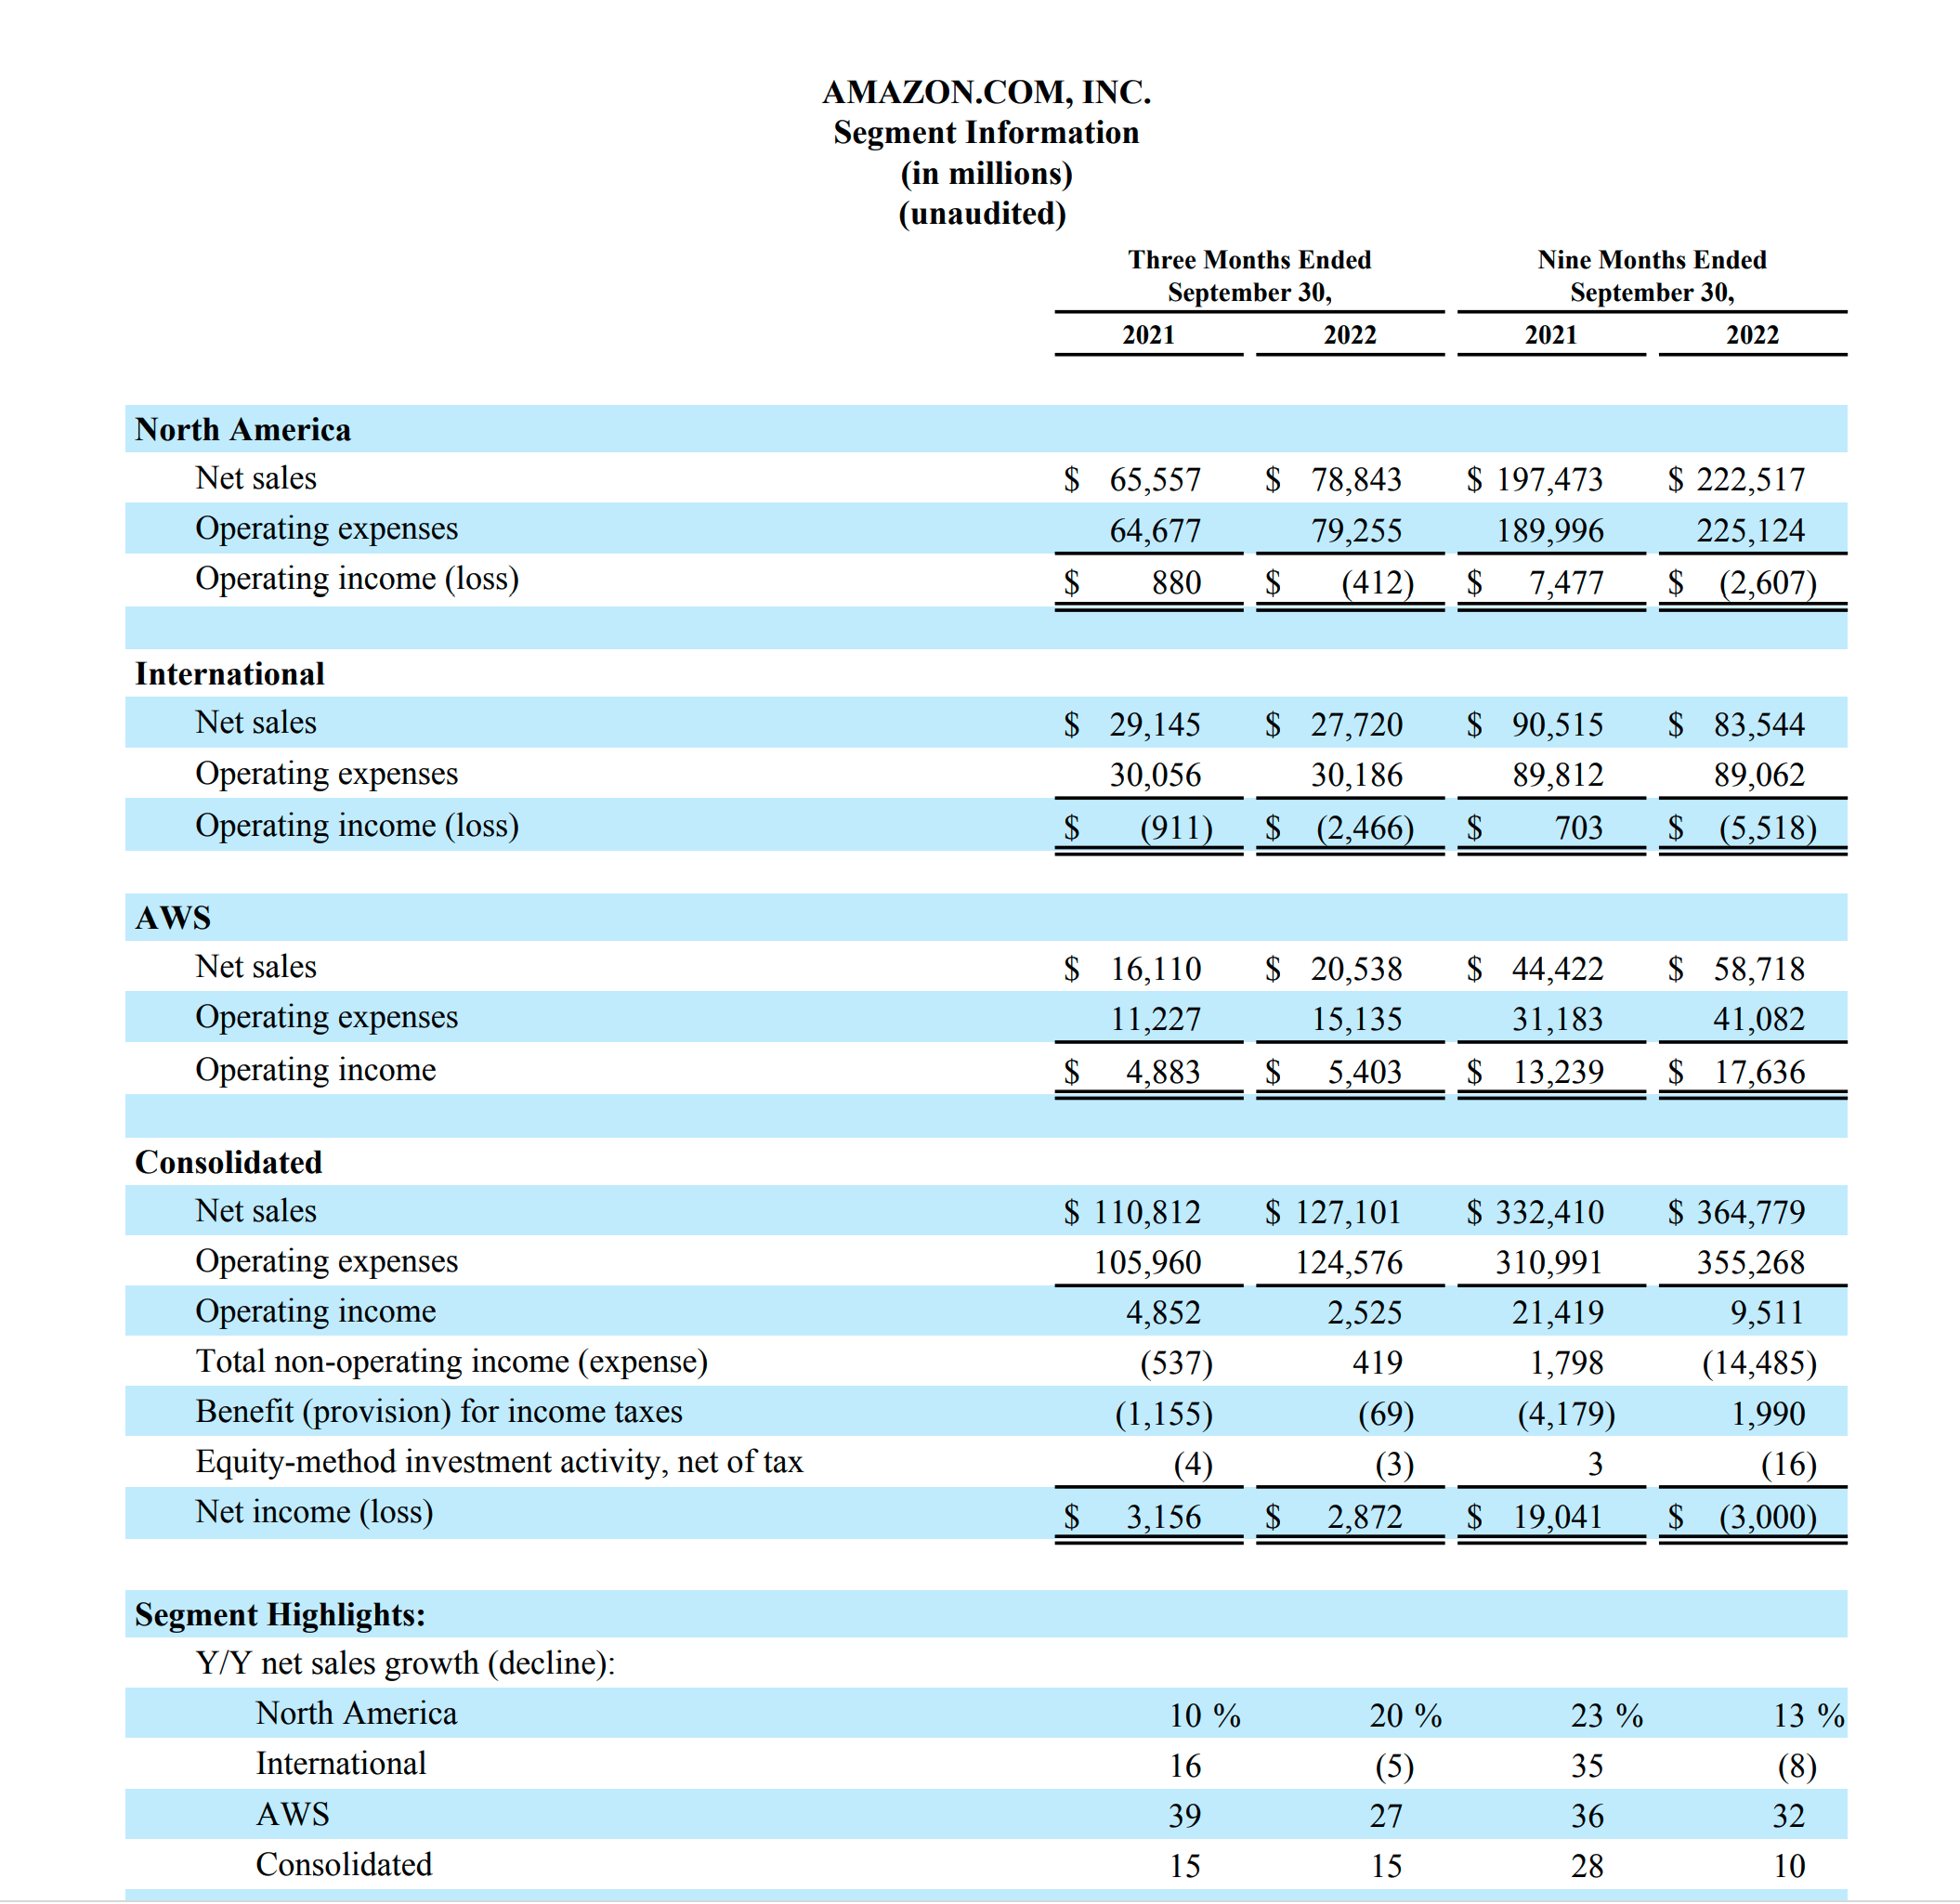
AMZN Segment Information (Company SEC filings)
Now, if you were sat around the Amazon boardroom table, you wouldn’t mind this too much. You would say, well, the cash machine – AWS – is in great shape. It’s still growing revenues at 32% despite having a huge revenue base of $16bn/quarter. And it’s not like cloud is going away anytime soon. So, you would say, despite an apparent Great Recession coming our way in North America, both we and Apple Corporation are growing revenues faster now than last quarter; that bodes well for the coming quarters because it looks like GDP growth just turned positive. So all we have to do in North America is cut costs. Easy. International? The dollar isn’t exactly helping. So, cut costs and sit back to see what happens with FX and indeed with non-American economies.
That might sound difficult from afar but it is corporate 101 for senior execs. The question is, will they take the hard decisions and will they cut costs fast enough? We can’t answer that; we have to wait for the coming quarters’ reports. What they should do is hack cost out fast, particularly in North America where the frictional costs of headcount reduction are way lower than in other territories.
The other problem here is capex. Yikes. Look.

AMZN Capex % sales (YCharts.com)
Capex was 5% of revenue in the December 2018 quarter; now 13% of revenue consistently into the face of a slowdown in growth. Not a good look. Capex has to come down, pronto, or evidence that it is ushering in more rapid growth, now.
So, the task at hand is simple in our view.
One, let’s assume the US economy isn’t going to hit the skids. So the North America revenue line should be fine as should AWS. International may be weak for some time perhaps. So, cost down in the US and cost down in International.
Two, let’s assume AWS is going to be fine. Leave well alone and keep its sales and operational execution excellence intact.
Three, cut capex across the board.
End of. Easy to say, not so easy to do, but not rocket science either. Corporate management 101.
OK, so now the tables and suchlike.
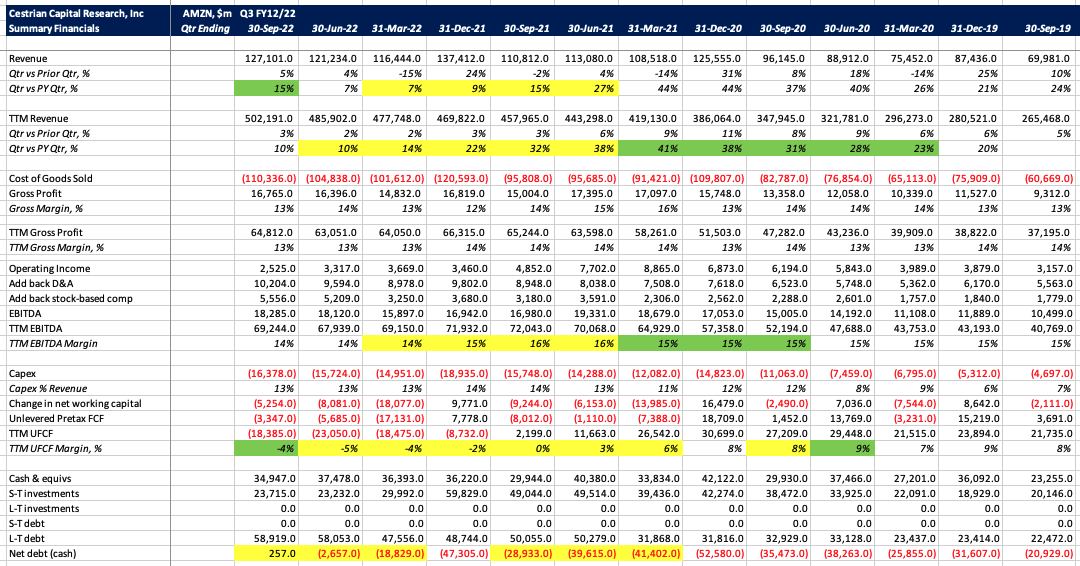
AMZN Financials (YCharts.com)
A few highlights here.
- Growth accelerated – as did AAPL revenues this quarter. That is a strong leading indicator of success. Costs are controllable to a much greater extent than revenue. If revenue growth is accelerating, other problems become easier to solve.
- Gross margins and EBITDA margins held steady whilst unlevered pretax free cash flow margins increased just a touch.
- The company balance sheet is now in a net debt position. It’s not a meaningful amount of debt, but it just shows how much money has been burned on capex and excess operating costs.
The valuation is fine but it highlights the negative TTM unlevered pretax FCF which ought not to be the case.
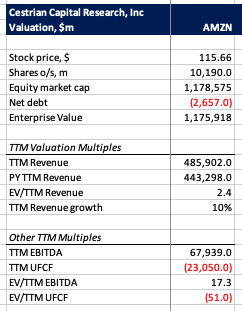
AMZN Valuation (YCharts.com, Company SEC filings)
The stock chart blew through the levels set pre-earnings (for which see the technical setup here). It looks like AMZN may be joining the 786 club – those stocks which in 2022 have delivered unsuspecting investors a 78.6% retracement off of key levels. AMZN looks like its larger-degree Wave 4 down in the 5-wave up cycle from early 2017 may feature a 78.6% retracement of Wave 3. That is what is known as brutal. It’s also what’s known as a place from which rapid moves up can also been seen. If you’re interested in buying or adding to AMZN at this point, we can see plenty of upside; to protect your downside, if it was us, we would place a stop a little below that 78.6% retracement level of $93 or so. That’s a tight stop but we think that’s appropriate. The chart setup below indicates that new all-time highs are possible within a couple years but only a fool or a child would pursue that goal absent any risk management. If the stop gets blown, well, there will be plenty of other opportunities to get back in.
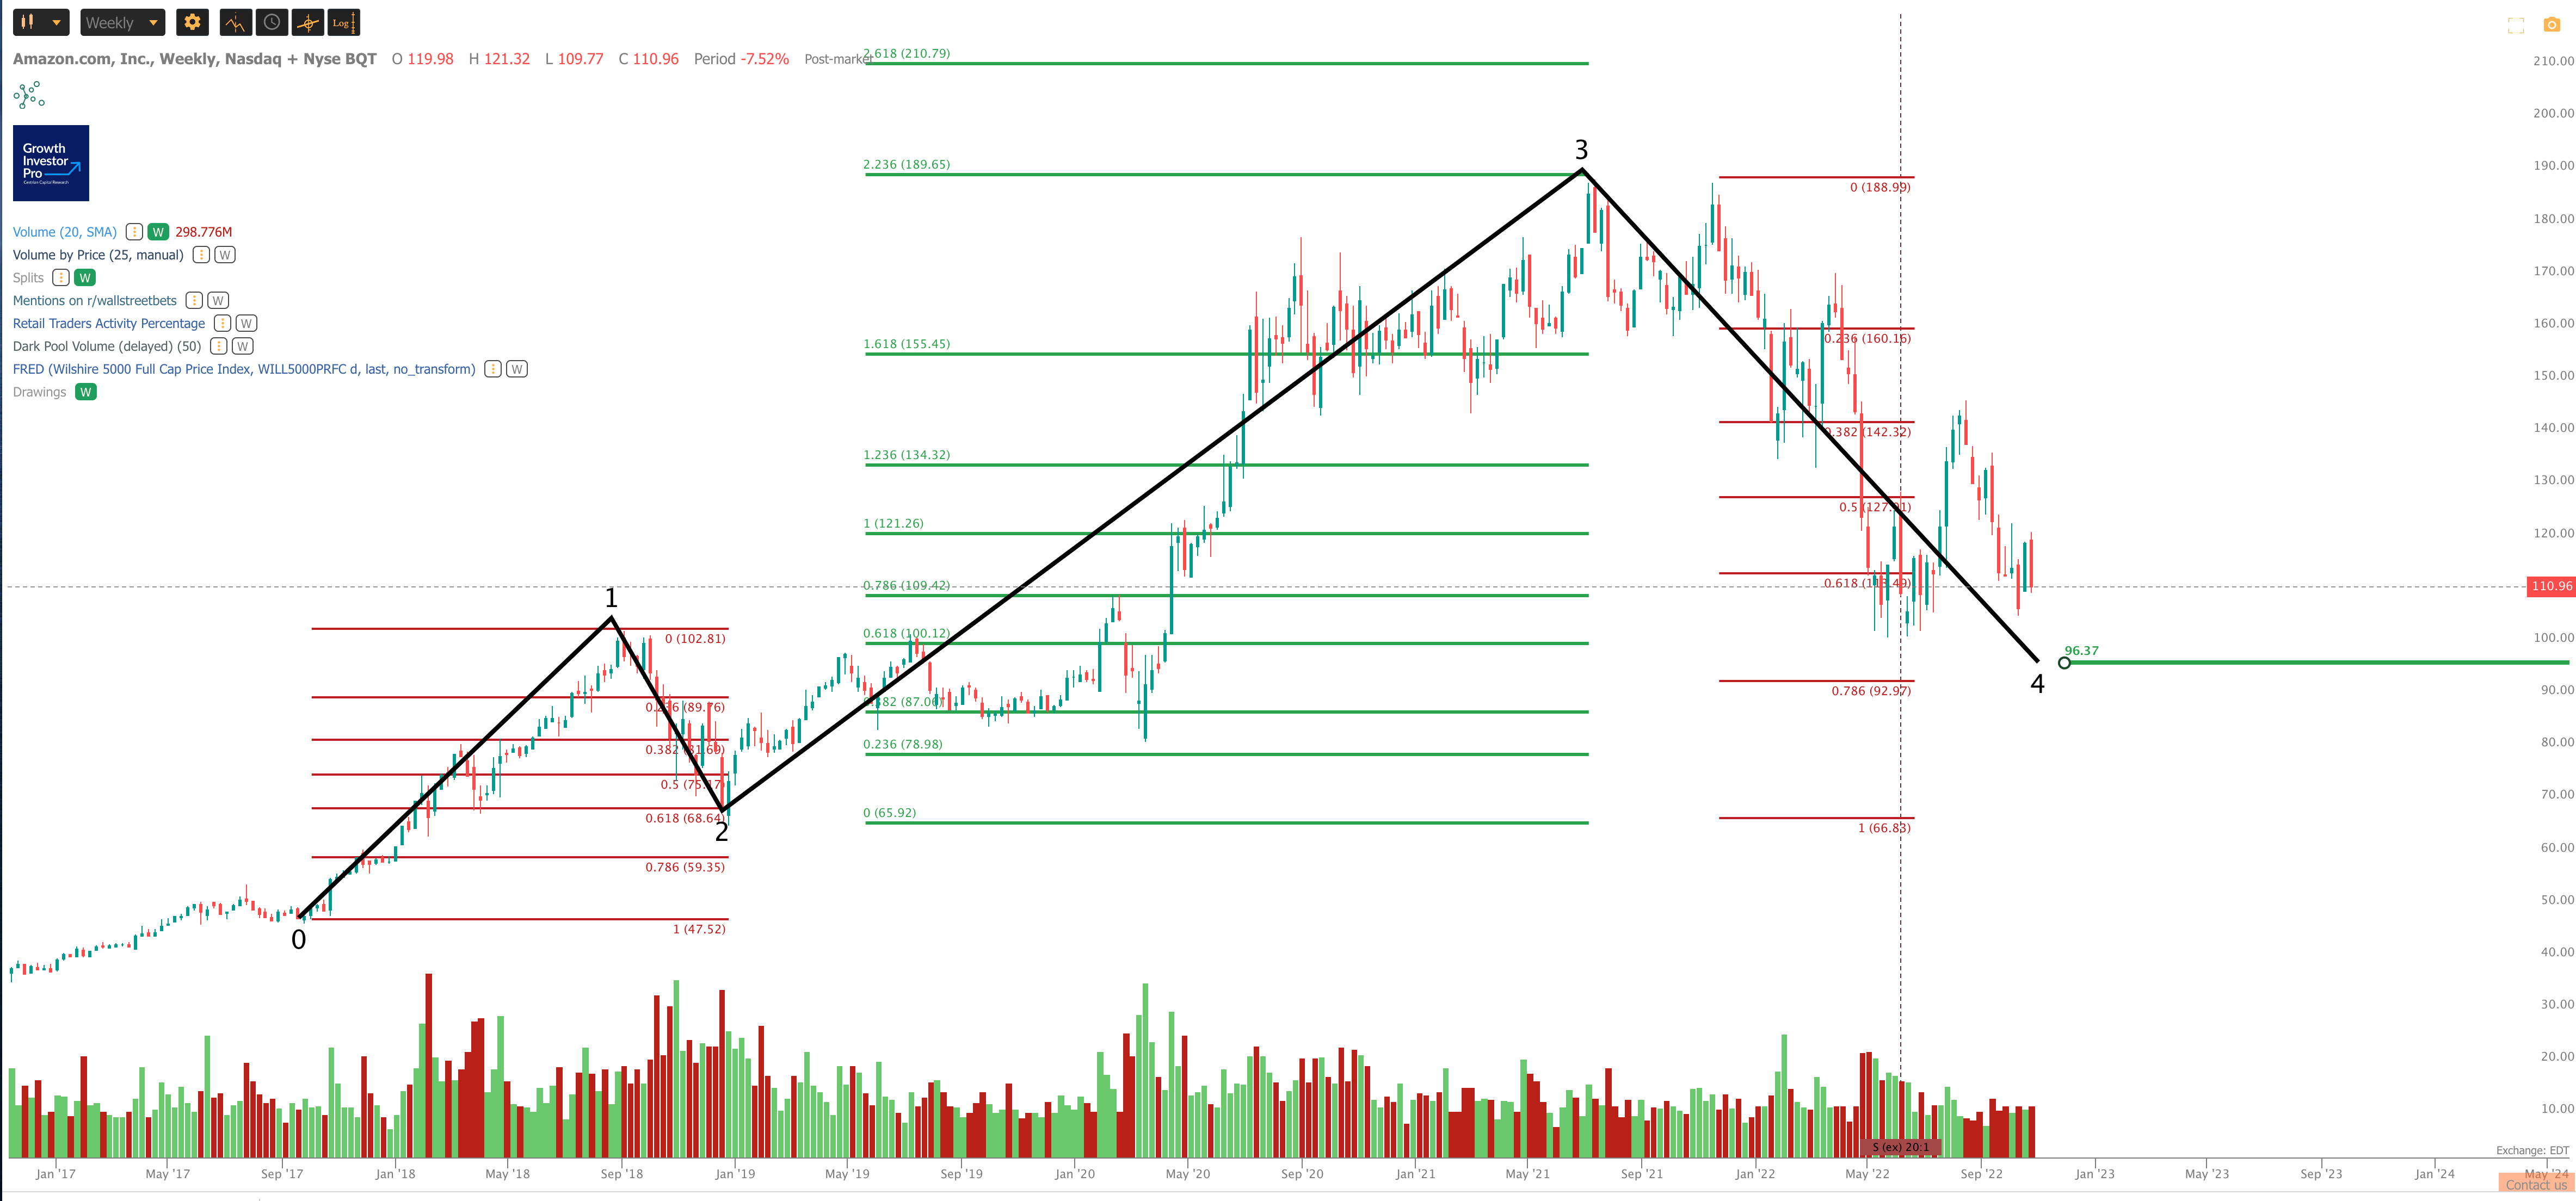
AMZN Chart (TrendSpider, Cestrian Analysis)
You can open a full page version of the chart, here.
So the question is now for Amazon management. Do you have the confidence to swing the ax?
Cestrian Capital Research, Inc – 27 October 2022.
Be the first to comment