

georgeclerk
Thesis
Is Amazon (NASDAQ:AMZN) a buy? This is a tough question to answer, even ignoring all the macroeconomic noise such as inflation, monetary policy and geopolitical tensions. And for sure different investors will arrive at a different conclusion. But in the end the decision is all about valuation, I argue.
In this article, I will give investors three different perspectives on how an analyst could think about pricing AMZN stock: a valuation based on multiples, a sum of the parts valuation, and a residual earnings calculation.
Relative Multiple Comparison
The simplest yet arguably also the most “ineffective and superficial” valuation is a simple multiple analysis, which does not look good for AMZN. As of early September 2022, Amazon stock is priced at a one-year forward P/E of x2.897, which is a greater than 20.000% premium to the sector median. AMZN’s one-year forward P/B and P/S is at x9 and x2.5, which is a 270% and 190% premium respectively.
Seeking Alpha
But Amazon is a growth company, as many investors – myself included – argue. Accordingly, a company’s multiple should be somehow put in relation to expected business expansion.
That said, I am a fan of using the PEG ratio, which is by many scholars and auctioneers accepted as an informative metric to, as defined by Investopedia:
To determine a stock’s value while also factoring in the company’s expected earnings growth, and it is thought to provide a more complete picture than the more standard P/E ratio.
The PEG ratio is calculated by dividing a stock’s one-year forward P/E by the three-year CAGR expectation, as estimated by analyst consensus.
Below, I have enclosed a table that highlights the PEG ratios for the FAAMG companies, as well as the S&P 500 (SPX). My data is based on analyst consensus estimates according to the Bloomberg Terminal (analyst consensus overview, EEO, as of 05 September 2022).
Amazon’s adjusted one-year forward P/E (adjusted for non-operating, one-time expenses) is closer to x56 than x3000. 3-year CAGR is expected to be about 18% – the highest estimate amongst the FAAMG. 2023E P/E divided by 3-year CAGR returns a PEG for Amazon close to x3. Notably, this is a considerable premium versus competitors such as Microsoft (MSFT), with a x1.4 PEG and Google (GOOG) (GOOGL), with a PEG as low as x1.2. If, however, an investor would base his decisions with reference to the broad market index (S&P 500), then an analyst could argue that Amazon is indeed cheap.
Analyst Consensus EPS; Author’s Calculations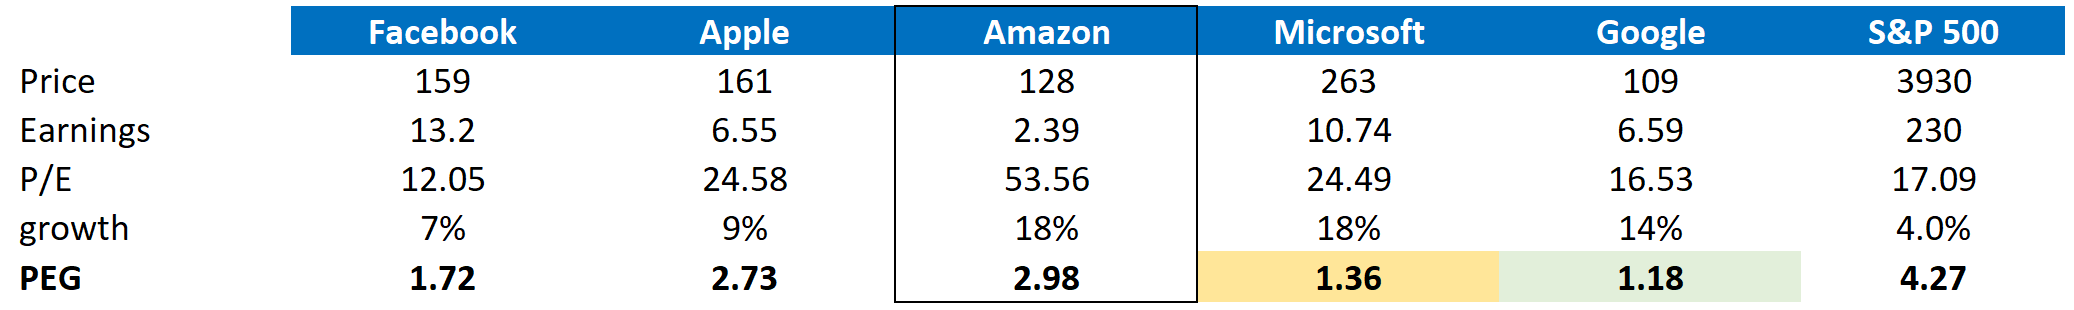
In my opinion, an investor could reasonably claim that Amazon’s PEG should be priced at the average respective FAAMG multiple, which is close to x2.1. Now, we can reverse engineer the company’s implied P/E, given the growth expectations for the firm, and calculate a P/E close to x39.
Accordingly, with this analysis, Amazon’s fair valuation should be approximately $90/share.
Sum-of-the-parts Valuation
The sum-of-the-parts valuation aims to estimate ‘what a company’s single divisions would be worth, if they were spun off or acquired by another company‘. (Reference Investopedia).
Personally, I am very cautious using the sum-of-the-parts valuation for investment purposes, because I argue that: First, it is not reasonable to assume that a company’s single business segments could be spun-off without friction, and/or second, that investors have adequate insights to allocate a company’s fundamentals to various units.
Moreover, this analysis is especially ‘dangerous’ for Amazon, as the company’s various units operate in concert, not isolation.
Nevertheless, here is how I would approach a sum-of-the-parts valuation for Amazon.
I argue that Amazon operates three key business units: The Retail Business, Amazon Web Services, the Subscription Businesses and Advertising.
AWS: In Q2 2022, Amazon generated $19.7 billion from this segment, which equals $77.8 billion annualized. I believe that a x10 EV/Sales is reasonable for a fast-growing tech/software business. Accordingly, I value this segment at a $778 billion enterprise value.
Subscription Business: In the June quarter 2022, $8.7 billion of revenues were generated by this segment – $34.8 billion annualized. I think a x3 EV/Sales multiple is reasonable, taking reference from notable subscription services from Spotify (SPOT) and Netflix (NFLX). This would imply a $104.4 billion enterprise valuation.
Advertising accounted for $8.8 billion of revenues in Q2 2022, $35.2 billion annualized. If an investor anchors on Meta’s (META) and Google’s multiples, a x3.5 EV/Sales could be assumed. This translates into a $123.2 billion enterprise valuation for the segment.
So the above segments cumulatively are valued at $1,005.6 billion. I subtract Amazon’s $96.85 billion of net-debt, $908.75 billion. If an investor considers that AMZN’s enterprise value is $1,360 billion, the valuation misses $456.25 billion.
Amazon’s retail business is notoriously difficult to value. So I advocate to simplify the exercise: is Amazon’s Retail Business worth $456.25 billion? The segment generated about $84.3 billion in Q2 2022, and $337.2 billion annualized. It would thus claim an EV/Sales of close to x1.38. Walmart (WMT) is trading at a one-year forward EV/Sales of x0.72, and a $412 billion enterprise value.
The key question in Amazon’s valuation has now become, if Amazon’s retail business is worth more than the Walmart’s? There are two contradictory considerations: On one side, Amazon is more digital and thus asset-light, which supports global expansion and the exploration of new business opportunities. On the other side, Amazon’s margins for the retail business are lower than Walmart’s (loss-making for Amazon versus 5% EBITDA margin for Walmart). Furthermore, Walmart’s retail business is bigger. Accordingly, I would say it is reasonable to value Amazon’s retail business like Walmart’s, without a premium.
Residual Earnings Model
In my opinion, the residual earnings model is the most accurate valuation tool to price a company, but arguably also the most complex. As per the CFA Institute:
Conceptually, residual income is net income less a charge (deduction) for common shareholders’ opportunity cost in generating net income. It is the residual or remaining income after considering the costs of all of a company’s capital.
Here are my assumptions:
- To forecast revenues and EPS, I anchor on consensus analyst forecast as available on the Bloomberg Terminal. As I mentioned, challenging analyst consensus is out of scope for this article.
- To estimate the cost of capital, I use the WACC framework. I model a three-year regression against the S&P to find the stock’s beta. For the risk-free rate, I used the U.S. 10-year Treasury yield as of September 05, 2022. My calculation indicates a fair WACC of 8.5%.
- To derive Amazon’s tax rate, I extrapolate the 3-year average effective tax-rate from 2019, 2020 and 2021.
- For the terminal growth rate, I apply expected nominal GDP growth at 3% plus one percentage point. Growth higher than GDP growth – after 2025 – is justified in my opinion, as I believe the company will continue to invest aggressively in R&D. Also, Amazon’s management is arguably best-in-class.
- I do not model any share-buyback, reflecting a conservative valuation.
Based on the above assumptions, my residual earnings framework returns a base-case target price for AMZN of $84.55/share (more than 30% overvalued).
Analyst Consensus EPS; Author’s Calculation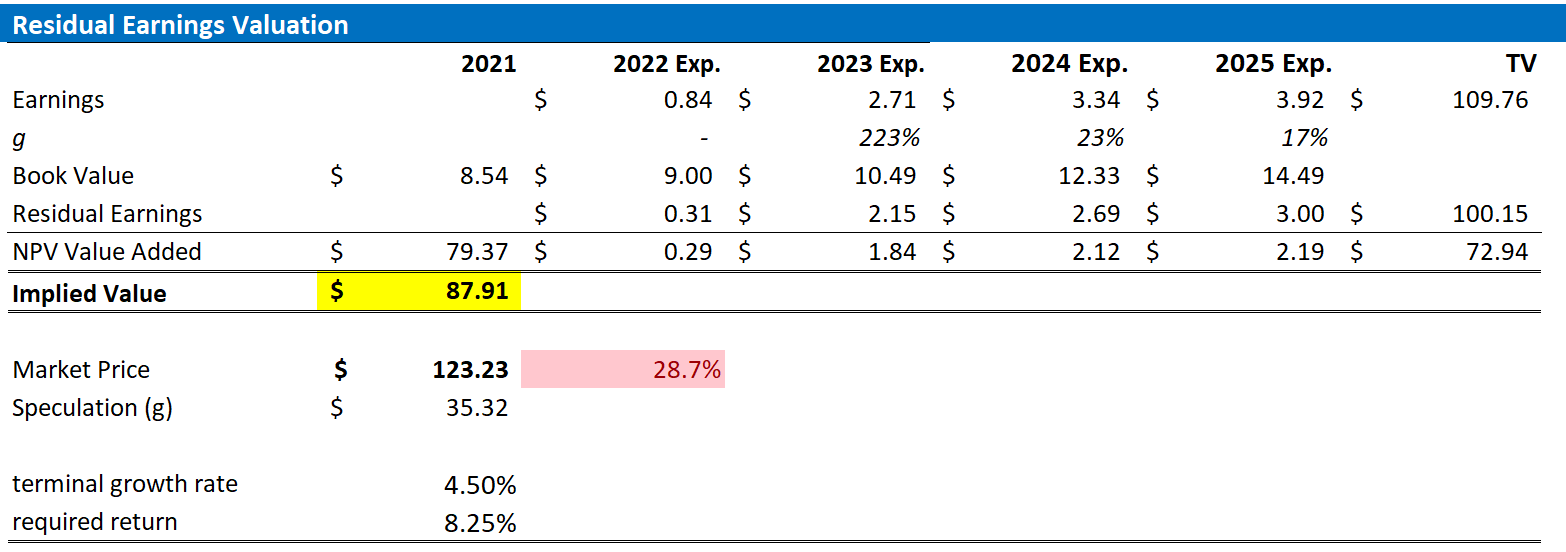
Since I have last valued Amazon stock: Amazon Stock: Rich Valuation Implies Another 30% Downside, I have upgraded a few of my assumptions to account for a better than expected recession resiliency: I have slightly upgraded my EPS estimates and reduced the required return by 25 basis points.
This resulted in a slightly higher implied share price of $84.55 versus $81.94. However, since Amazon stock has appreciated quite a bit, the valuation dislocation has increased, not decreased.
Required Return And Terminal Growth
The unfavorable price-target is not necessarily connected to a specific combination of Amazon’s required return and terminal business growth. In fact, below is a sensitivity table to test varying assumptions with regards to the required return and terminal business growth.
(Note, red cells imply an overvaluation as compared to the current market price, and green cells imply an undervaluation).
Analyst Consensus EP; Author’s Calculation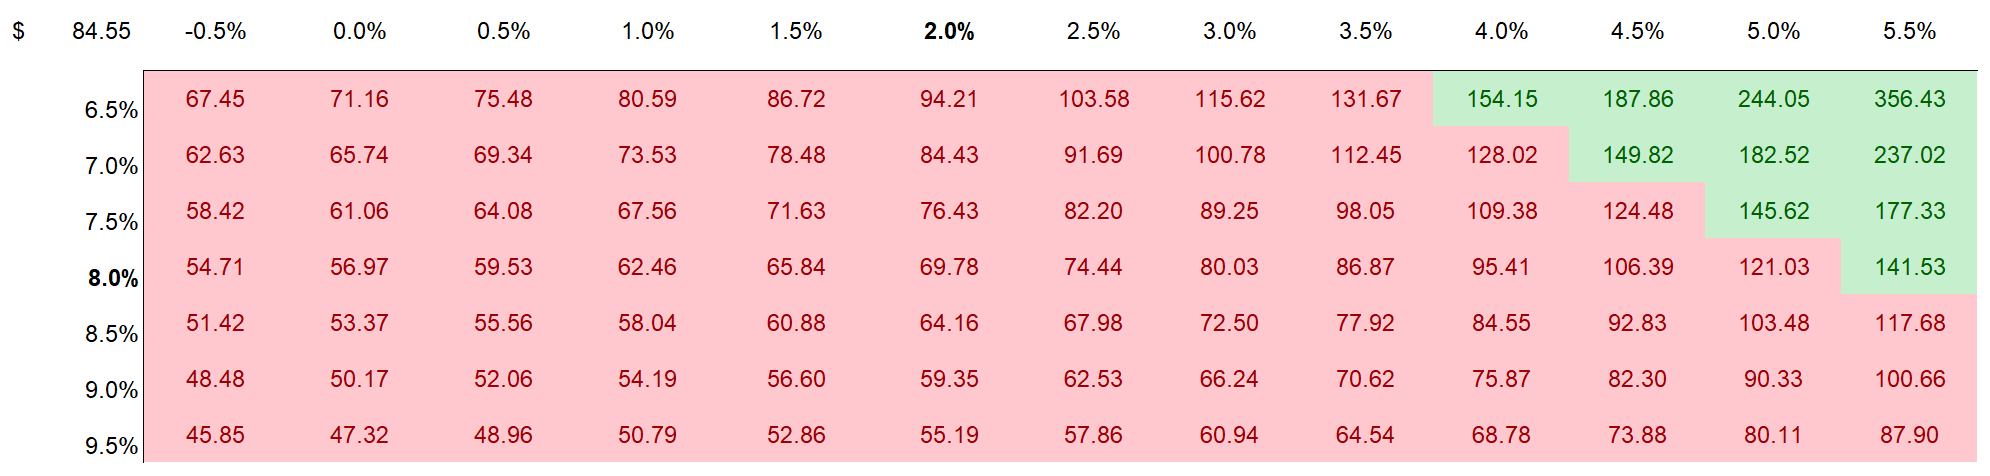
Upside Risk
Although Amazon appears more resilient (so far) than what many investors and analysts have expected, the company remains sensitive to the strength and weakness of the global economy. Accordingly, if macroeconomic conditions would improve – including lower inflation and stronger consumer sentiment – Amazon would be well positioned to be a key beneficiary. Furthermore, Amazon enjoys a strong following from retail investors. Currently, the markets are very risk averse. But if investor sentiment would be restored, and stocks are making new highs, Amazon stock would most certainly enjoy a strong price appreciation.
Conclusion
No matter the valuation framework, AMZN stock price is stretched. Notably, both the relative multiple comparison and the residual earnings model estimate about 30% downside, while the sum-of-the-parts valuation doesn’t necessarily give a decisive price-target, the key question boils down to a qualitative estimate, namely if Amazon’s retail business is worth more than Walmart’s, which I think is not a reasonable assumption.
Thus, the risk/reward is skewed to the downside and as a function of valuation, Amazon stock is a ‘Sell’.
However, I would like to add that investors should feel free to challenge my personal premises, and apply their own assumptions to the respective valuation framework.
Be the first to comment