

HJBC
Amazon Shows Short-Term Weakness, but Strengths Could Start in 2023
Amazon (NASDAQ:AMZN) has been a strong performer as a stock for many years, but this year has been very challenging for many investors. Based on forward-looking fundamentals, upper strength will likely continue next year. I think short-term holding is wise based on technical analysis and other hints.
Long-Term Fundamentals Looks Exceptionally Strong
Growth
Growth is a mixed story, with declines and growth to note. Revenue and profit have been quite varied since 2017.
|
Unnamed: 0 |
2017 |
2018 |
2019 |
2020 |
2021 |
|
Period |
FY |
FY |
FY |
FY |
FY |
|
Revenue growth |
0.308 |
0.309 |
0.205 |
0.376 |
0.217 |
|
Gross profit growth |
-0.400 |
2.305 |
0.252 |
0.261 |
-0.296 |
|
EBIT growth |
-0.019 |
2.025 |
0.171 |
0.575 |
0.086 |
|
Operating income growth |
-0.019 |
2.025 |
0.171 |
0.575 |
0.086 |
|
Net income growth |
0.279 |
2.321 |
0.150 |
0.841 |
0.564 |
|
EPS growth |
0.290 |
2.188 |
0.141 |
0.819 |
0.577 |
Source: Financial Modelling Prep
Enterprise
The critical stock price and market cap metrics have shown strong upward strength since 2017.
|
Unnamed: 0 |
2017 |
2018 |
2019 |
2020 |
2021 |
|
Symbol |
AMZN |
AMZN |
AMZN |
AMZN |
AMZN |
|
Stock price |
71.891 |
83.521 |
93.534 |
160.310 |
143.978 |
|
Number of shares |
9.600 B |
9.740 B |
9.880 B |
10 B |
10.120 B |
|
Market capitalization |
690.154 B |
813.499 B |
924.116 B |
1.603 T |
1.457 T |
|
Enterprise value |
707.558 B |
805.244 B |
911.438 B |
1.645 T |
1.537 T |
Source: Financial Modelling Prep Estimates
Forward-looking estimates look strong moving into next year. All critical metrics show momentum could strengthen up until 2026. As a result, profit growth and cash flow per share are expected to accelerate. This momentum is impressive for a company with a market cap size of more than a trillion dollars.
|
Yearly Estimates |
2022 |
2023 |
2024 |
2025 |
2026 |
|
Revenue |
521,154 |
598,344 |
684,114 |
767,116 |
875,413 |
|
EPS |
0.02 |
2.25 |
3.74 |
5.27 |
7.40 |
|
P/E Ratio |
5,898.26 |
51.33 |
30.95 |
21.94 |
15.63 |
|
EBIT |
15,130 |
30,142 |
49,805 |
70,647 |
96,274 |
|
EBITDA |
– |
88,504 |
113,030 |
141,783 |
180,975 |
|
Net Profit |
523 |
24,549 |
38,754 |
55,436 |
77,838 |
|
Net Profit Adjusted |
21,141 |
36,954 |
56,096 |
65,604 |
89,597 |
|
Gross Income |
224,503 |
264,222 |
312,998 |
347,159 |
397,660 |
|
Cash Flow per Share |
6.31 |
8.56 |
11.34 |
12.82 |
18.67 |
|
Free Cash Flow |
-1,819 |
26,230 |
56,329 |
77,592 |
122,635 |
|
Free Cash Flow per Share |
-0.15 |
2.41 |
6.13 |
9.53 |
11.76 |
|
Book Value per Share |
15.24 |
18.58 |
25.15 |
30.15 |
– |
|
Net Debt |
15,351 |
-9,278 |
-47,833 |
-86,812 |
-181,088 |
|
Research & Development Exp. |
66,475 |
74,755 |
83,506 |
84,155 |
94,330 |
|
Capital Expenditure |
61,092 |
60,687 |
61,745 |
65,566 |
59,340 |
|
Selling, General & Admin. Exp. |
168,711 |
156,392 |
145,262 |
111,016 |
– |
|
Shareholder’s Equity |
150,316 |
191,330 |
249,367 |
323,834 |
439,693 |
|
Total Assets |
455,317 |
515,053 |
595,453 |
652,473 |
816,119 |
Source: Business Insider
Technical Analysis Shows Weakness Short Term
Fibonacci
The Fibonacci orange trend line marks a time to place a stock order. In this case, the current stock price is far from when it crosses the trendline. So is it not worth taking up AMZN positions while your capital is tied up until the stock reverses?
Fibonacci AMZN (Custom Platform)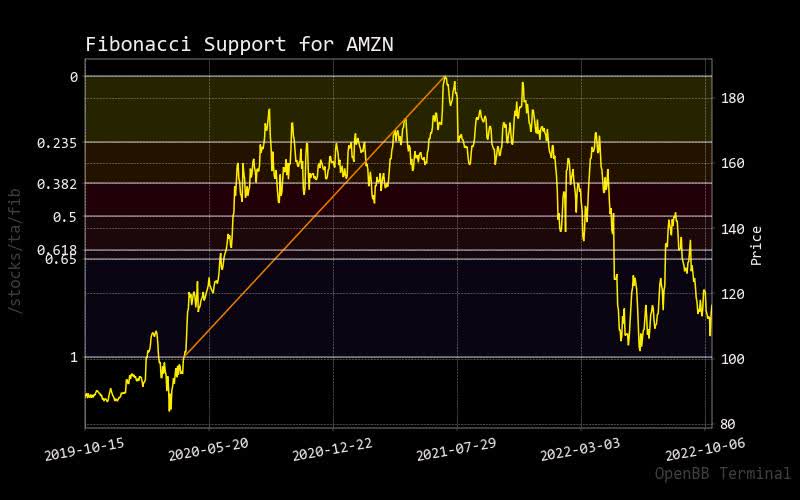
MACD
Another way to confirm a market entry is to use MACD, where the stock price crosses through the zero line. This MACD line is much closer to this compared to the Fibonacci trendline. Is this a more reliable indicator for market entries than the Fibonacci trendline? I think it might be best to use this indicator to measure a market entry.
MACD AMZN (Custom Platform)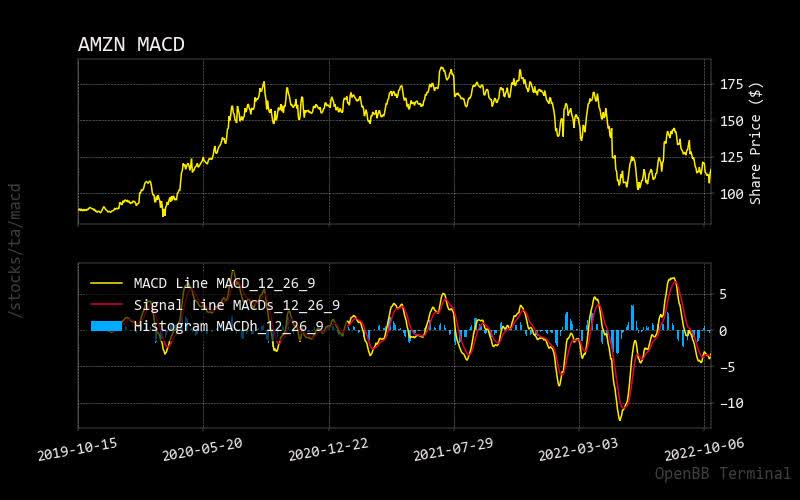
RSI
Always remember that RSI could be used to measure when to exit a position. An exit can occur as the stock price approaches the Oversold condition in the RSI. Amazon is currently oscillating between undersold to oversold conditions.
RSI AMZN (Customer Platform)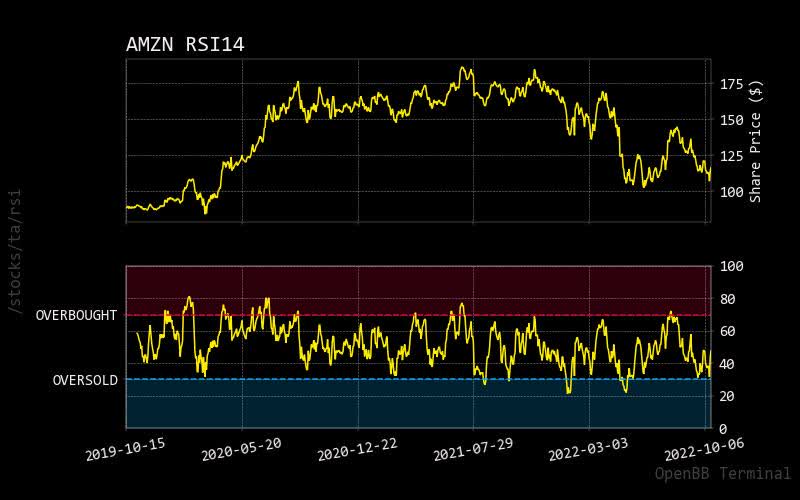
Prediction via AI
Monte Carlo
The results of this Monte Carlo simulation show most predicted paths point up versus down for future stock pricing moves. Therefore, it might be wise to use the technical indicators mentioned above for timing market entries and exits.
Monte Carlo AMZN (Custom Platform)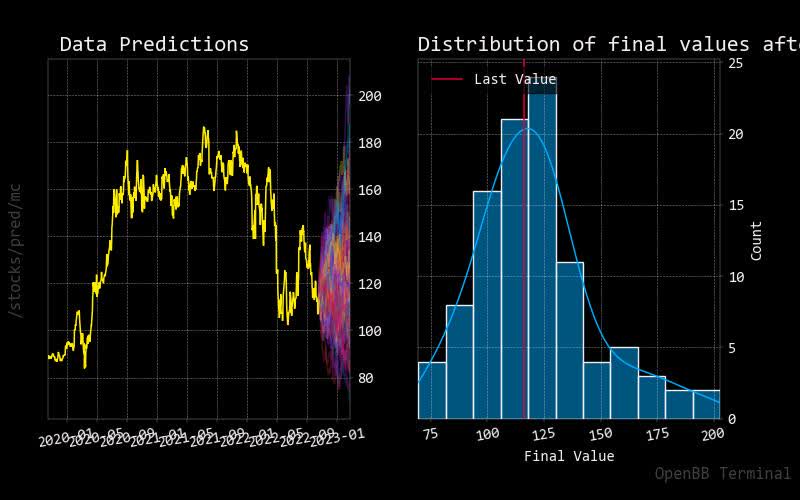
Regression
The 30-day predicted red regression line shows an upward stock pricing move. In past reports, it has been shown not to use this indicator exclusively to time the stock price. Therefore, this report overlays many analytic techniques used in this report.
Regression AMZN (Custom Platform)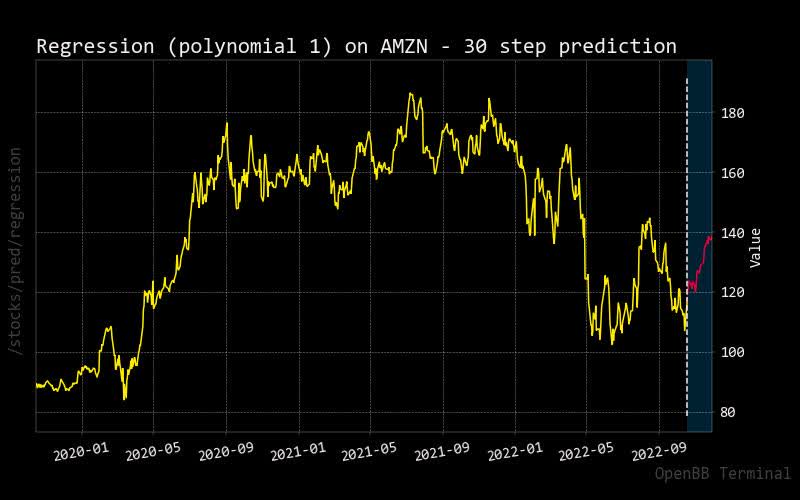
Risk Shows Sell
Analyst Recommendations
There appears to be an overwhelmingly current strong sell recommendation on Amazon, which the Technical Analysis supports. However, long-term forward guidance shows strong buy momentum starting into the latter half of 2023.
|
Interval |
Recommendation |
Buy |
Sell |
Neutral |
|
One month |
Strong_Sell |
1 |
16 |
9 |
|
One week |
Strong_Sell |
1 |
17 |
8 |
|
One day |
Sell |
5 |
11 |
10 |
Source: TradingView
Insider Stats
These stats can benefit us with insight into what capital firms and even Amazon executives are doing. For example, as you can see, in August and September months they were mostly selling stock during this period.
This matches with the majority recommending a solid sell.
|
Unnamed: 0 |
X |
Filing Date |
Trading Date |
Ticker |
Insider |
Title |
Trade Type |
Price |
Quantity |
Owned |
Delta Own |
Value |
|
1 |
M |
2022-09-16 17:12:07 |
2022-09-14 |
AMZN |
Selipsky Adam |
CEO Amazon Web Services |
S – Sale |
$127.94 |
-1,020 |
115,663 |
-1% |
-$130,499 |
|
2 |
M |
2022-09-01 16:58:32 |
2022-08-30 |
AMZN |
Selipsky Adam |
CEO Amazon Web Services |
S – Sale |
$128.60 |
-1,020 |
116,683 |
-1% |
-$131,170 |
|
3 |
nan |
2022-08-23 17:50:33 |
2022-08-22 |
AMZN |
Herrington Douglas J |
CEO Worldwide Amazon Stores |
S – Sale |
$134.25 |
-7,448 |
1,111,194 |
-1% |
-$999,873 |
|
4 |
D |
2022-08-23 17:37:46 |
2022-08-22 |
AMZN |
Olsavsky Brian T |
SVP, CFO |
S – Sale+OE |
$135.55 |
-16,720 |
48,962 |
-25% |
-$2,266,396 |
|
5 |
D |
2022-08-23 17:31:47 |
2022-08-22 |
AMZN |
Zapolsky David |
SVP |
S – Sale+OE |
$134.25 |
-8,360 |
68,620 |
-11% |
-$1,122,351 |
|
6 |
D |
2022-08-23 17:25:56 |
2022-08-22 |
AMZN |
Reynolds Shelley |
VP |
S – Sale+OE |
$134.23 |
-3,480 |
122,436 |
-3% |
-$467,125 |
|
7 |
D |
2022-08-17 16:53:14 |
2022-08-15 |
AMZN |
Jassy Andrew R |
Pres, CEO |
S – Sale+OE |
$142.29 |
-23,620 |
1,967,343 |
-1% |
-$3,360,817 |
|
8 |
DM |
2022-08-17 16:46:00 |
2022-08-15 |
AMZN |
Selipsky Adam |
CEO Amazon Web Services |
S – Sale+OE |
$142.41 |
-12,820 |
117,703 |
-10% |
-$1,825,634 |
|
9 |
nan |
2022-08-17 16:37:19 |
2022-08-16 |
AMZN |
Zapolsky David |
SVP |
S – Sale |
$145.01 |
-10,480 |
60,260 |
-15% |
-$1,519,688 |
Source: OpenInsider
Conclusion
It seems AMZN is a short-term sell when looking at market analysis or insider selling. I would not invest in AMZN at this point but wait until the MACD or Fibonacci trendline indicates an opportunity for timing reasons. You can also use RSI to time your exit if you are a day trader. As hinted by the forward-looking guidance that its fundamentals show, the timing for a buy-and-hold investment could start sometime in the second half of 2023. As a result, I would put a hold on this stock for now but recommend a substantial buy as the price potentially increases sometime next year.
Be the first to comment