

Luis Alvarez
Amazon.com, Inc. (NASDAQ:AMZN) is an odd chimera of a “mega-cap.” Its highly-valued e-commerce business initially fueled the growth of a cloud computing infrastructure business that later went on to subsidize its progenitor, which birthed a multimedia content business ostensibly designed to drive e-commerce adoption – while both progenitor and younger progeny burn through the elder progeny’s lush cash piles. Late last year, after a wave of prominent activist investor called for such conglomerates with disparate businesses to simplify value propositions and enhance asset valuations, two American giants – Johnson & Johnson and General Electric – announced plans to break up. An earlier article made the case for why it should and why it wouldn’t do so.
On account of the older progeny’s “cash cow” status, Amazon largely resisted calls to break up in a year when 51 other companies committed to. However, this year, debate on this continues on a more low-key basis in institutional investor and hedge fund circles. On the more public side were demands from a prominent U.S.-based small business coalition at the dawn of Q2 – and potential special interest group with legislative influence. Shortly after this came a hotly-contested piece of legislation making its way through the Byzantine corridors of Washington that aims to limit the influence wielded by the likes of Amazon on American commerce. Meanwhile, as another article near the end of December demonstrated, the company’s India e-commerce business remains mired in controversy that could potentially drain the goodwill it received when entering the market – just as its China business did. Incidentally, earlier this year, the company announced it’s also shutting its Kindle Store in China. The India e-commerce business’ losses also attenuate its ex-U.S. e-commerce segment’s performance.
Whether the legislation passes or not is presently a matter of conjecture; what is relevant that the “chimera,” while well-funded, hasn’t been very nimble lately. C’est la vie.
Amazon Incomes: Segment and Trends
Given that it is a company with high scalability costs – be it in e-commerce or cloud infrastructure, lets consider segment operating incomes from the company’s financial statements for a “heat map” schema used in recent articles to highlight each segment’s operating income share each quarter:
Source: Created by Sandeep G. Rao using data from Amazon’s Financial Statements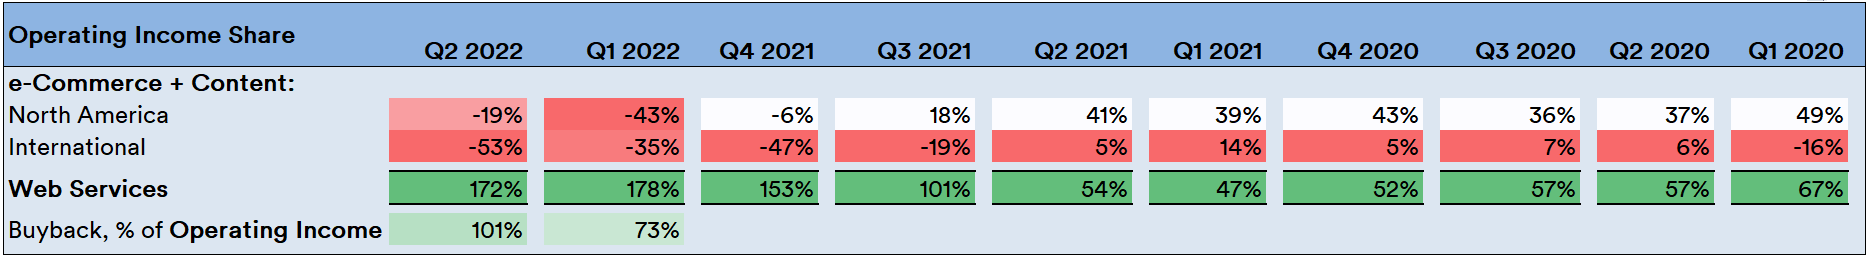
One modification was done to the “heat map” schema here: the company’s share buyback program – which kicked it into effect this year, as per the financial statements – has been included to highlight the effects on the company’s earned income.
If the share buyback program were to be considered relative to total operating income earned, the company has been burning through them the past two quarters. In fact, as the “heat map” shows it has burnt more in share buybacks than it has earned as income in Q2.
The negative rates in the Year To Date (YTD) are quite interesting in that they show how much AWS has been carrying the load in recent times. As the “heat map” indicates, the company’s e-commerce + content segment (which is the only way one can analyze the befuddling mix of Prime Studios and e-commerce) had largely held their own on a “North America + International” basis quite decently until Q2 of last year. The segments began their sag from the Q3 results of last year onwards.
Next, the “heat map” schema is applied on quarter-on-quarter (QoQ) growth in operating income to determine segment trends:
Source: Created by Sandeep G. Rao using data from Amazon’s Financial Statements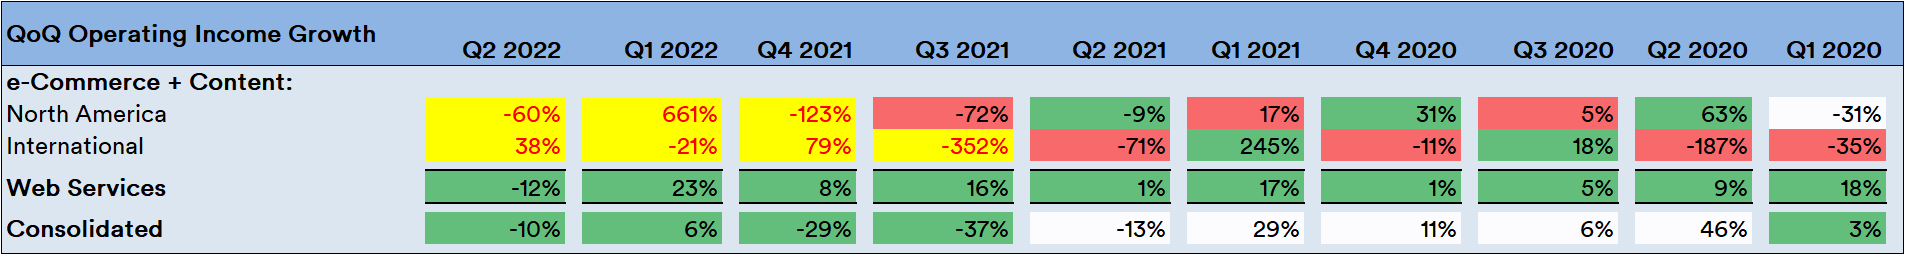
Once again, the “heat map” breaks down after Q2 2021, requiring manual intervention. The cells marked in yellow with the red text are excluded from the “heat map” formulation. The trend analysis here yields some interesting facets nonetheless:
- In terms of growth, the AWS segment has the only one that has shown positive growth all the way until Q2 of this year.
- The “e-commerce + content” segments have been a mixed bag, to put it mildly. Incomes for the “International” segment was negative in Q1 2020 (as well as Q4 2019) but there was a long period of positive incomes for both North America and International segments since then till Q3 2021, where the International segment fell into the negative once again. Since Q4 2021, both segments have been negative, with the International segment leading in losses in two of three quarters (the “North America” segment led in Q1 2022).
The negative trends since Q4 2021 is the reason why manual intervention was required: for the International segment, Q4 2021 was an even bigger loss than the previous quarter but the “heat map” would paint it in a positive colour. Similarly, Q1 2022 was an even bigger loss for the “North America” segment than the previous quarter and the “heat map” would have shown this as a positive.
While Q2 of this year has the “North America” segment showing a lower loss and the “International” segment a higher loss than in the previous quarter, the fact remains that losses have continued.
Macroeconomics, Ratio Trends and Valuation Factors
When it comes to business of e-commerce, there are at least some intuitive commonalities with the likes of Meta Platforms (which was covered last week) and Alphabet: if the general public lowers consumption, this has an impact on the bottom lines of a company operating in this space, no matter how well-managed it is.
For instance, in the U.S. Census Bureau’s Monthly Retail Trade Report, the “Monthly” indicator shows a slight stabilization of sorts – with even a slight uptick – in the first two months of Q3.
Source: United States Census Bureau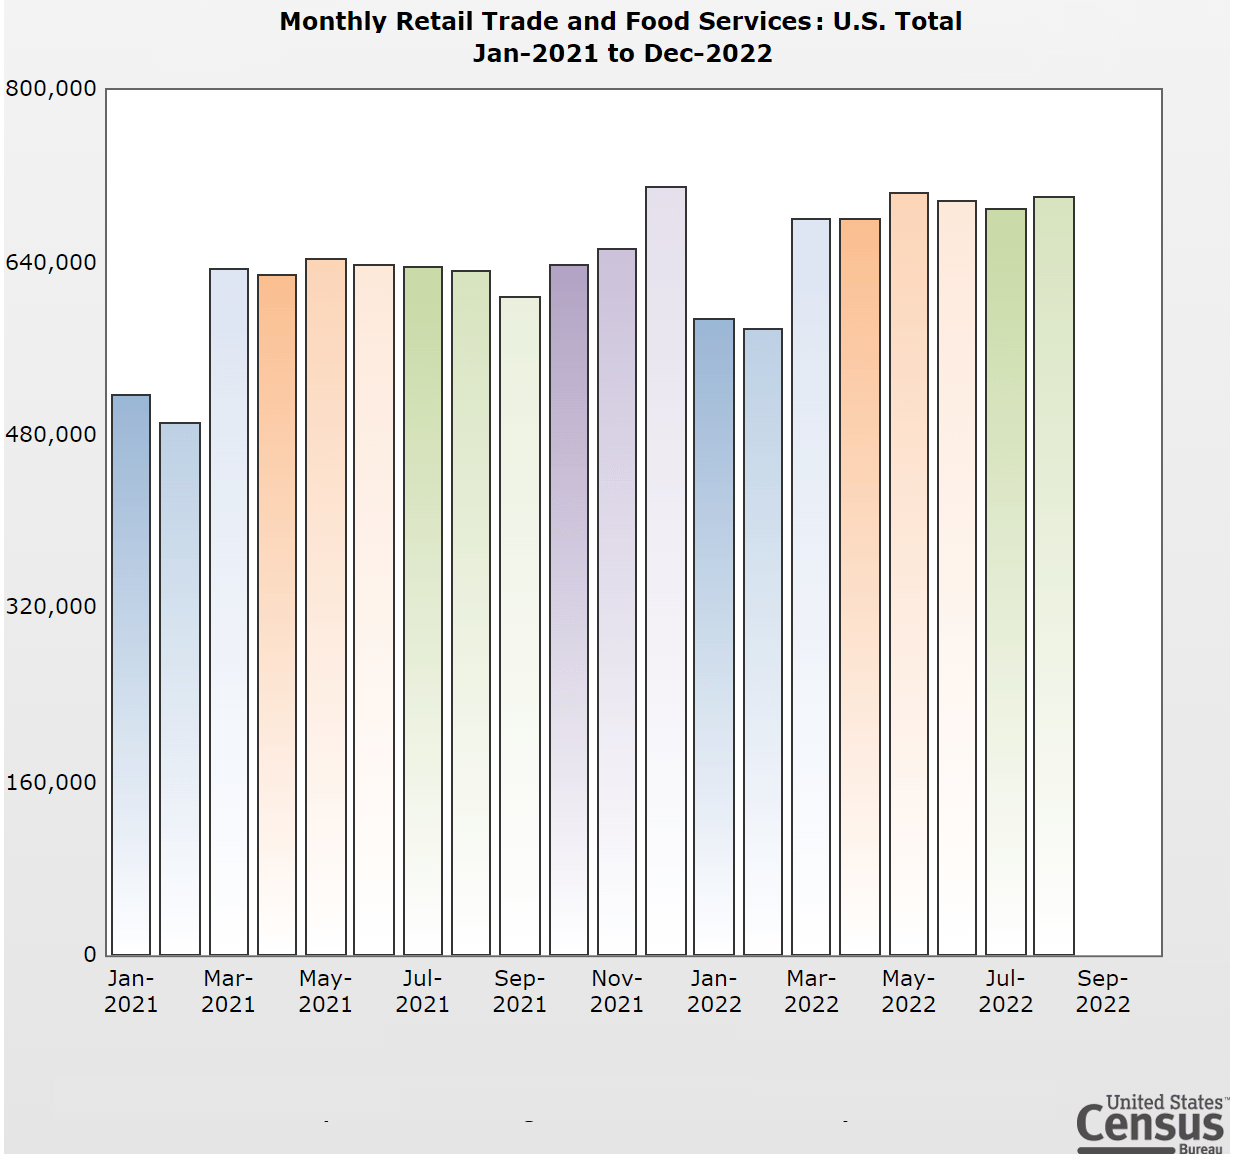
In the Advance Report (ex-Auto & Gas) – which has tended to show the same trends as in the Monthly Report, September is seen to be indicating lower sales.
Source: United States Census Bureau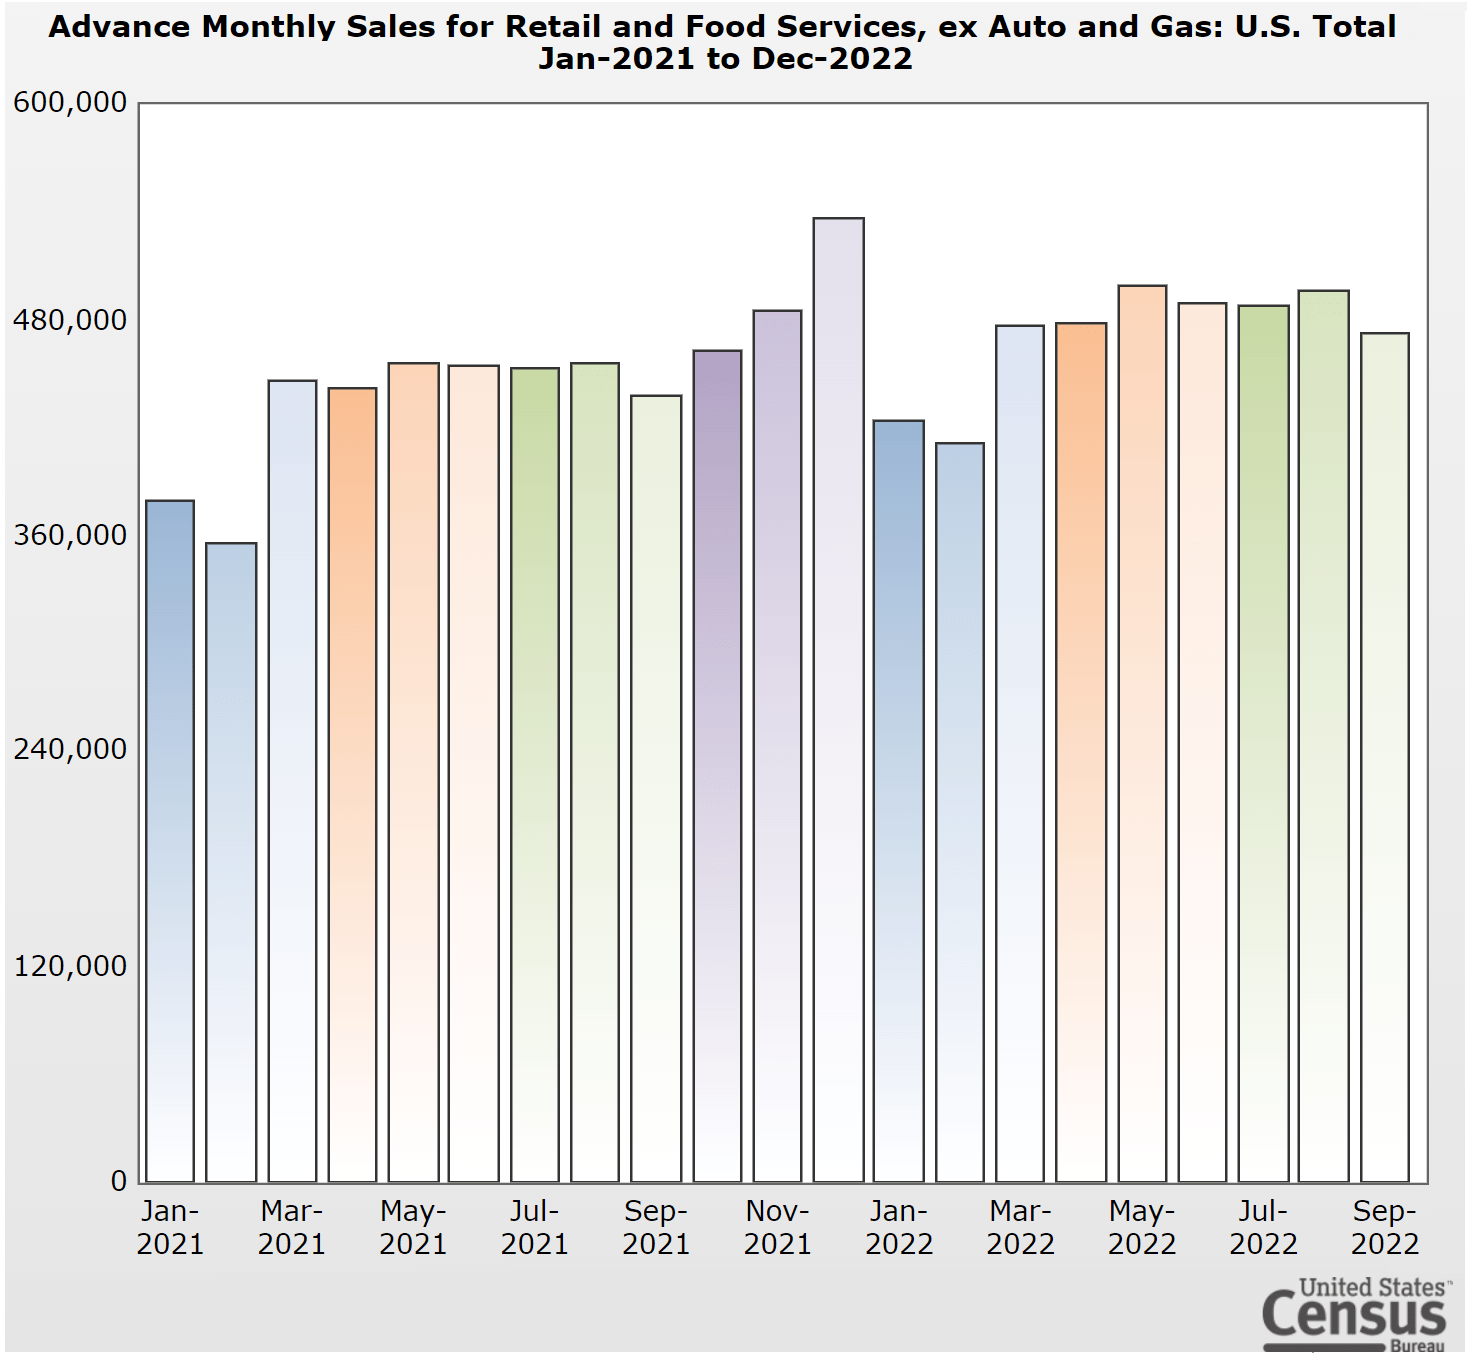
The overall macroeconomic outlook was covered in another article a month ago. It’s not a pretty picture: individual debt remains high and wage earnings growth isn’t really keeping up with inflation. Consumer Price Index levels show a returning trend in increasing month-on-month deltas in inflation since July:
Visualization by Statista
With an ongoing squeeze in incomes and spends, the proposition of weak retail sales till September (both actual and advance) can be merged with the CPI trajectory to infer that while dollar sales might be stable and even upward-trending, sale volumes are decreasing.
An examination of the trends in the Price to Earnings (PE) Ratio relative to the broad-market S&P 500 (SPX) with correlation as a “goodness of fit” measure would be in order, similar to that done for Apple as well as Meta and Alphabet.
Source: Created by Sandeep G. Rao using data from GuruFocus and Zacks’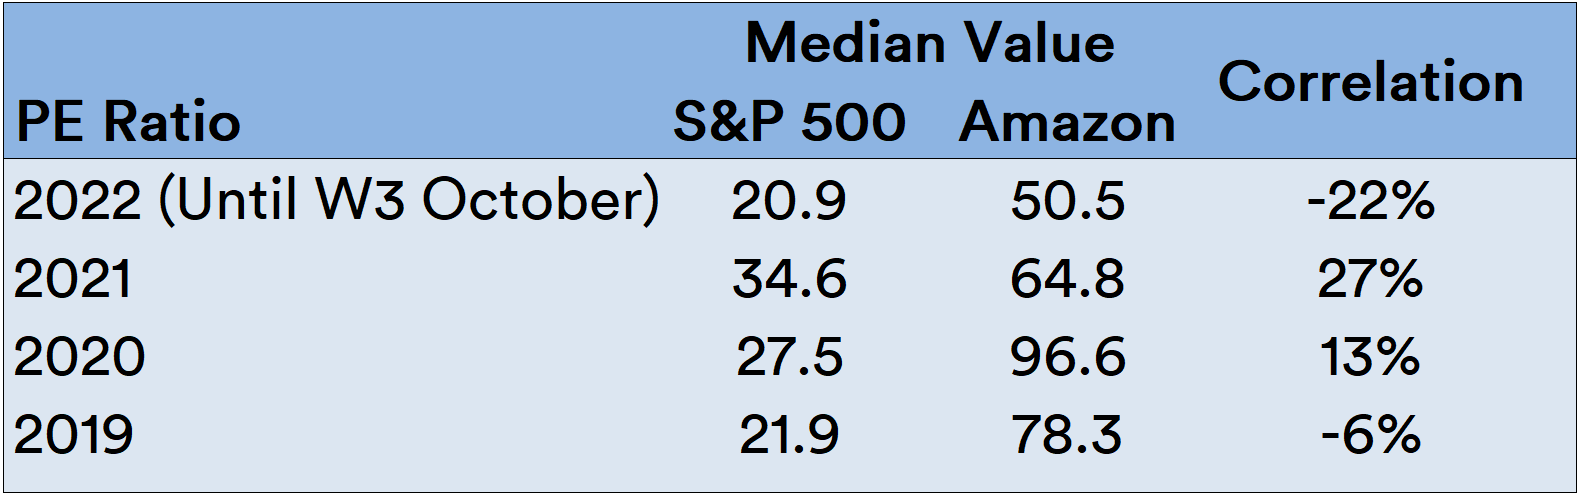
As it turns out, unlike with the three aforementioned FAANG stocks, trends are utterly dissimilar. The stock has traditionally been rather highly valued and shows little correlation with trends in the other constituents of the S&P 500. In the YTD, the stock’s valuation shows an outsized sensitivity to the crests and troughs of the broad index. One lesson that should be eminent in the year so far is: with overvaluation comes volatility.
Source: Created by Sandeep G. Rao using data from GuruFocus and Zacks’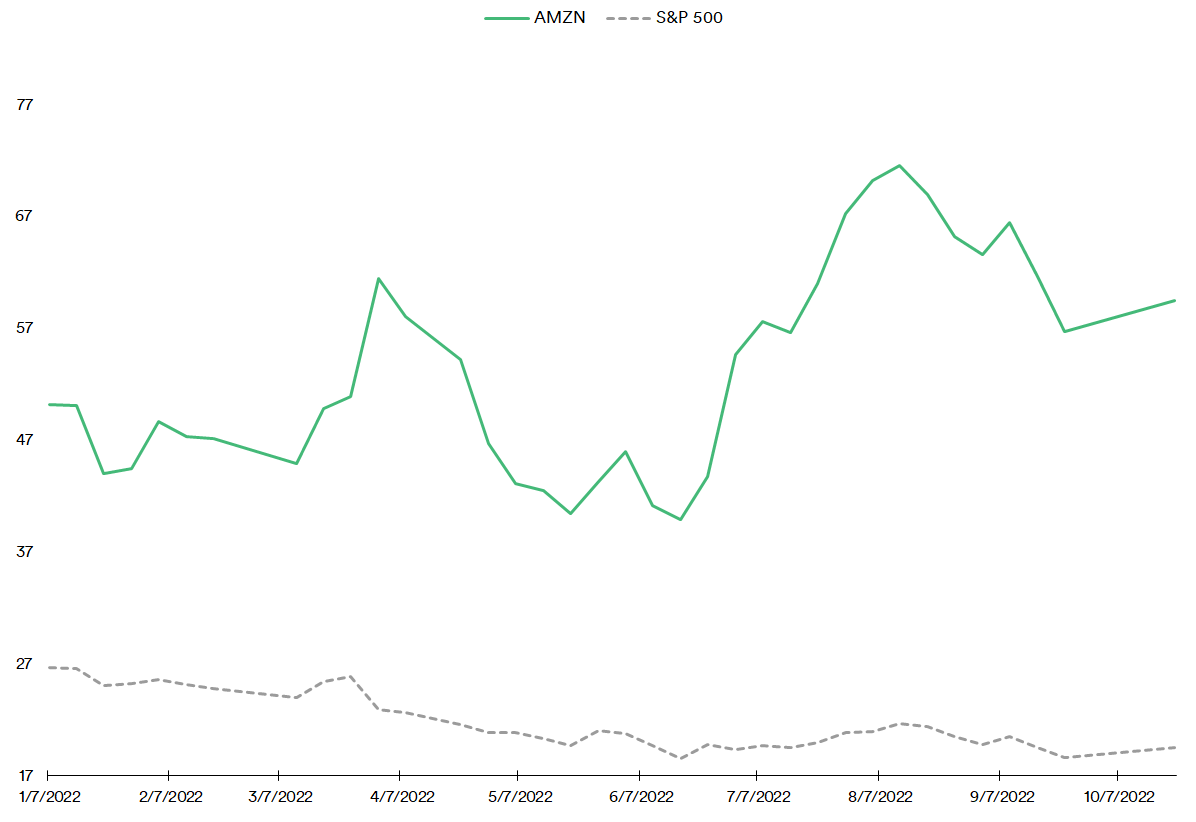
This overvaluation is evident even in consensus estimates for the stock in the YTD so far: the company has missed them by a massive margin.
Source: Google Finance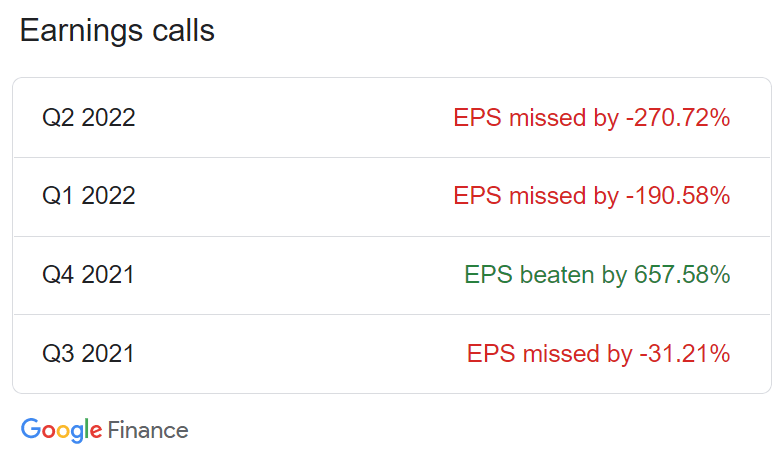
A sort of unwritten rule of thumb among institutional analysts is that earnings growth are generally estimated somewhat conservatively. As a result, positive earnings surprises tend to be more common than not. As a result of the surprise, there is even a momentary bump in the stock’s price. In the company’s case, the analysts’ valuation models get cloudy because of its disparate businesses and individual investors often miss the point that messy value propositions isn’t the same as robustness.
Individual investors have been exiting the market in droves throughout the year, with the last week of September alone accounting for nearly as much in exits as the rest of that month.
Visualization by Wall Street Journal and AAII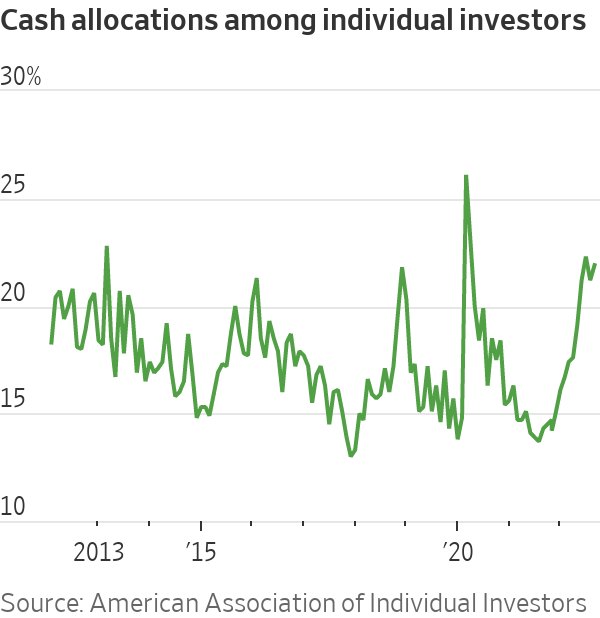
The forward earnings of the broad market (i.e., the S&P 500) is under significant bearish pressure and has already erased valuation gains nearly all the way back to start of 2019.
Source: Fidelity Management Research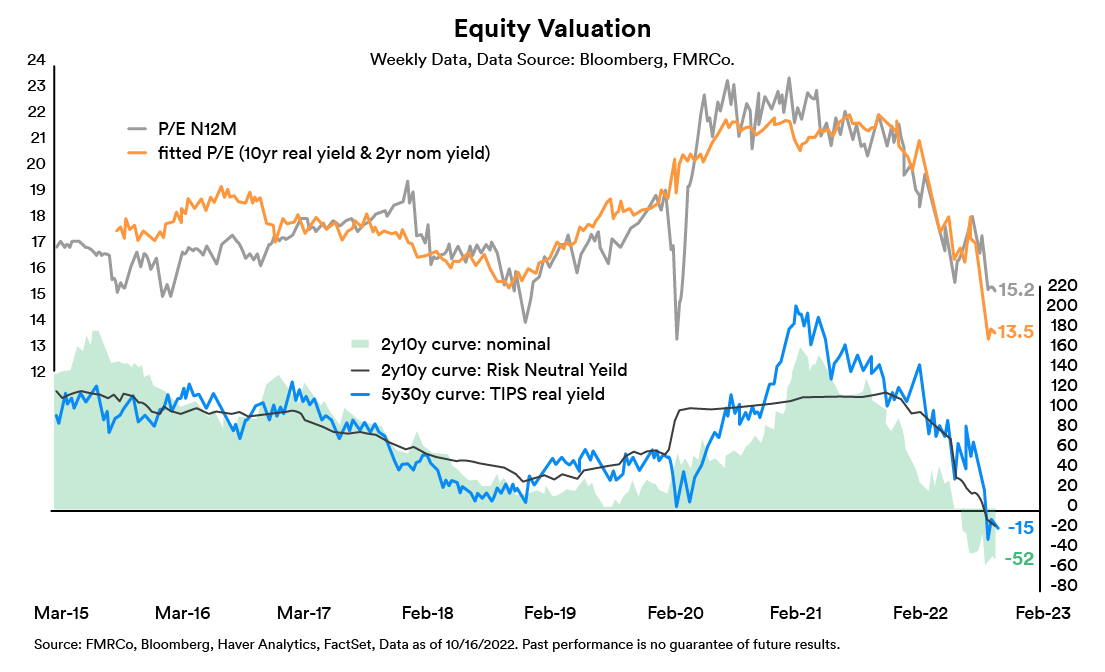
What does help the company’s stock, however, is a facet gleaned from a number of closed-distribution reports produced by investment houses in the last couple of weeks (none of which can be fully reproduced on this platform) that indicated that high-net worth investors and institutional investors have switched to purchasing broader ETFs over stocks.
Source: Bank of America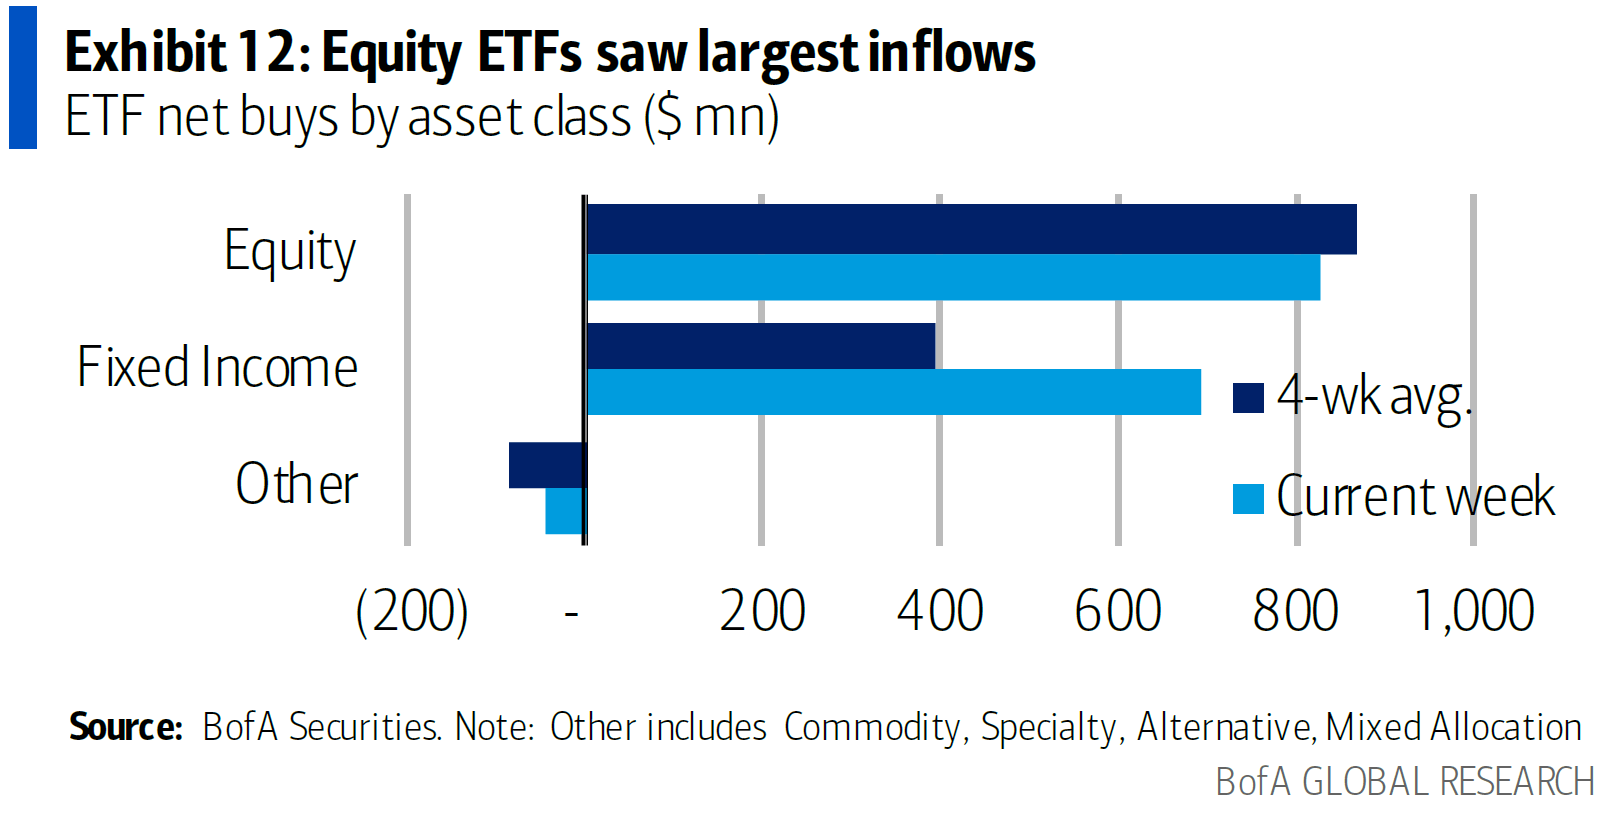
While inflows have increasingly been towards defensives and energy, consumer discretionary have also witnessed an uptick in buy-ins.
Source: Bank of America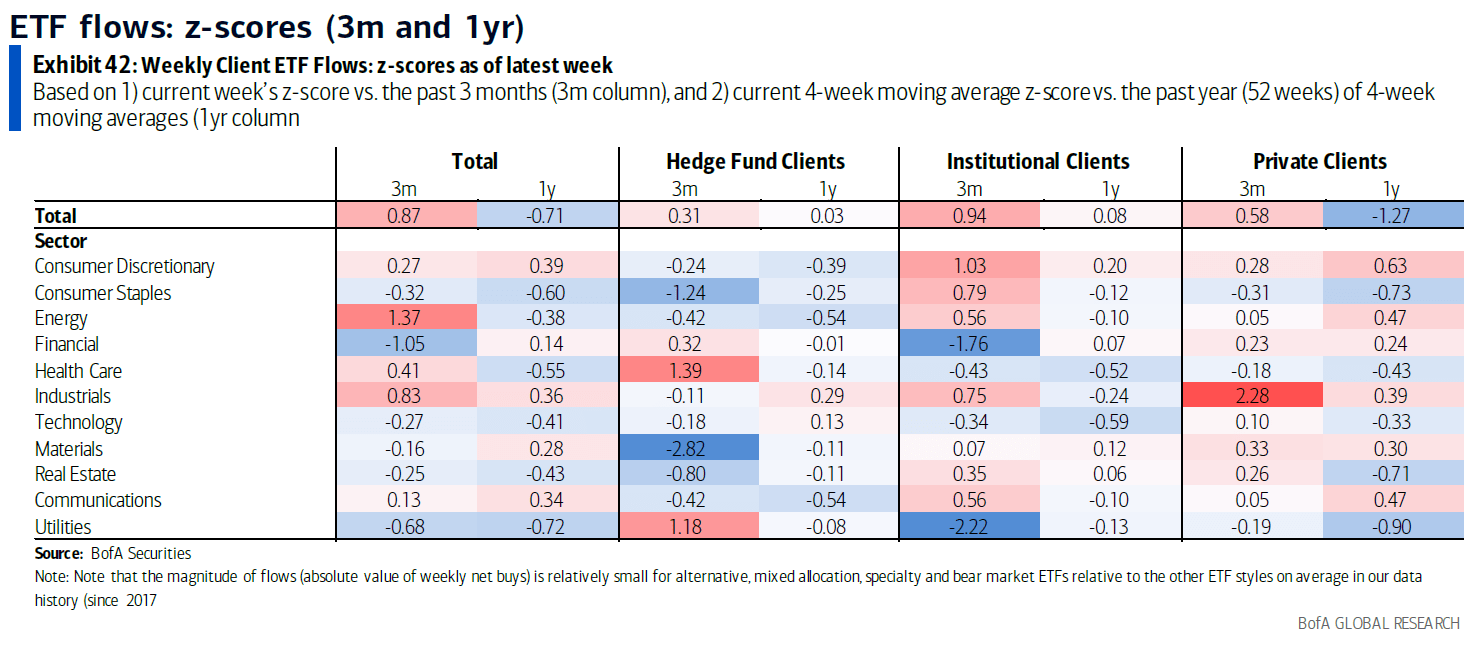
Given that the company’s stock is included as a constituent of many broad market ETFs as well as consumer discretionary ETFs, it is quite likely that the stock price will witness some rises as further units of ETFs are created and traded. As the first article about the company indicated, investment managers managing passive investment vehicles typically have had a significant presence in the stock’s ownership patterns.
In Conclusion
Investor convictions, cloudy propositions and driving investor behavior has created a fine little mess when it comes to evaluating the company’s potential. It is quite likely that the company will miss consensus earnings estimates for Q3. At the same time, there’s every possibility that most analysts might have adjusted their models as a result of which the company’s upcoming earnings will be a positive surprise.
Given lowered liquidity, there’s no telling if the stock price bump will be pronounced or even sustained. At the same time, given the increasing switch to ETFs over “single names” and the fact that ETF issuers have to physically purchase the underlying to create new issuances, even a bearish trend could show up in the charts as being bucked.
Will the company face a breaking up? Will ETF issuers adjust their rules – which they’re absolutely authorized to – impose limits on “disparate conglomerates” to enhance specific sector exposure to make their products more attractive to this growing wave of ETF buyers? What effect have share buyback actions have had on the stock’s trajectory? Depending on the audience and the forum, there are many opinions but no answers as of now.
At this juncture, a “wait and watch” approach is likely preferable to either a “commit” or a “reject.” Hence, the recommendation is to “Hold.”
Be the first to comment