

Khanchit Khirisutchalual
As the article initiating coverage of Alphabet Inc. (NASDAQ:GOOG, NASDAQ:GOOGL) (“Google”) nearly a year ago outlined, the company is pretty much unbeatable in its core business, and its “Other Bets” endeavors are a nascent yet rather manageable drag on earnings. In the present day, however, there are larger macroeconomic conditions to consider owing to the company’s distinctive revenue lines.
Google Revenues: Segment and Trends
The company’s quarterly financial statements indicate a massive dependence on advertising in both Search and YouTube for revenues:
Source: Created by Sandeep G. Rao using data from Alphabet’s Financial Statements
Applying a “heat map” schema on the different revenue lines indicates that advertising revenue breakdown hasn’t really seen a momentous shake-up (or even a slight one, for that matter) for several years. While YouTube and Network ads compete with each other, search-based advertising outstrips all others in contribution by a vast margin.
Another interesting feature has been the slight rise in revenue contribution by the company’s Cloud business. Now, the cloud computing business is generally considered to have a high switching cost in service providers. This means that expecting this segment to start producing a significant bulk of the revenue any time soon wouldn’t be a very realistic proposition.
A “heat map” schema on quarter-on-quarter (QoQ) revenue growth, however, uncovers some interesting trends that are contextualized by the revenue share heat map:
Source: Created by Sandeep G. Rao using data from Alphabet’s Financial Statements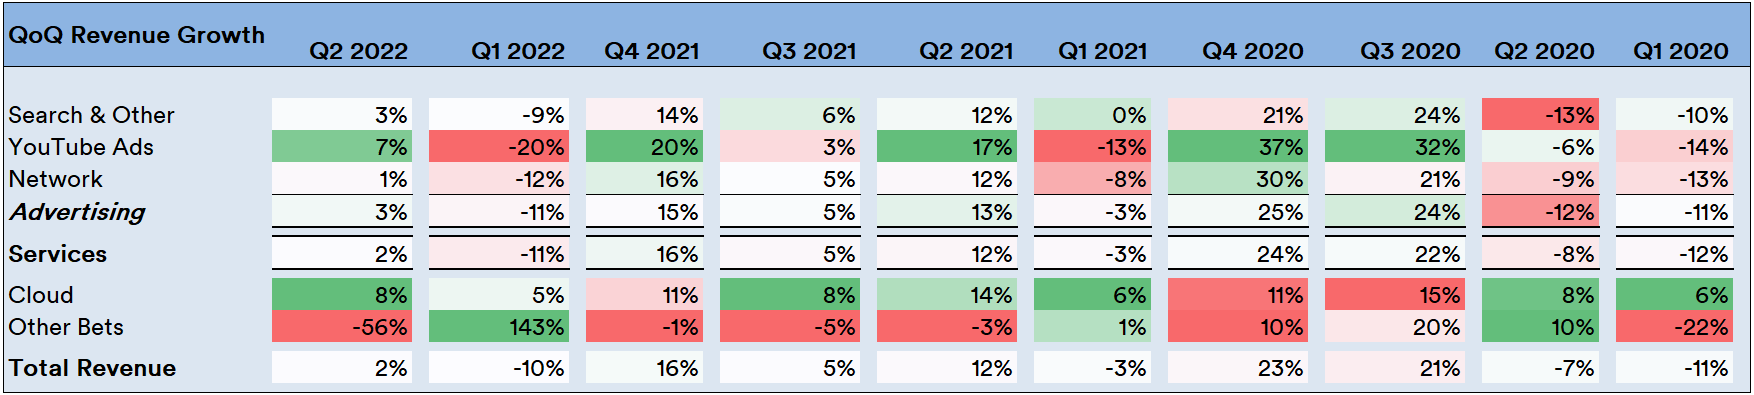
- The “YouTube Ads” segment shows some very interesting variability. A spike or drop in this segment, however, would be a false positive or a false negative, given how massive of a share the “Search” business has.
- In the highlighted time period, there is some suggestion of a seasonality effect in “Search” revenues. This is a very weak signal, though. While the highlighted time period shows a consistency in Q1, there is no such consistency in Q2 or Q3. Furthermore, going back in time further weakens the seasonality argument.
- The high variability in “Cloud” and “Other Bets” segments also inevitably become a false signal, given how massive a share the three advertising segments’ revenues have on the total bottom line.
- The size of the “Search” business cannot be overstated. Overall, the bottom line is highly correlated with the “Search” business’ revenues.
Macroeconomics, Ratio Trends and Valuation Factors
Given the importance of advertising, the company’s fortunes bear a striking resemblance to that of Meta Platforms (META) (which was covered last week). Thus, the overall picture for advertising is generally similar: revenues are generated from advertisers and not the users. While digital ad spending is here to stay and will remain the dominant form of advertising, how much or how often advertisers will spend is absolutely dependent on macroeconomic conditions.
The overall macroeconomic outlook was covered in another article a month ago. It’s not a pretty picture: individual debt remains high and wage earnings growth isn’t really keeping up with inflation. Consumer Price Index levels show a returning trend in increasing month-on-month deltas in inflation since July:
Visualization by Statista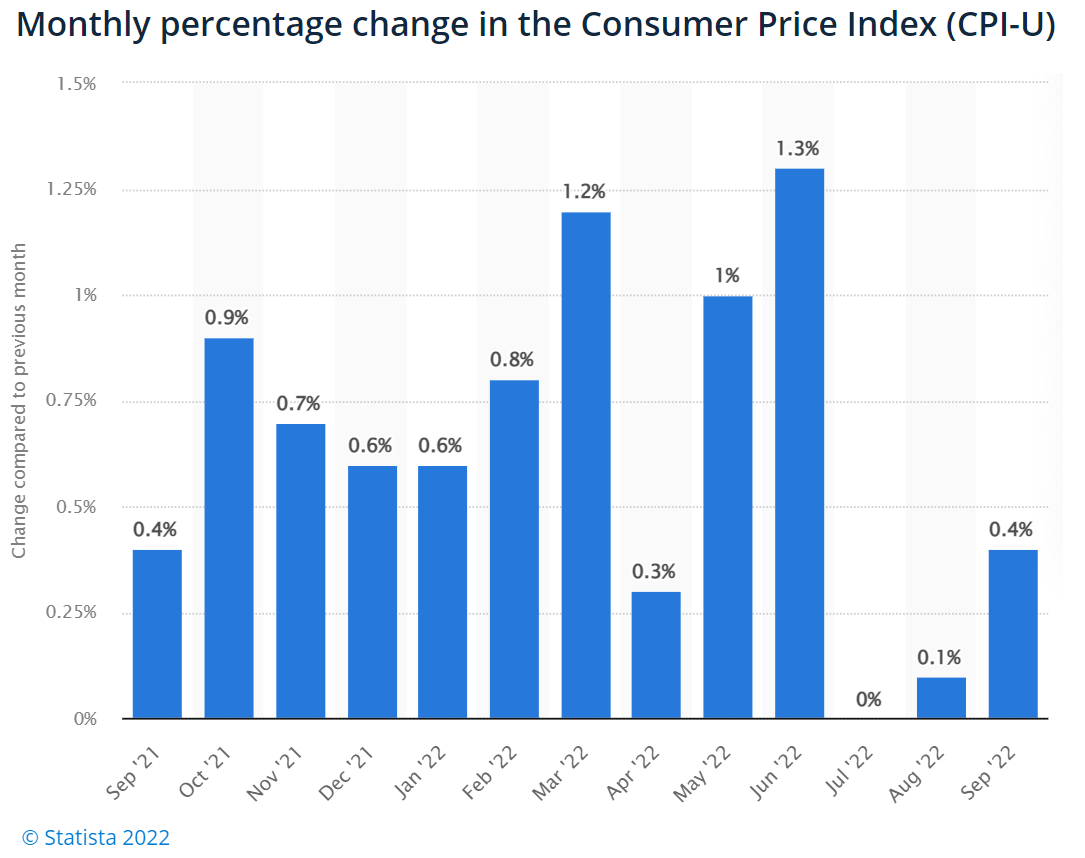
With an ongoing squeeze in incomes and spends, the question is: will advertisers continue to spend as much and as frequently as they used to? If the answer is yes, the company’s revenue streams are likely to rise in the near- to mid-term. If not, the tension the streams face bear a strong relationship with the broader economic outlook.
An examination of the trends in the Price to Earnings (PE) Ratio relative to the broad-market S&P 500 (SPX) with correlation as a “goodness of fit” measure would be in order, similar to that done for Apple as well as Meta.
Source: Created by Sandeep G. Rao using data from GuruFocus and Zacks’
As it turns out, there’s a roughly similar tale in trends coming to light: while the company was valued somewhat higher than the index in 2019 and 2020, the stock did face a reversal of sorts in 2021. In the Year to Date (YTD), the higher relative valuation is missing and correlation has been increasing in nearer periods.
Given its close relationship with advertising (and by extension, consumer spending), analysts generally deem the company to be an important bellwether for the economy. In consensus estimates in the YTD so far, the company missed them by a small margin.
Source: Google Finance
A sort of unwritten rule of thumb among institutional analysts is that earnings growth are generally estimated somewhat conservatively. As a result, positive earnings surprises tend to be more common than not. As a result of the surprise, there is a momentary bump in the stock’s price.
However, earnings expectations being missed by a company that is rather exceptionally well-led and essentially has global dominance in its core business suggests that the tensions wrought by macroeconomic conditions had been underestimated.
Furthermore, individual investors have been exiting the market in droves throughout the year, with the last week of September alone accounting for nearly as much in exits as the rest of that month.
Visualization by Wall Street Journal and AAII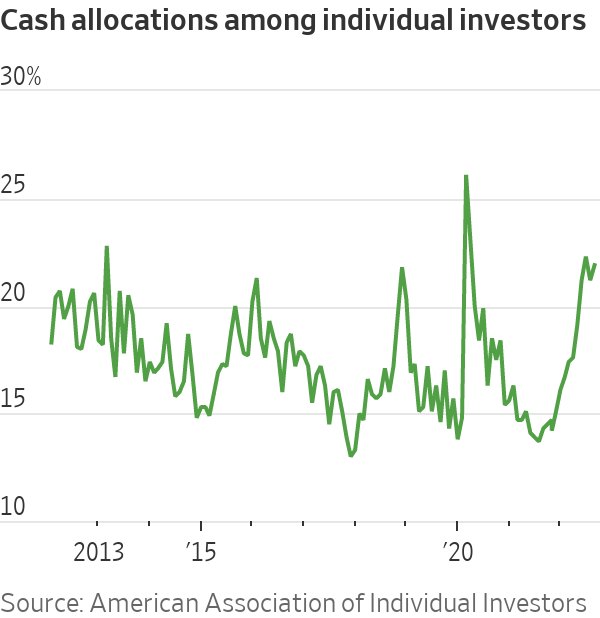
This has also contributed to the loss of market liquidity that the October edition of Bank of America’s Fund Manager Survey reported. The growing correlation with the broader index is another cause for concern. Nearly 91% of the survey’s respondents – who govern nearly $1.1 trillion in assets – don’t expect global earnings per shares (EPS) to rise substantially over the next 12 months.
Source: Bank of America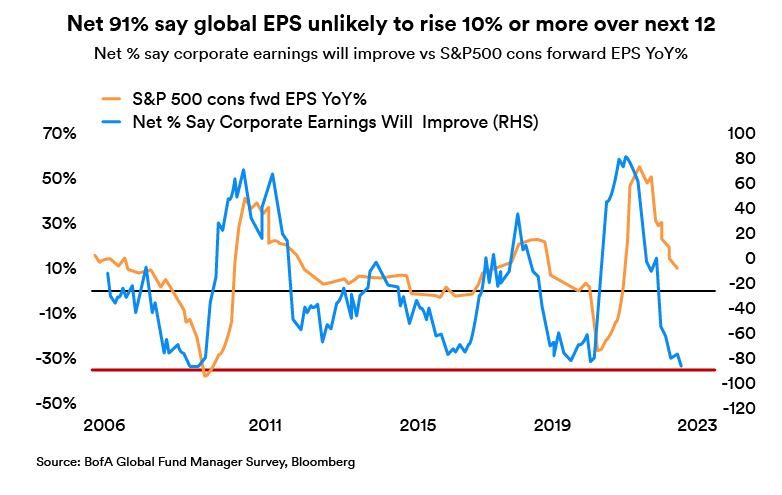
In confirmation of this assertion is the fact that the forward earnings of the S&P 500 is also under significant bearish pressure and has already erased valuation gains nearly all the way back to start of 2019.
Source: Fidelity Management Research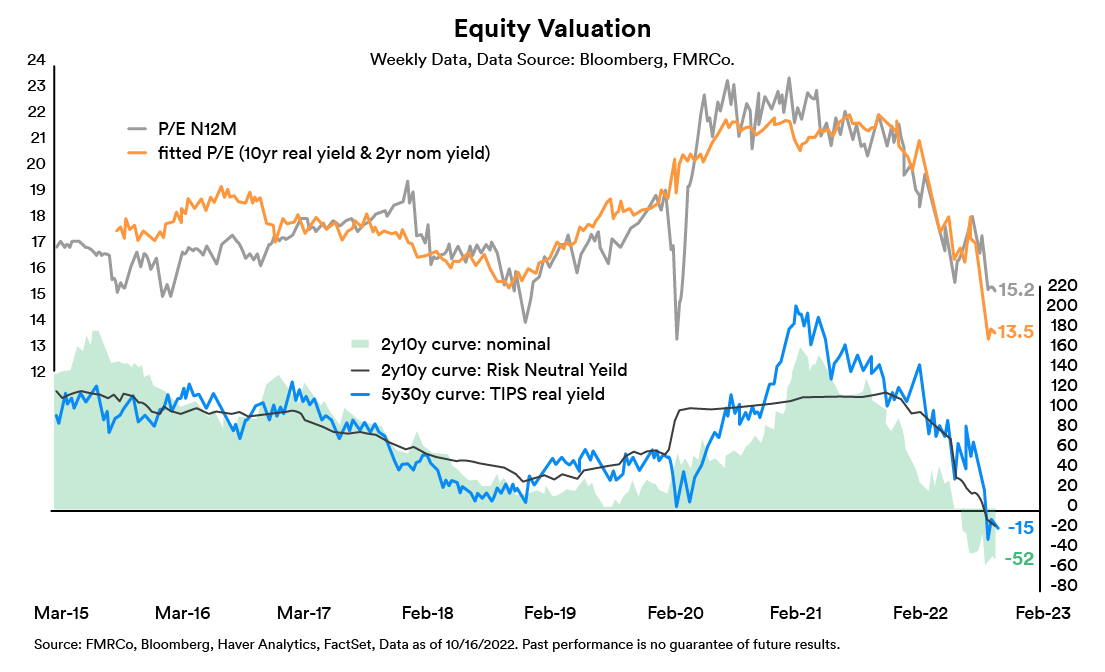
In Conclusion
There’s every possibility that most analysts might have adjusted their models as a result of which Alphabet’s upcoming earnings will be a positive surprise. Given lowered liquidity, there’s no telling if the stock price bump will be pronounced or even sustained.
In the last couple of weeks, a number of closed-distribution reports produced by investment houses (none of which can be fully reproduced on this platform) have indicated that high-net worth investors and institutional investors have switched to purchasing broader ETFs over stocks.
Source: Bank of America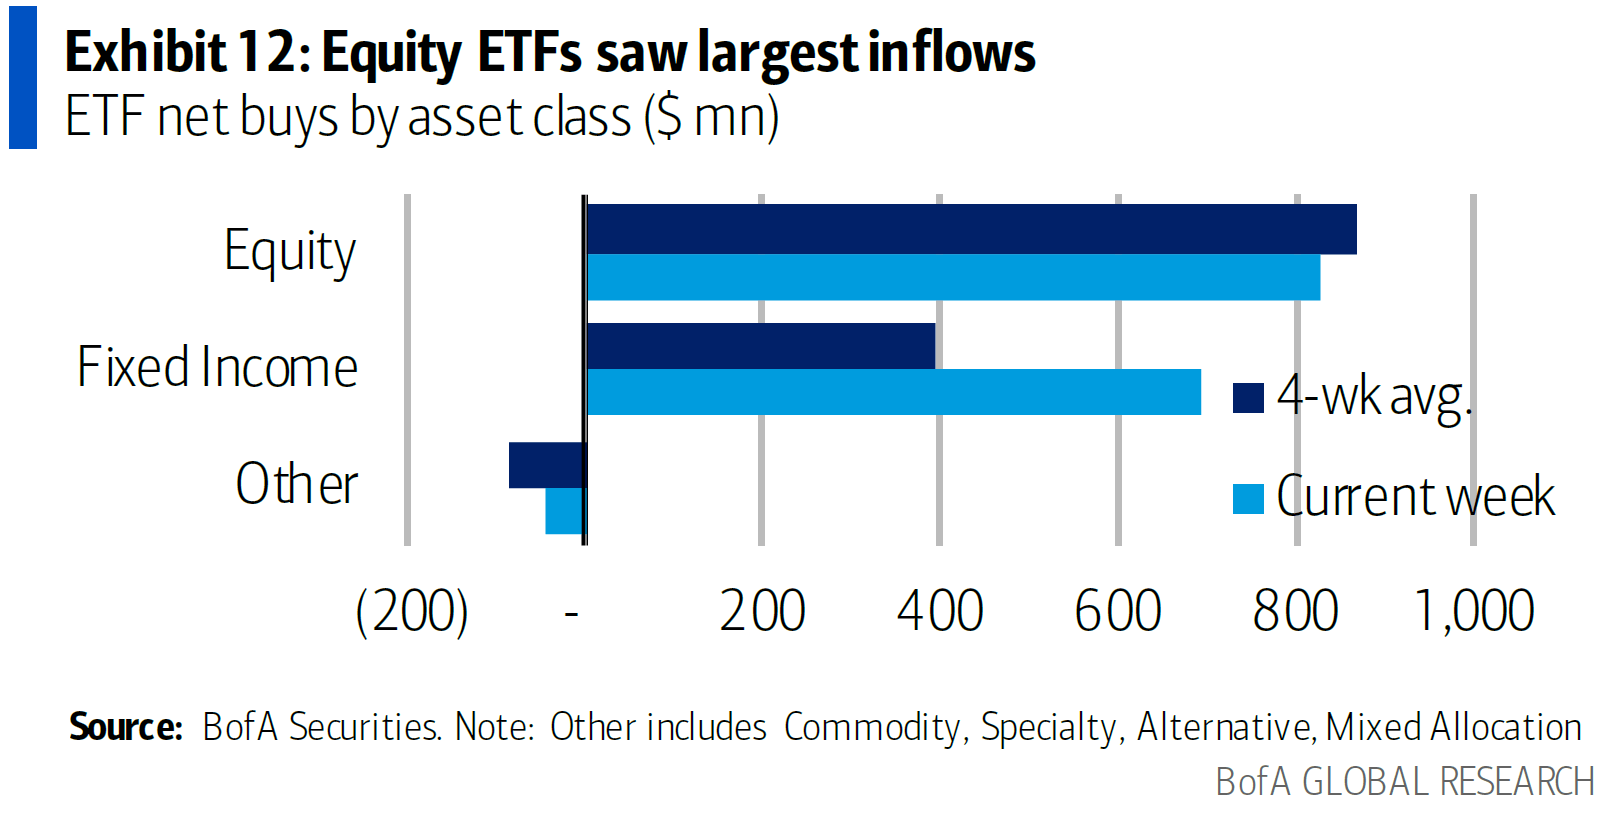
However, the inflows have increasingly been towards defensives and energy, as opposed to “Tech.”
Source: Bank of America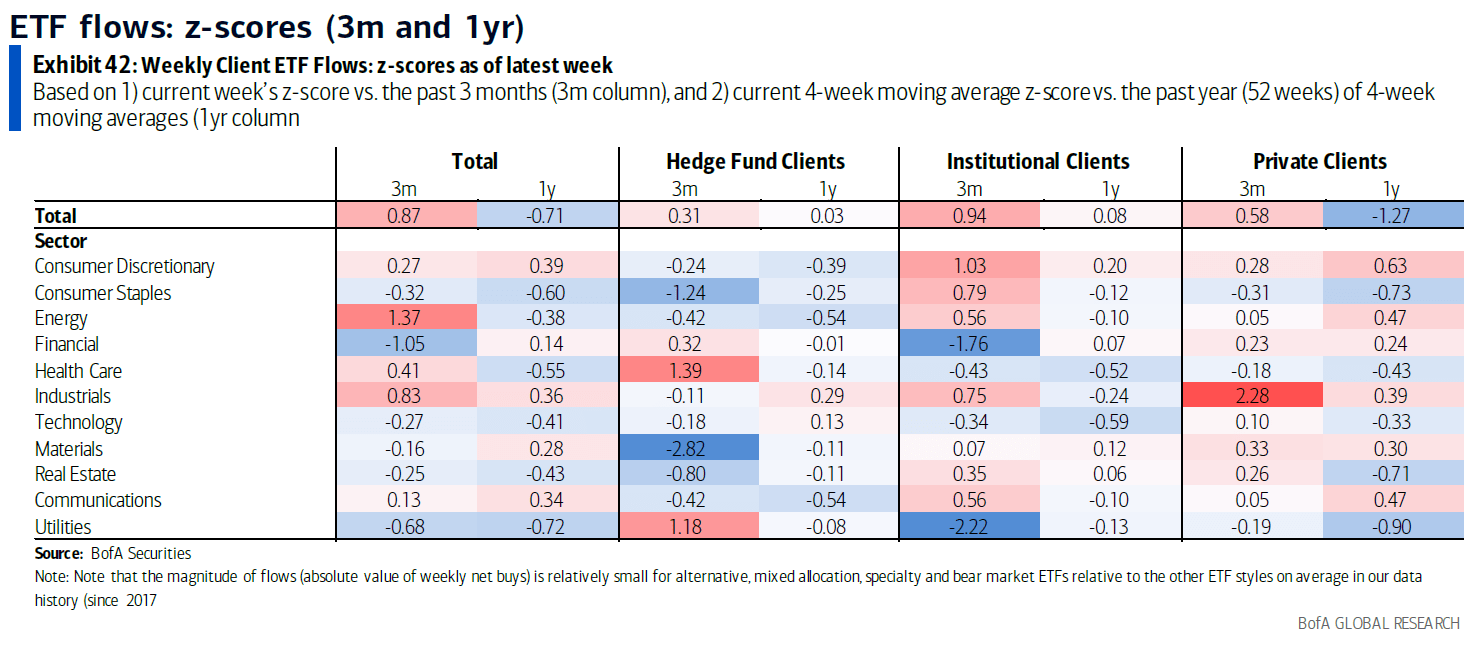
Given that the company’s stock is included as a constituent of many broad ETFs, it is very likely that the stock price will witness some rises as further units of ETFs are created and traded.
On its own, however, the merits of picking the stock isn’t very clear at the moment, through no fault of the leadership’s business decisions or any rival. Quite simply, it’s the economy.
A “wait and watch” approach is the most prudent choice to make in this case. Hence, the recommendation is to “Hold.”
Be the first to comment