

Wiyada Arunwaikit/iStock via Getty Images
We valued Alpha and Omega Semiconductor Limited (NASDAQ:AOSL) at $1.66b or $62 per share, representing a 51% upside from today, and a one-year price target at $70.
We believe that the current general pullback in stocks is a blunt market-wide event, which will be more expressed in smaller cap stocks. The fundamentals of stocks in this category, such as AOSL justify a larger valuation, and the stock is primed to appreciate once the market corrects. We will outline the business model, fundamentals and valuation in the sections below.
The chart below shows our estimated intrinsic value of the company vs the historical market cap:
Chart 1. AOSL Historical Market Capitalization and the Current Value Line (Image created by author using data from fmpcloud.io)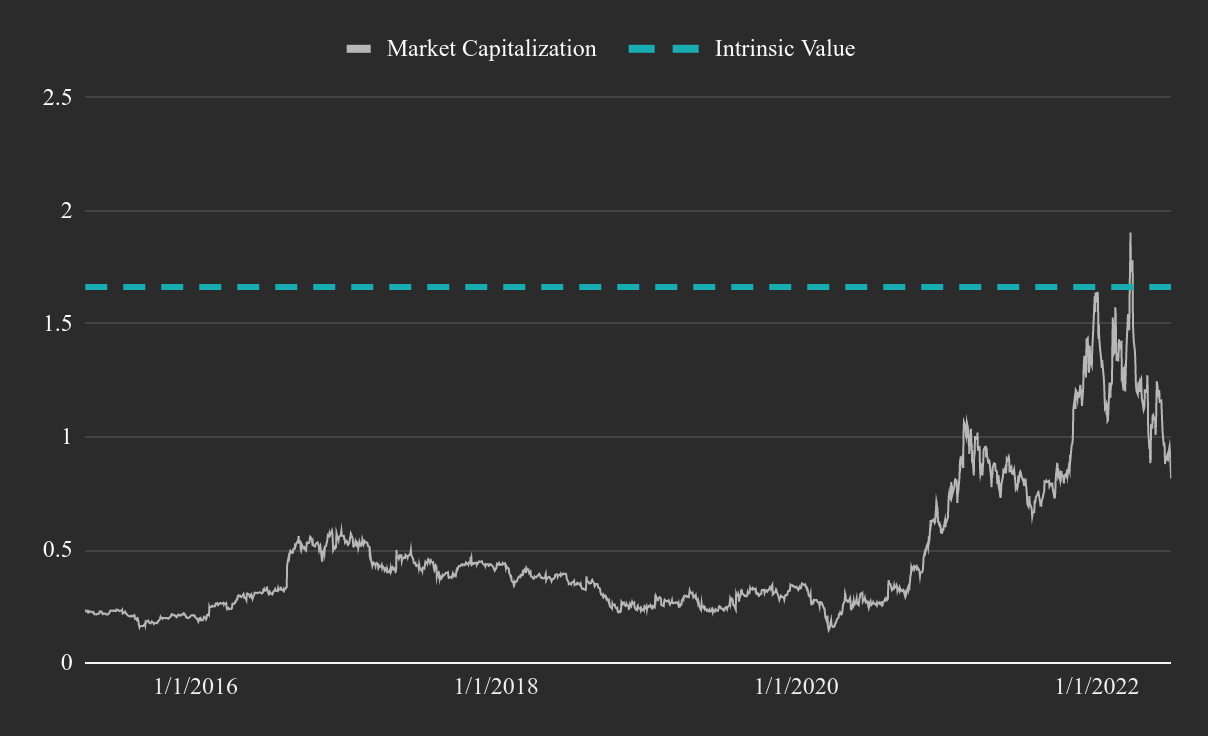
The Business
AOSL is a U.S. headquartered company that sells power semiconductors – small chips that regulate power flow in electronics. AOSL primarily sells in the Asia Pacific region to a relatively small number of customers. This exposes it to geographical risk, and investors may like it better if the company grew the number of customers, as diversification can mitigate a possible decrease in demand.
The way it is set up, AOSL designs and patents, while a foundry manufactures, and then the company packages, tests and sells the products. Their main pitch is that they are needed to engineer increasingly complex power requirements of advanced electronics, which is what most of their U.S. operation does: design, engineering and sales. The company does produce most of its MOSFETs in their 8″ Oregon Fab, and gets the rest (IC & MOSFET) from their fab partners.
The image below showcases some of AOSL’s production capacities:
Chart 2. AOSL Manufacturing Fabs and 3rd Party Partner Fabs (Q1 2022 Investor Presentation)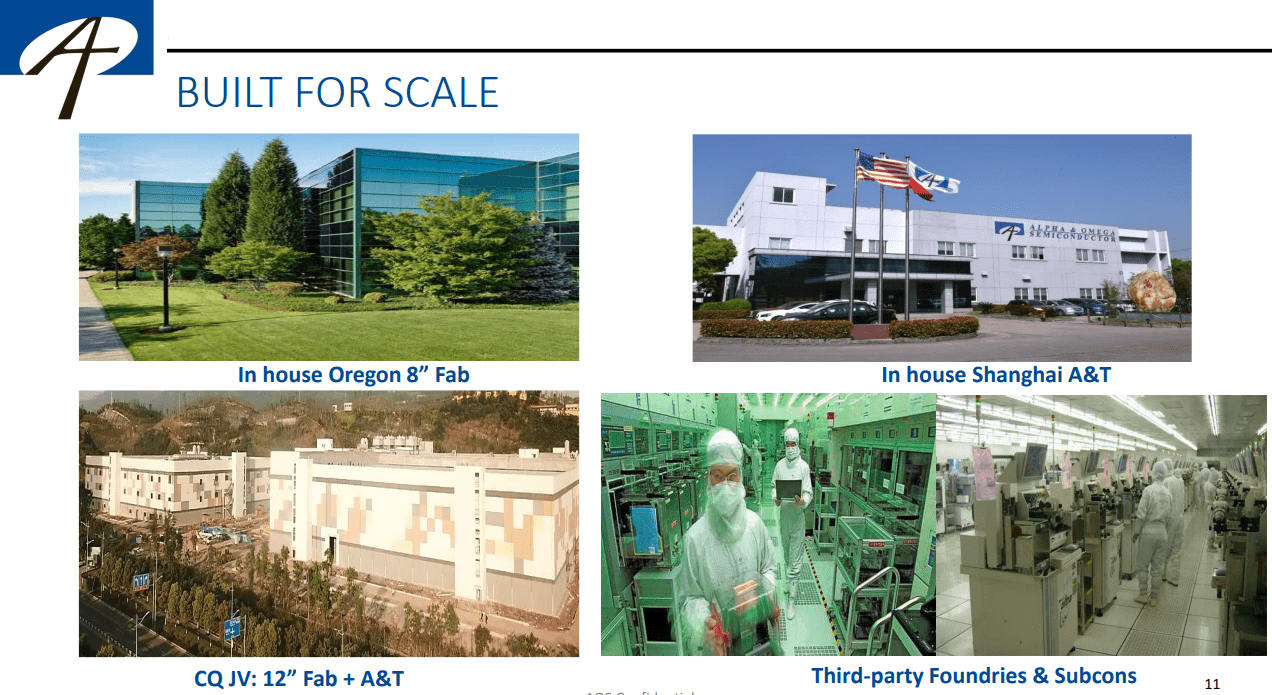
The company uses foundry services from Asia, where they buy their wafers and other finished products. These semiconductor foundries, “fabs”, are built around the world, but concentrated in Taiwan, which may present a supply issue in the future, similarly as having concentrated natural gas supplies in Russia now presents a supply issue for Europe. This is why companies and governments are now on-shoring and investing in manufacturing capacities that are not dependent on Asia.
The company has two packaging and testing facilities in Shanghai, which were hit by the hard lockdowns, but gained permission to operate while shifting part of the workforce to temporarily live in the factories. Investors in AOSL are continuing to bear the risk of possible future lockdowns. However, for investors that believe that this is a temporary and unsustainable practice, they may be able to capitalize on a fear-driven failing stock price.
What Does AOSL Sell?
In order to get a general grasp of what AOSL produces, we can to think of their products as small component semiconductors that regulate the power flow of electronic devices. This means that the products are needed in any device that uses a power circuit, which is why AOSL’s products have a such a large area of use. Application includes semiconductors for: smartphones, PCs, gaming devices, vehicles (internal combustion and electric), home appliances, TVs, laptops/notebooks, servers, solar panels, etc. In essence, electrical components that need a power flow can regulate it using AOSL products. This is important, as it means that the company can have a wide product portfolio, with multiple industry applications, which is exactly what we find in their documentation. AOSL’s product portfolio has about 2400 semiconductor products, and are constantly expanding their product range in the direction of more efficiency, smaller size, and less power consumption.
The image below categorizes the product fit for AOSL:
Chart 3. AOSL Possible Product Applications (Q1 2022 Investor Presentation)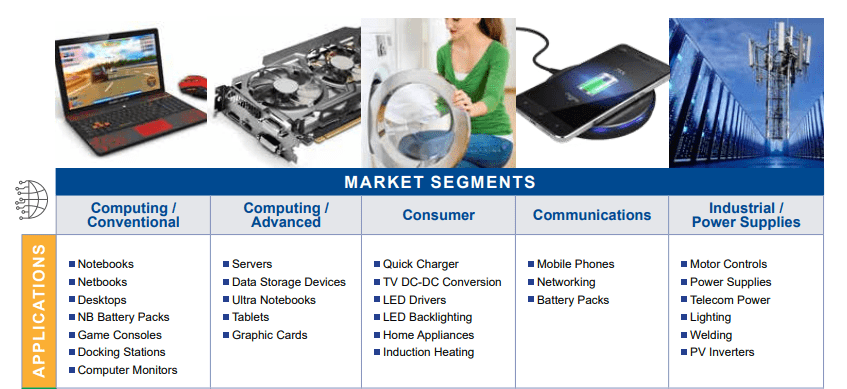
While these are the product applications, we can use the revenue distribution to see where AOSL finds its market. In the chart below, we can see that the company has the most success with selling to the computing industry with notebooks, servers and graphics cards. The graphics cards segment was in high-demand in the past few years because of its utility for crypto mining. However, now that Bitcoin prices are down this venture is not as lucrative and the market may see discounts for new and used graphics cards, possibly impacting the demand for these components.
Chart 4. AOSL Product Portfolio (Q1 2022 Investor Presentation)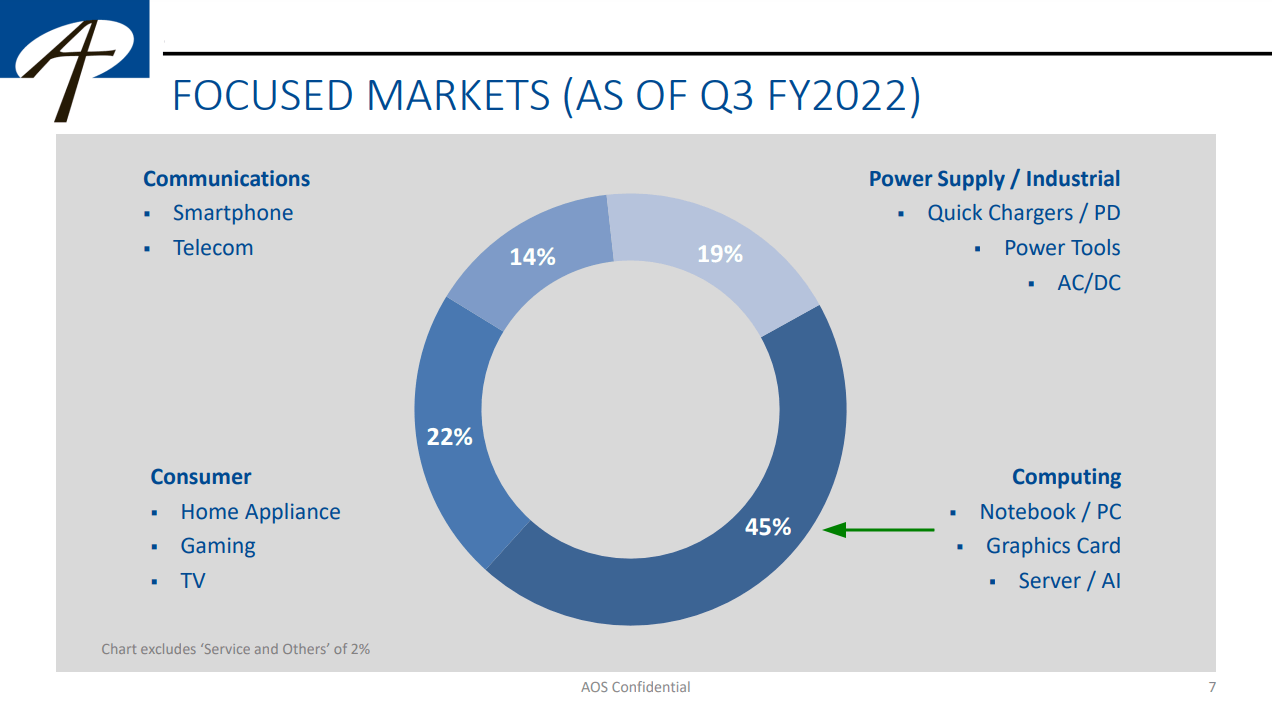
A diversified product portfolio protects against some cyclical headwinds, and in the case of AOSL it may be more valid to use expectations of future industry trends, as opposed to a single product forecast.
Where Does AOSL Sell?
Considering geographical revenue, we can see that AOSL sells most (81% in the last quarter) of its products in Hong Kong, whose clients in-turn sell to domestic and international markets, meaning that the end consumer is not necessarily based in Hong Kong. We need this information in order to estimate business risk for the company, as different countries have different risk premiums, which we use in our valuation.
Chart 5. AOSL Sales by Region (First Quarter 2022 10-Q)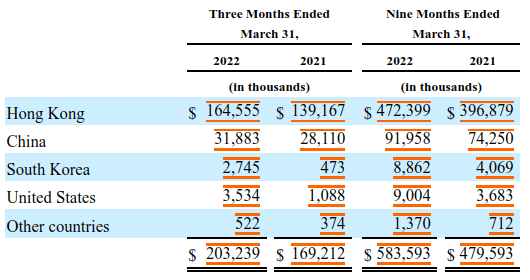
When constructing our risk picture of the company, besides the revenue streams, we can utilize the geolocation of assets. This gives us a better picture of risk exposure, as it allows us to combine the exposure of revenue streams and the location of hard assets.
Chart 6. AOSL Geo-distribution of Assets (First Quarter 2022 10-Q)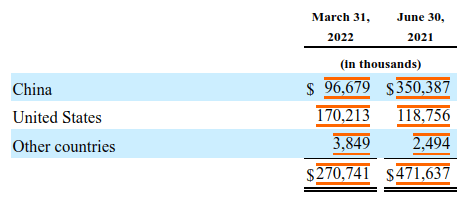
We see that most of the company’s assets are now located in the U.S., and we will analyze the reason for this in the next segment.
China “JV” Plant Divestiture
AOSL de-consolidated or sold a large portion of the Chinese assets, this is reflected in the change of the manufacturing machinery equipment assets line-item in the balance sheet.
Chart 7. AOSL Change in Assets (First Quarter 2022 10-Q)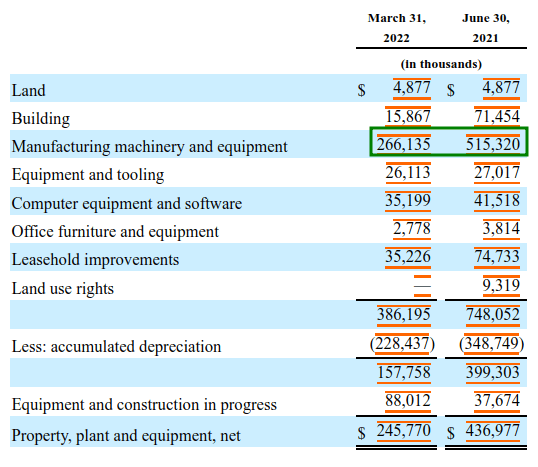
This is because the company sold its controlling stake of its Chinese-based manufacturing plant. This plant was initiated as a joint venture (JV) between AOSL and 2 investment funds in 2016, which resulted in the building of a power semiconductor packaging, testing and 12-inch wafer fabrication facility in China. As of March 2022, AOSL owned 42.2% equity interest in the JV Company, down from 50.9% before divestiture. While the official reasoning given to investors is that this divestiture is resulting from an effort to allow the JV company to expand capacity by scaling up and preparing for an IPO, investors may justifiably interpret this as an M&A failure.
Key Customers
The more customers a company has, the better the risk profile. This is because a company can have an easier time making up for the lost revenues of one customer by possibly finding an increased demand in others. This is especially relevant, if the company sells to customers in different industries, because it can offset the cyclical headwinds in one industry with an increased demand in another. Finally, more customers indicate that the company can allocate more production capacity to the highest bidder, which pushes them towards higher-margin operations.
The table below shows the most recent distribution of accounts receivable streams by key customers:
Chart 8. AOSL Accounts Receivable by Clients (First Quarter 2022 10-Q)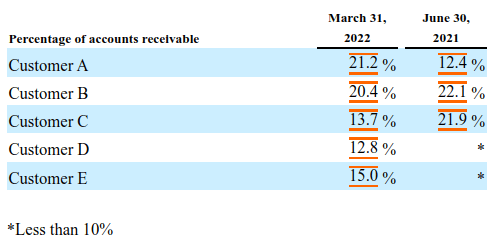
While we don’t have access to the exact customer list, the latest earnings webcast commented on Intel (INTC), HP Technologies (HPQ), Dell Inc. (DELL) as being key clients, likely in the personal computer and device space.
For AOSL, we can see that the top 5 customers make up 83% of the (quarterly) accounts receivable. This does imply some risk of customer walk-outs or decreases in demand, and investors may be happier if the company manages a larger number of customers. We can also see that pre-2022, only 3 customers made up the majority of accounts receivable (56.4%), while only 2 customers accounted for 63% of the latest quarterly revenues.
Up to December 2019, one client of the company was Huawei, to which AOSL ceased exports in order to comply with a U.S. Department of Commerce “DOC” investigation into the customer.
Semiconductor Market Growth
Based on the May 2022 forecast release from The World Semiconductor Trade Statistics, we can see that semiconductors are still in a growing market. In 2022, the global semiconductor market is expected to grow by 16.3%, and in 2023, it is expected to grow revenues by 5.1%.
Conversely, a report by PR Newswire estimates a 4% CAGR up to 2024 for semiconductors. Our third source, Any Silicon, cites a 6.7% CAGR semiconductor growth for manufacturers through 2026 – these are the foundries “fabs” we mentioned that take orders from international companies and stick to production. Nonetheless, this gives us a good indication on what to expect in the next few years going forward. What we need to estimate next is if AOSL will grow market share faster than the industry averages.
Finally, looking at the supply concentration from Any Silicon, we can see that semiconductor production and sales is concentrated in a few key companies. Of particular note, is the fact that most of the production is concentrated in Asia, which can cause bottlenecks if regional trade becomes hot in the future.
In conclusion, we estimate that AOSL is positioned within a growing industry, which even given extended headwinds in the PC and device segment, is still primed to expand on the back of innovation and energy efficiency. It is likely that we will see a short-term cyclical downtrend in the industry, but the long term market for semiconductors seems to be expanding. AOSL may also benefit from government onshoring incentives, which seek to strengthen the strategic interests of western businesses.
Valuation
Note that in the charts below, all values are in billions USD unless specified. A copy of the full analysis & model can be found here. (When prompted, click “Make a copy” and login with a Gmail account. If you are having trouble accessing the sheet, click here for a preview-only HTML.) You may also try different value drivers to come up with your own valuation in the copy.
We have used our research thus far to gain a better understanding of the business. Next, we will review a set of key fundamentals, which will help us build a grounded DCF valuation model for AOSL.
Growth
In the last 12-months AOSL grew by 26.4%, and perhaps more importantly, managed to drive efficiencies in their business as revenue grew 11% more than COGS. The 5-year revenue CAGR is 15.1%, while the average growth within the industry has been about 6.6%.
The chart below, reveals the benefits of the supply-chain shortage in 2021-2022, with a peak in Q3, and currently decelerating by 32% YoY.
Chart 9. AOSL Historical Revenue Rolling TTM Growth Rates (Image created by author using data from fmpcloud.io)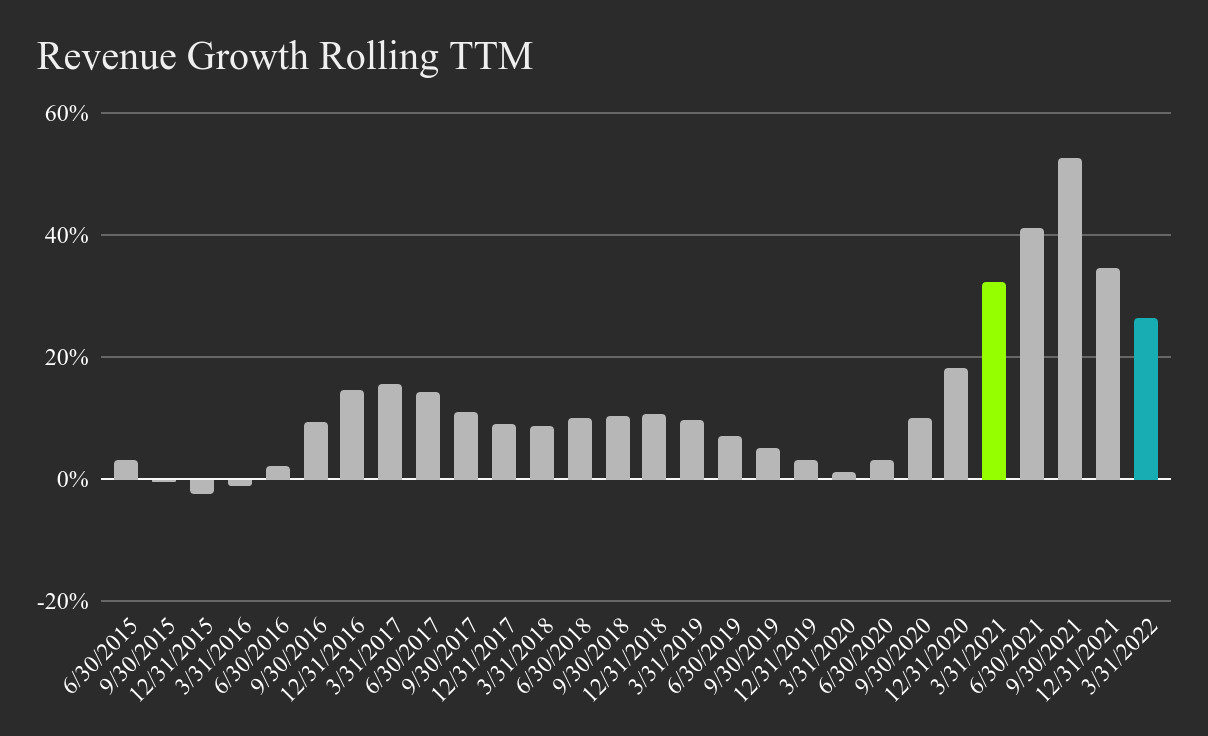
While the company likely has some organic expansion left, we can see how growth would slowly shift towards the industry average. We also evaluated the growth capacity based on the fundamentals e.g. how much can a company grow by reinvesting into the business, and found that the long-term fundamental growth rate is about 8%. Finally, given how the market is pricing the stock, we found an implied 12.5% growth rate for next year.
Given our analysis, we estimate a revenue growth rate of 12.5% next year, and 8% for the 4 years after that, finally converging on the risk-free rate of 3%. With this configuration, we are growing our base revenues by 100% in 10 years. A key risk with this assumption is that a recession hits harder than anticipated and revenues struggle to move higher than the inflation rate. We believe, that while our estimates can be wrong for individual years, a 10-year revenue target of about $1.5b is attainable by AOSL.
Profitability
Please ignore the jump in the net income margin as it reflects proceeds from the sale of ownership stake in JV. A good indicator of the profitability for AOSL is the EBIT margin, which is currently at 14%. The industry average is about 21.2% for international semiconductor companies and 29% for U.S. based. We feel that we cannot justify converging to these averages given the lower position in the product hierarchy for power semiconductors v.s. GPUs and CPUs. That is why we have opted to estimate a convergence on 18% EBIT margin in the next 10 years. The chart below, shows a cyclical pattern every 3 years and it seems that AOSL is hovering around the peak of this cycle.
Chart 10. AOSL Historical TTM Margins (Image created by author using data from fmpcloud.io)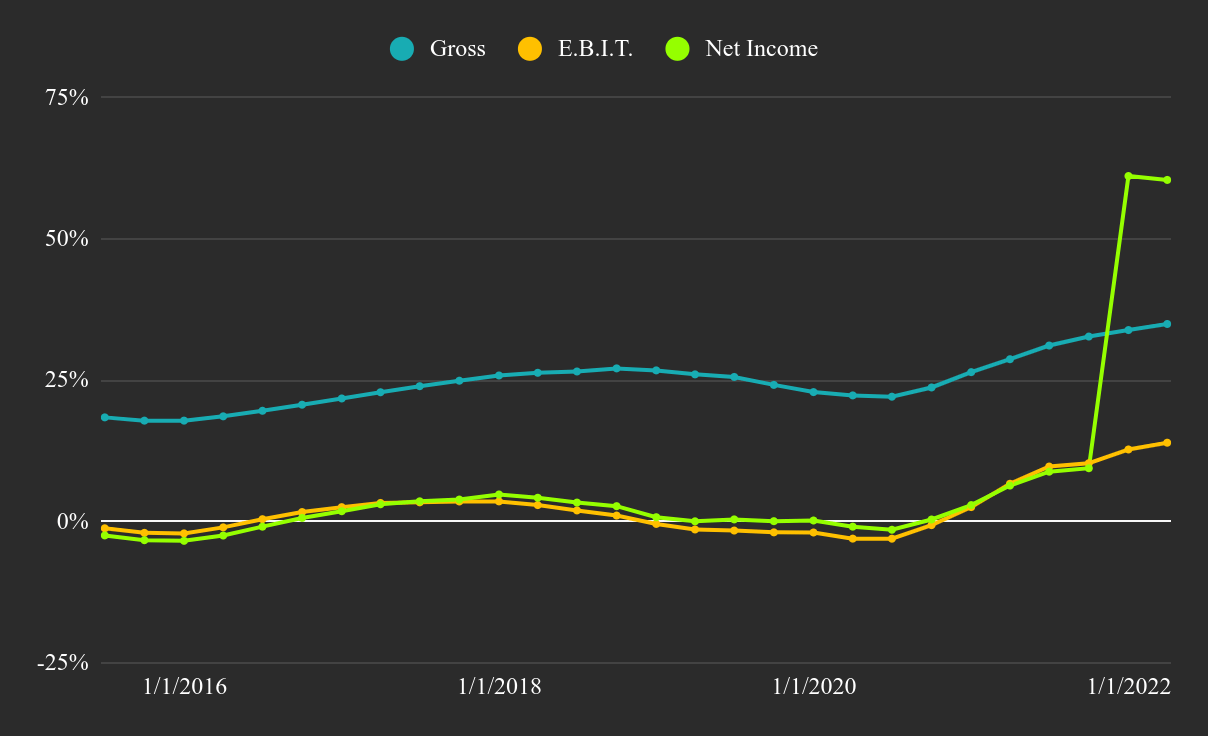
While profitability may cycle down in the future, it is likely that the built-in efficiencies of the company will help them sustain a higher base level in the future, and we may be able to expect a higher peak in the next cycle. This is the main rationale behind our 18% convergence margin estimate. Our estimate reflects an EBIT of $267m in 10 years, a 105% growth from the $131m R&D adjusted EBIT in the last 12 months.
Cash Flows
While analyzing the cash flows we see that a significant reason for the caution expressed from the side of investors is the general absence of free cash flows to investors in the last 7 years. Management will have difficulties convincing investors that their venture is worth investing-in, as they have not established a profitable baseline for an extended period. We can see that the company engaged in extensive CapEx investment around the previous cyclical peak in 2018, but is now changing their story and divesting what it once presented as an opportunity to increase production capacity.
While operating cash flows have grown, the free cash flows to the firm haven’t caught up. AOSL made $65m in FCFF in Q3 2021, and is now back to negative FCFF.
In the chart below, we can see how the company balanced TTM Cash Flows in the past (in millions USD):
Chart 11. AOSL Historical TTM Cash Flows (Image created by author using data from fmpcloud.io)
This leads us to our final valuation model.
Valuation Model
We estimate that the company has a good basis to meet their 2025 target revenue of $1 billion, and our model closely reflects this with a projected $987.5m by FY 2025 and $1.47b by FY 2032. We expect the EBIT margin to converge on 18% in the next 10 years (the company targets a 15% margin by FY 2025). For our cost of capital, we have calculated a value of 10.87% – we strive to estimate the cost of capital that reflects the risk of the business.
Our assumptions and analysis have yielded the following model:
Chart 12. AOSL Future Estimates Model (Image created by author using data from fmpcloud.io)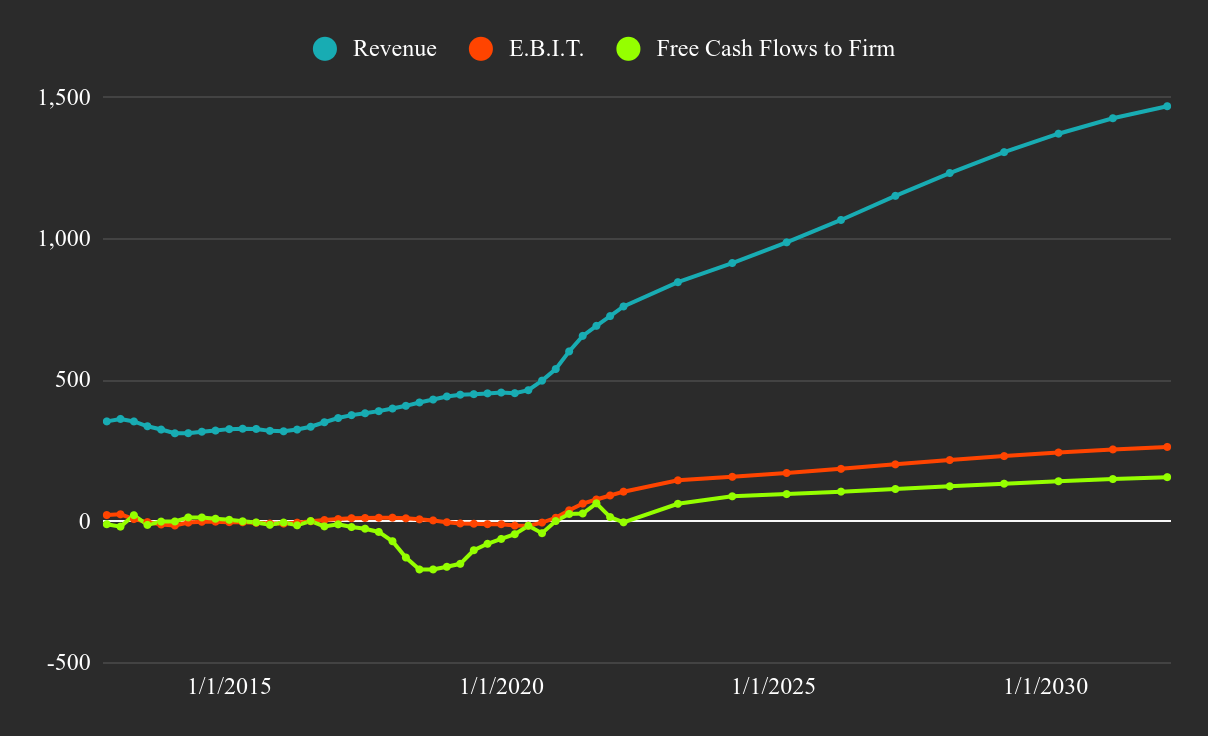
This results in the following values:
- Sum of future free cash flows for the forecasted period of $1.2b
- Present value of future cash flows $630m
- Terminal value $2.3b
- Present value of terminal value $807m
- Sum of present values $1.437b
- Intrinsic value of AOSL (after adjustments) $1.662b
This means that the company is some 51% undervalued as of today at $62.1 per share. By using the required rate of return we get a price target of $70 in the next 12 months, as well as a price target at maturity of $86.5. This indicates that the company is both undervalued by the market today, and will also keep creating value in the future.
Opportunities and Risk Factors
In a valuation it is important to keep track of catalysts and risks. The main catalysts we see is the future bottoming of the equity risk premium (ERP)-driven bear market – with the assumption that earnings forecasts do not collapse. Additionally, as we discussed before, the company has a few key clients, and seems to be increasing their market presence. If news breaks that they have secured new (larger) clients, then this may help the price converge to value. Finally, we see potential for onshoring incentives for U.S. based stocks, and should trade tighten, then companies like AOSL may get priority support. The U.S. has approached the semiconductor industry as a strategic and security priority, which is an additional indicator of the CapEx investment potential in this industry.
There are multiple risks associated with AOSL. The company is led by an older generation CEO, which even though immensely competent, may have more of an interest to run a safe rather than a growing business. Should this structure of management persist, the company’s expansion may be slower than if led by a younger team. We feel that this “management arbitrage” possibility is both a risk and an opportunity that investors should be aware of.
Next is the market outlook. Even though the semiconductor industry is projected to grow, this may change in the future as possible supply bottlenecks and decreased consumer purchasing power lowers demand and profitability. The cyclical aspect may take longer to recover and the company can be stuck in stagnation for longer than anticipated.
Finally, we have the competition. While AOSL is focused on engineering high-performance power semiconductors, competitors may develop and vertically integrate their own power semiconductors, which may be pushed to other device manufacturers as part of combined business deals. One way for AOSL to tackle this is to become a part of larger companies with more capital and bargaining power. However, this has its own drawbacks including a drop in innovation as the company’s team motivation starts becoming someone else’s problem.
In this section we strived to provide the most pertinent risk and opportunity factors. While AOSL has numerous risks which are characteristic of small-cap stocks, we estimate that the opportunities outweigh these risks, and that we have appropriately discounted the value of the stock in order to reflect these and other risk factors.
Possible Investment Approach
While we have issued a buy recommendation, this is not appropriate for all portfolios. Investors should be aware that the convergence to value may take some time to materialize, and we estimate an investment horizon of 2.5 to 3 years. Further, given the current state of the market, our pricing model estimates that there may be more downside in the next few months.
Chart 13. AOSL Pricing Analysis Model (Image created by author using data from fmpcloud.io)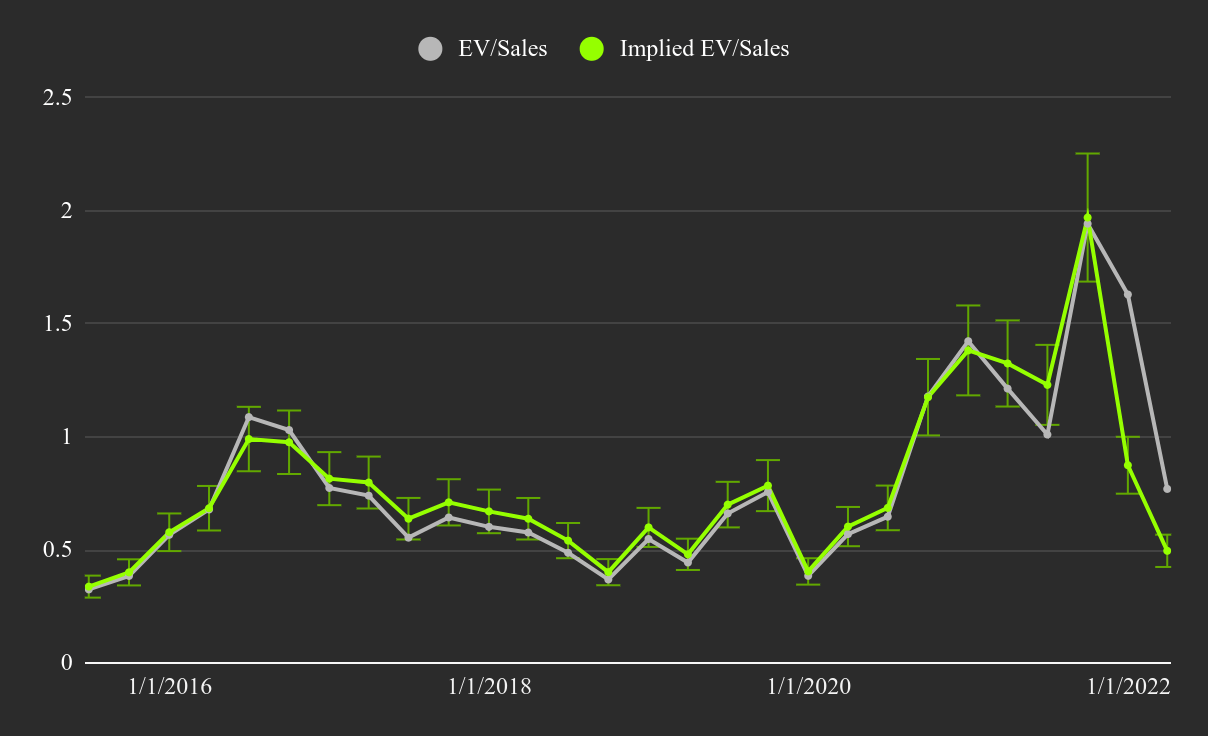
Our current implied EV to Sales is 0.5 with a 14% standard error. This means that in the short-term we expect the price to move in the range between $22.46 and 16.82. In order to mitigate this, a periodic investment approach may be more appropriate than investing in bulk. Finally, as a small cap stock, this should not make up a large stake in any portfolio, and investors may want to be mindful of an overlap with semiconductor companies and connected entities such as (INTC), (DELL), (HPQ) or other future clients, as this will lower the diversification benefits in a portfolio.
Thank you for reading our analysis; we hope it will be useful to you. If you have any companies with potential in mind, write them in a comment below and we will scan them for our next analysis.
All the best!
Be the first to comment