

Jonathan Kitchen
Written by Nick Ackerman, co-produced by Stanford Chemist. This article was originally published to members of the CEF/ETF Income Laboratory on November 3rd, 2022.
Allspring Utilities and High Income Fund (NYSE:ERH) does exactly as its name suggests. It is a closed-end fund that invests in utilities and high-income plays – which means high-yield bonds or junk bonds. This might seem like an odd combination at first. However, for an income investor, one is getting exactly what they are targeting. That is investments targeting strong income-generating characteristics, despite going across the asset class category.
As we touched on last time, this was previously a Wells Fargo (WFC) fund but was sold off and rebranded. Additionally, since our last update, the fund has performed relatively weaker compared to the broader market. The S&P 500 isn’t an appropriate benchmark, but it can give us some context of how the fund is doing relative to the market.
Utility exposure earlier this year was providing the general defensiveness that we often see from the sector. However, higher valuations above historic norms and higher interest rates seem to be taking their toll. Utility names can compete with risk-free yields; with those rising, utilities can become less attractive.
ERH Performance Since Previous Update (Seeking Alpha)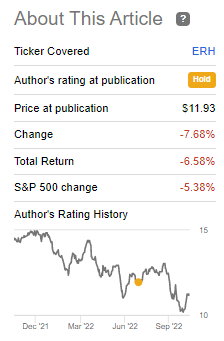
The discount has expanded just a touch since our July article, but I would ultimately still feel more comfortable with an even wider discount at this time. That being said, for those holding the fund now, I still don’t see a strong reason to sell either. That was a change from when the fund was trading at an elevated premium, where it made more sense to move out of the position.
The Basics
- 1-Year Z-score: -0.72
- Discount: 3.81%
- Distribution Yield: 8.18%
- Expense Ratio: 0.93%
- Leverage: 21.85%
- Managed Assets: $137.301 million
- Structure: Perpetual
ERH’s investment objective is “a high level of current income and moderate capital growth, with an emphasis on providing tax-advantaged dividend income.”
To achieve this objective, the fund will simply invest “approximately 70% of its total assets to a sleeve that places a focus on common, preferred and convertible preferred stocks of utility companies and approximately 30% of its total assets to a sleeve of U.S. dollar-denominated below investment grade (high yield) debt.”
Despite the fund’s small size, the expense ratio is generally lower than many other CEFs. Still, a small fund can mean reduced liquidity needs with relatively lower trading volume. Larger investors could find it harder to get a significant position, and getting out can be difficult with a sizeable holding.
When including the leverage expense, the total expense ratio comes to 1.25%. They had borrowings based on LIBOR but are transitioning over to SOFR. Here is a look at how the interest expenses have run over the previous periods. Interest rates are continuing to rise, with the Fed signaling even higher potential rates, which means costs will continue to climb. Being a mildly leveraged fund, it won’t have as big of an impact but still hurts the fund.
ERH Leverage Expense Ratio (Allspring)
Performance – Discount More Realistic
Since our previous coverage, the discount has widened out just a tad further. However, the 1-year z-score was reduced at the same time. This is a result of the fund’s discount now being reflected in the last year. Prior to the last year, the fund was trading at what I’d call an unusual premium.
Ycharts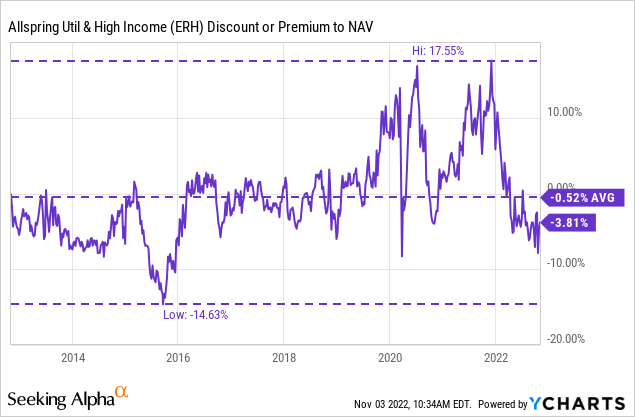
This kind of reflects that the last year and even in 2020, is more of an anomaly. The discount being more realistic now, would really reflect a better level of where the fund had traded historically. With higher interest rates, one could argue that the discount should go a bit wider even. Therefore, that’s really what makes me want to see a greater discount before getting too excited about this name.
Considering the approach of the fund, it isn’t too much of a surprise that they utilize a blended benchmark. One of the problems with a blended benchmark is that the index remains fixed in allocations, but the fund is actively managed. Therefore, while one period might reflect an appropriate comparison, the ability for ERH to go to different weightings might make another period less relevant to a comparison.
With that caveat out of the way, we see that in their latest semi-annual report, it still showed an underperformance.
ERH Annualized Returns (Allspring)
Clearly, they aren’t employing a biased blended benchmark. That being said, the index they utilized has changed.
2 Source: Allspring Funds Management, LLC. The ERH Blended Index is weighted 70% in the S&P 500 Utilities Index and 30% in the ICE BofA U.S. High Yield Constrained Index. Effective October 15, 2019, the ERH Blended Index changed the high yield component of the index from the ICE BofA U.S. High Yield Index with the ICE BofA U.S. High Yield Constrained Index in order to better match the Fund’s investment strategy. You cannot invest directly in an index
A benchmark index provided by the fund can give us an idea of how the fund is performing. I still like comparing it to other CEFs, which can give a better idea of how the fund may be performing since it is a relatively niche category. For ERH’s comparison, I have leaned into Virtus Total Return Fund (ZTR) – a fund that also employs the fairly unique approach of investing in utilities and fixed income. ZTR also invests in investment-grade holdings, so even that isn’t a perfect comparison. The Franklin Universal Trust (FT) is also a similar approach to these two. Except they put an even heavier emphasis on fixed income.
With that, here are the YTD results of these three funds for comparison purposes. On a total NAV return basis, ERH has outperformed thus far. On a total NAV return basis, the fund had been hurt after coming down from its loftier premium relative to these names.
Ycharts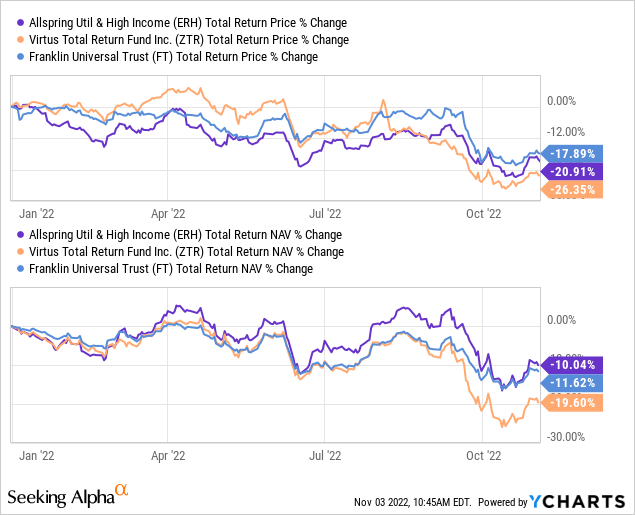
Distribution – Variable But Predictable
The fund pays what ends up being a variable amount each month.
ERH Distribution History (CEFConnect)
However, how it is decided is absolutely not random. They pay at a 7% average NAV of the previous 12 months. When the NAV was rising, this helped to bump the payout up. With a struggling NAV as losses mount heading into the final stretch of the year, the payout is being reduced.
Some investors won’t like this payout style as some strive to collect level payouts. On the other hand, it is still quite predictable that the direction of where the payout will go depends on the NAV direction.
In the latest fiscal year-end, the net investment income stayed relatively flat year-over-year. The reduction could have come from the higher interest expenses experienced by the fund.
ERH Annual Report (Allspring)
Interestingly, the NII per share seems to have taken a large jump year-over-year. This can fluctuate a bit due to repurchases and new shares being issued due to a DRIP. This happens because the average outstanding shares can vary from what is reported at the end of the period. Since ERH had been trading at such a high premium, they were issuing shares. Still, I can’t quite figure out why the NII in 2021 would be reported at such a low figure.
ERH NII Per Share (Allspring)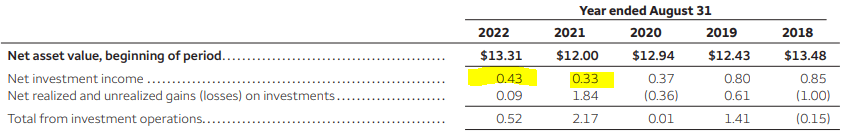
We can see the NII above for the prior fiscal year was $4,083,654. They also showed “9,284,282 shares issued and outstanding” at the end of that period. That would result in an NII per share of $0.4398. That seems closer to accurate as we can see the actual NII year-over-year also had a slight decline.
For comparison, in this latest period, they reported “9,292,296 shares issued and outstanding.” Against the NII we see above, that gives us an NII per share of $0.4335, which is consistent with what the report tells us.
In the end, the NII being reported isn’t necessarily important due to the managed distribution that they employ. That is decided by what the fund is earning, but as long as the total net assets are correct, that dictates the payout, not what the fund is earning.
Still, being able to reconcile this would be great. Unfortunately, I don’t have any contacts with Wells Fargo or Allspring to reach out to.
ERH’s Portfolio
ERH runs a fairly heavy equity exposure portfolio. However, that doesn’t necessarily make it an aggressive fund. Since it is allocated to utilities, it could be considered fairly conservative compared to funds that invest in more cyclical names.
Since our previous update, the actual allocations have remained fairly steady, with equities being around 70% of the fund. Over the last couple of years, portfolio turnover has been running a bit light relative to where the fund was previously. In fiscal 2022, turnover was 23%. 2021 had a turnover of 34%; then, in 2020, it was even higher at 68%. In the previous two years before that, 2019 and 2018, the portfolio was really managed actively, with 131% and 109% turnover, respectively.
The weighting shown below was at the end of June 30th, 2022, the latest fact sheet available.
ERH Asset Allocation (Allspring)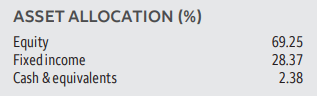
Given the utility emphasis, the exposure here is almost entirely comprised of utilities. There are only small, basically meaningless allocations to financials, energy and consumer discretionary. This data is also from the fact sheet as of June 30th, 2022.
ERH Asset Allocation (Allspring)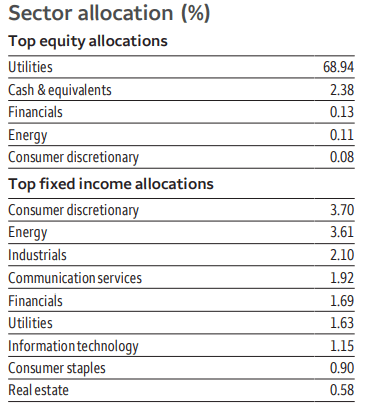
On the other hand, their fixed-income allocations are a bit more diversified. Being that it is a slim portion of the portfolio, each allocation’s importance is reduced. That can be a benefit for high-yield bond funds. Since they are targeting investments in below-investment-grade positions, diversifying helps limit the negative impact one or two names might have.
On the other hand, equity positions are lower in the capital stack when it comes time for bankruptcy; they often see no recovery. Still, I wouldn’t be too worried about the utility companies that ERH is holding, considering they are concentrated in investment-grade names with strong financial positions.
Here is a look at the top 15 holdings as of September 30th, 2022.
ERH Top 15 Holdings (Allspring)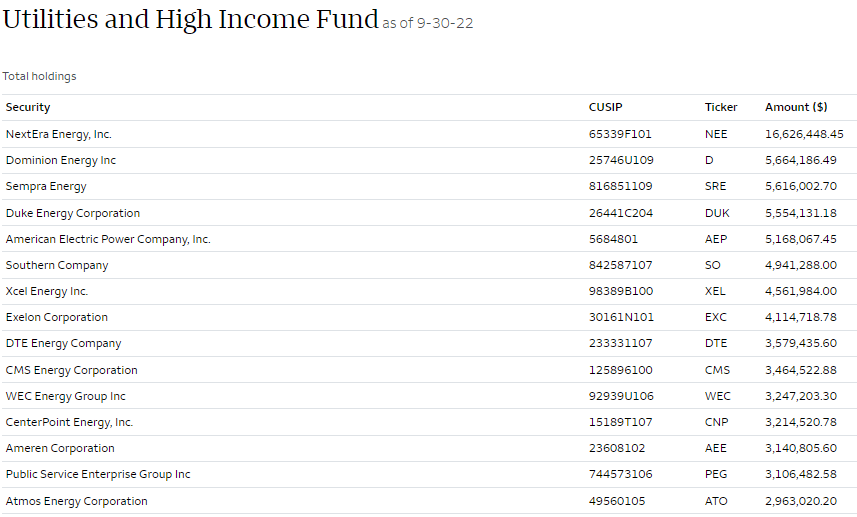
Conclusion
ERH’s discount has opened a bit further, but it still doesn’t look like a buy quite yet. Given the current environment, I think a fund such as ERH could get an even wider discount before becoming tempting. If you currently hold shares of the fund, I don’t necessarily see a strong case for selling at this time, either.
Be the first to comment