

tifonimages
A Guest Post by Ovi
Below are a number of Crude plus Condensate (C + C) production charts, usually shortened to “oil”, for Non-OPEC countries. The charts are created from data provided by the EIA’s International Energy Statistics and are updated to September 2022. This is the latest and most detailed world oil production information available.
Information from other sources such as OPEC, the STEO and country-specific sites such as Russia, Brazil, Norway and China is used to provide a short-term outlook for future output and direction for a few countries and the world. The US report has an expanded view beyond production by adding rig and frac charts.
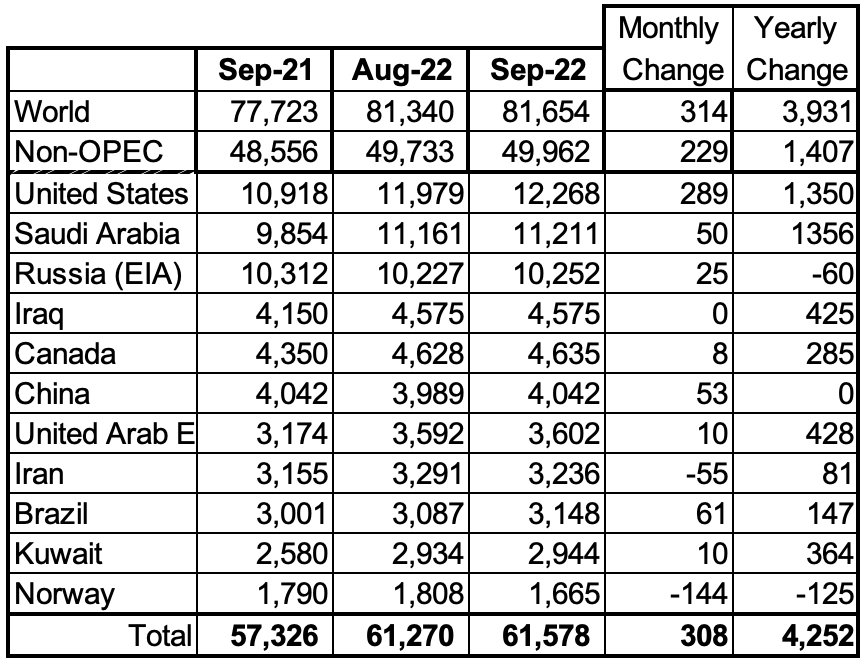
September Non-OPEC oil production increased by 229 kb/d to 49,962 kb/d. All of the increase came from the US, 289 kb/d. The largest offsetting decrease came from Norway 144 kb/d. Note that August output was revised down from 49,879 to 49,733 kb/d. This means that the September increase relative to the original August estimate is 83 kb/d.
October is expected to add 527 kb/d. This appears to be optimistic based on a few country charts below which project October production. Brazil +97 kb/d, Canada -600 kb/d, Kazakhstan +235 kb/d, Norway +100 kb/d and Russia +124 kb/d for a net of -44 kb/d. Maybe the EIA is not aware of the Canadian drop in October. The positive increments add 556 kb/d.
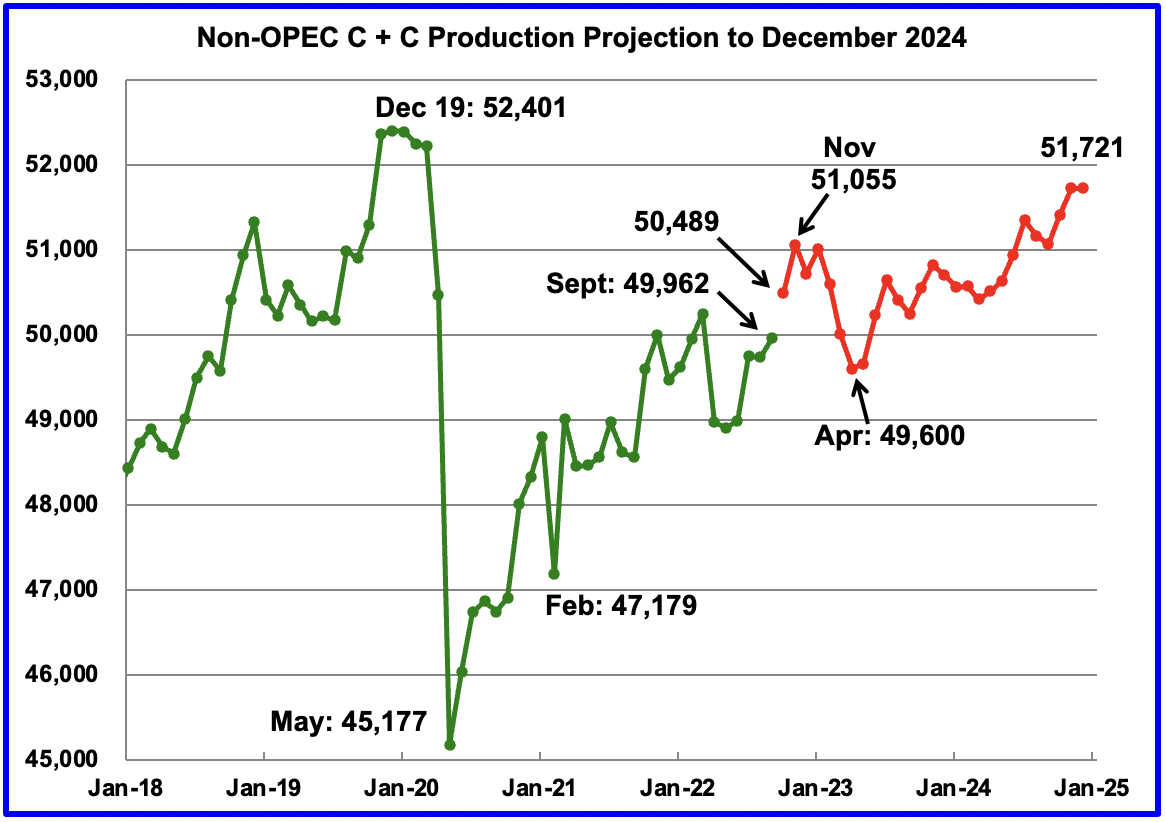
Using data from the December January 2023 STEO, a projection for Non-OPEC oil output was made for the time period October 2022 to December 2024. (Red graph). Output is expected to reach 51,721 kb/d in December 2024, which is 680 kb/d lower than the November 2019 peak of 52,401 kb/d.
Note that after the November 2022 post pandemic high of 51,055 kb/d, production drops to 49,600 kb/d in April 2023, before resuming its climb. The drop is primarily due to a projected drop in Russian oil output.
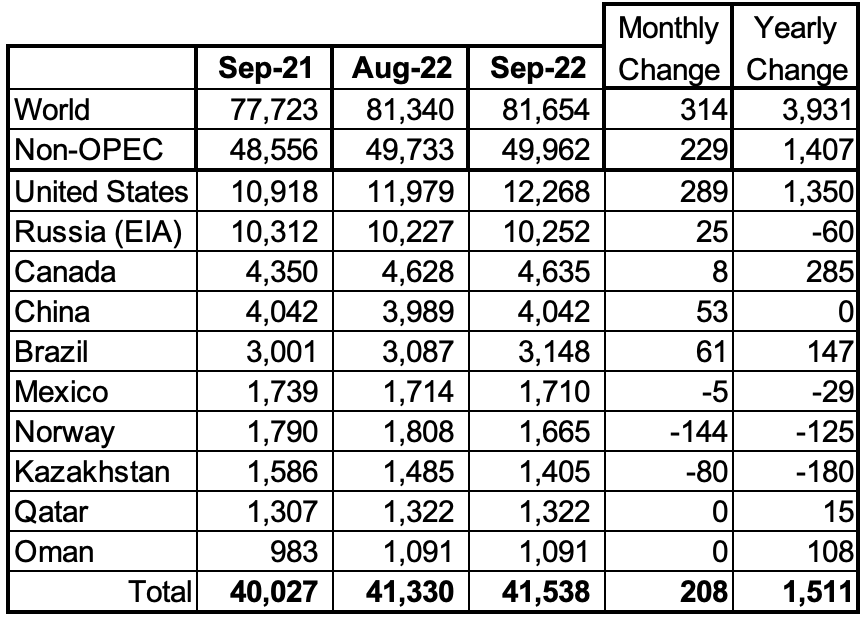
Listed above are the World’s 10th largest Non-OPEC producers. The criteria for inclusion in the table is that all of the countries produced more than 1,000 kb/d. Only Norway and Kazakhstan experienced an MoM production drop in September.
The overall September production increase for these ten Non-OPEC countries was 208 kb/d while as a whole the Non-OPEC countries increased output by 229 kb/d.
In September 2022, these 10 countries produced 83.2% of the Non-OPEC oil. On a YoY basis, Non-OPEC production increased by 1,407 kb/d. World YoY September output increased by 3,931 kb/d.
Non-OPEC Production Charts
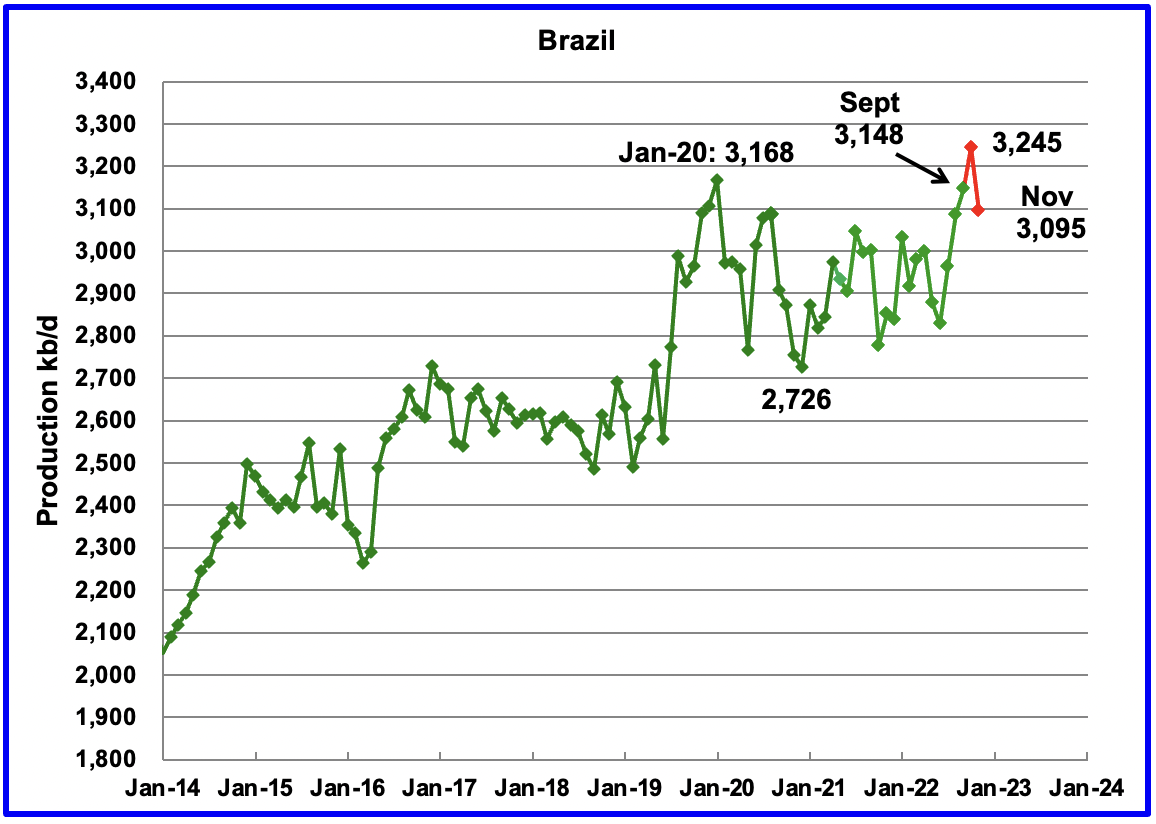
The EIA reported Brazil’s September production increased by 61 kb/d to 3,148 kb/d.
Brazil’s National Petroleum Association (BNPA) reported that October’s output increased by 97 kb/d while November dropped 150 kb/d to 3,095 kb/d. October’s production was a new record high for Brazil which was not sustained in November.
According to OPEC: Equinor’s (EQNR) Peregrino Phase 2 (Platform C) started production in October and is set to continue to ramp up volumes in 4Q22 and into 2023. Growth in 2022 is being driven by the continued ramp up of the Sepia field and the start-up of Mero 1 in the pre-salt Santos basin, as well as Peregrino (Phases 1 and 2) in the Campos basin.
Also, “Brazil’s 2023 liquids supply, including biofuels, is forecast to increase by 0.2 mb/d y-o-y to average 3.9 mb/d, broadly unchanged from the previous forecast. Crude oil output is set to increase through production ramp ups in the Mero (Libra NW), Buzios (Franco), Tupi (Lula), Peregrino, Sepia, Marlim and Itapu (Florim) fields. However, offshore maintenance is expected to cause interruptions in major fields. It should also be noted that Petrobras announced the platform ship Anita Garibaldi is bound for Brazil after it left its shipyard in China on October 6. The new FPSO system will be installed in the Marlim and Voador fields in the Campos basin, with production expected to begin in 3Q23.”
Much of Brazil’s production growth will be from the sub-salt frontier, where highly productive reservoirs containing light and low sulphur oil have been explored.”
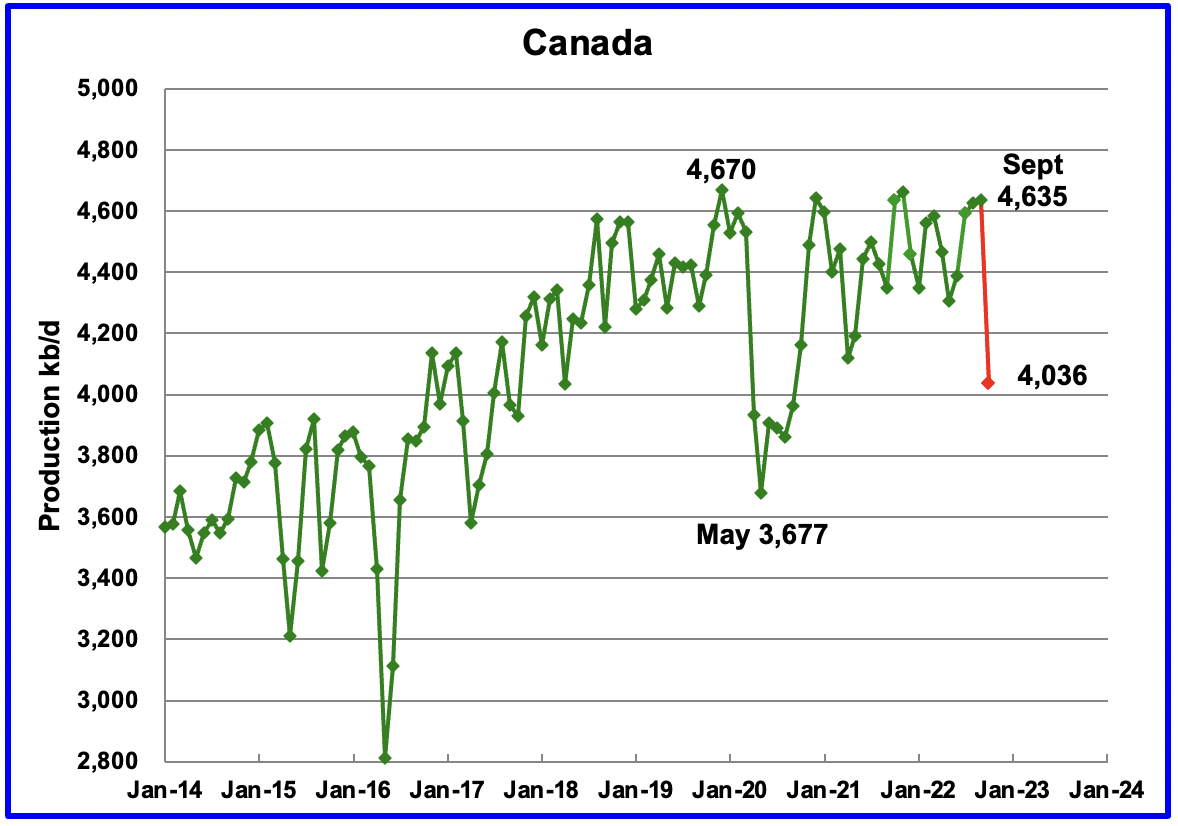
According to the EIA, Canada’s September output increased by 8 kb/d to 4,635 kb/d.
The Canada Energy Regulator reported September output of 4,942 kb/d, 307 kb/d higher than the EIA due to a difference in the definition of condensate. Preliminary estimates indicate that Canadian production could drop by 600 kb/d in October to 4,036 kb/d after accounting for the typical 300 kb/d higher production reporting by the CER. Light oil production was down by 200 kb/d and heavy was down by 400 kb/d.
Rail shipments to the US in September dropped by 28 kb/d to 127 kb/d and rebounded to 156 kb/d in October.
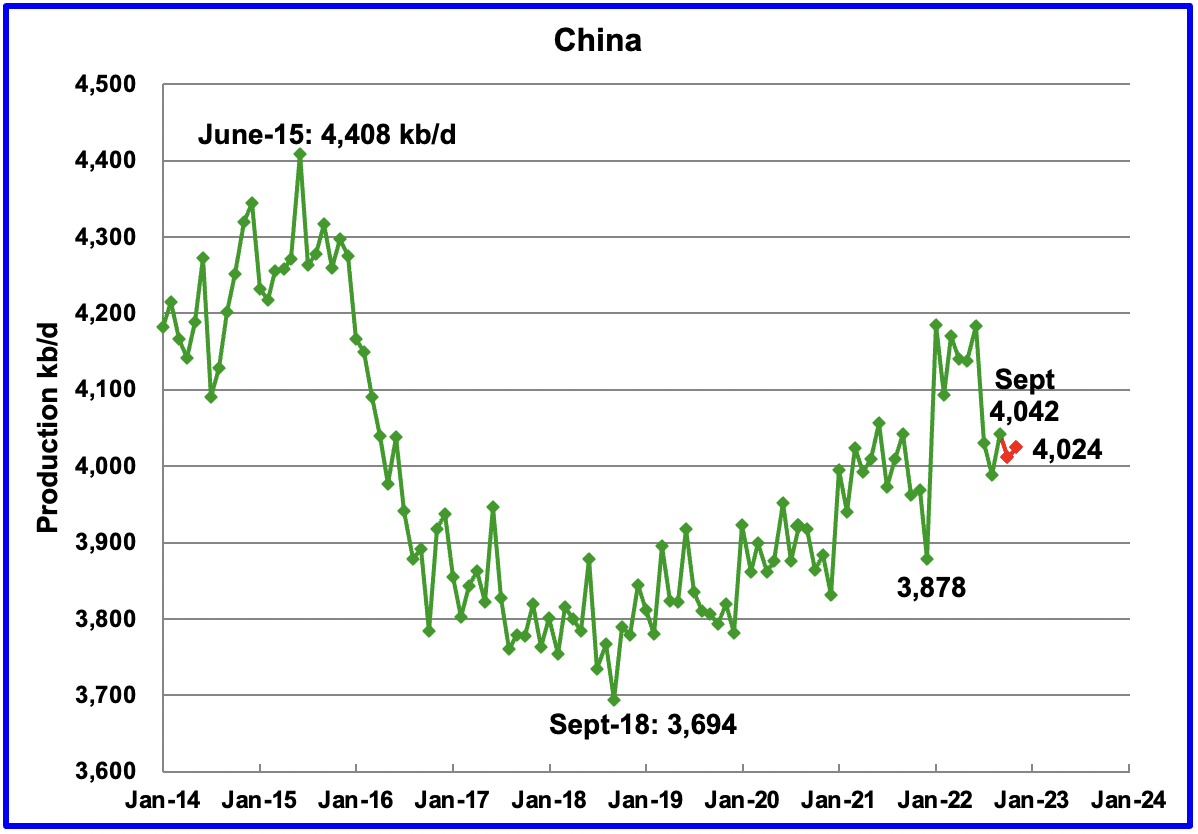
The EIA reported China’s output increased by 53 kb/d to 4,042 kb/d in September.
The September EIA production report is the second time there has been a disagreement between the official Chinese report and the EIA regarding China’s oil production. Up to July 2022, the EIA report and the China report were spot on. The National Bureau of Statistics of China published the following statement for September production, “In September, it produced 16.81 million tons of crude oil.”
Using 7.3 barrels per ton, the September output of 16.81 million tons converts to 4,090 kb/d. The EIA report is 48 kb/d lower than China’s report, approximately a 1% reduction. Note that the above China statement refers to crude production. The EIA may now be removing some liquids from the China Bureau “crude” production number. We will continue to track this sudden change between the EIA and the China Bureau of Statistics.
The official China bureau reported that China’s output decreased to 4,011 kb/ in October and increased to 4024 kb/d in November. A small correction/reduction was made to oil production reported in October and November, reflecting the EIA’s lower production reporting.
China may be close to its current maximum production level of approximately 4,000 kb/d to 4,200 kb/d. To offset declines, the national oil company is investing in conventional wells, deep water wells and is also drilling for shale oil.
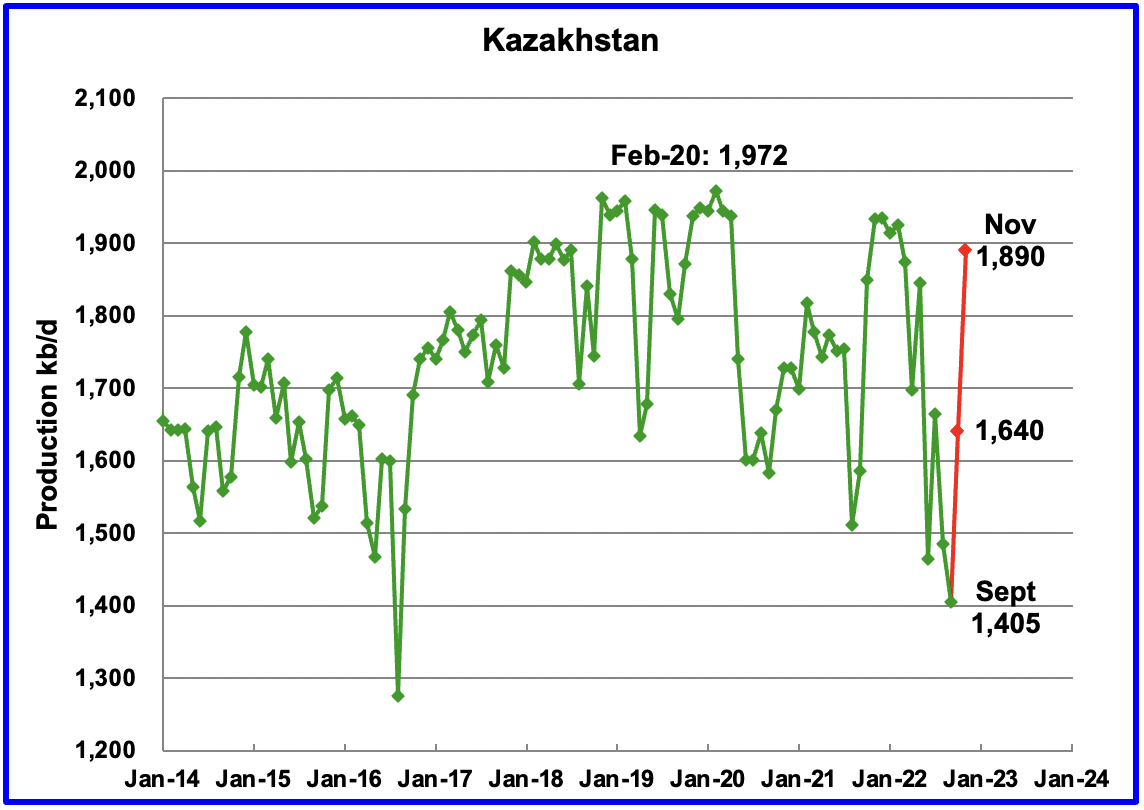
Kazakhstan’s output decreased by 80 kb/d in September to 1,405 kb/d.
According to OPEC, “The fall in output was due to a sharp decline in production in the giant Kashagan oil field after a gas leak early in August, as well as planned output curbs in the Tengiz field due to regular maintenance.”
According to this source, “production at Kashagan, one of the world’s largest oil fields, sharply declined on Aug. 3 due to a gas release. Kashagan had planned to boost output to 500,000 bpd after upgrades.”
Production is expected to recover in October according to this source. Production was restored in late October after the gas leak was repaired and reached 1,890 kb/d in early November, an increase of 405 kb/d over August.
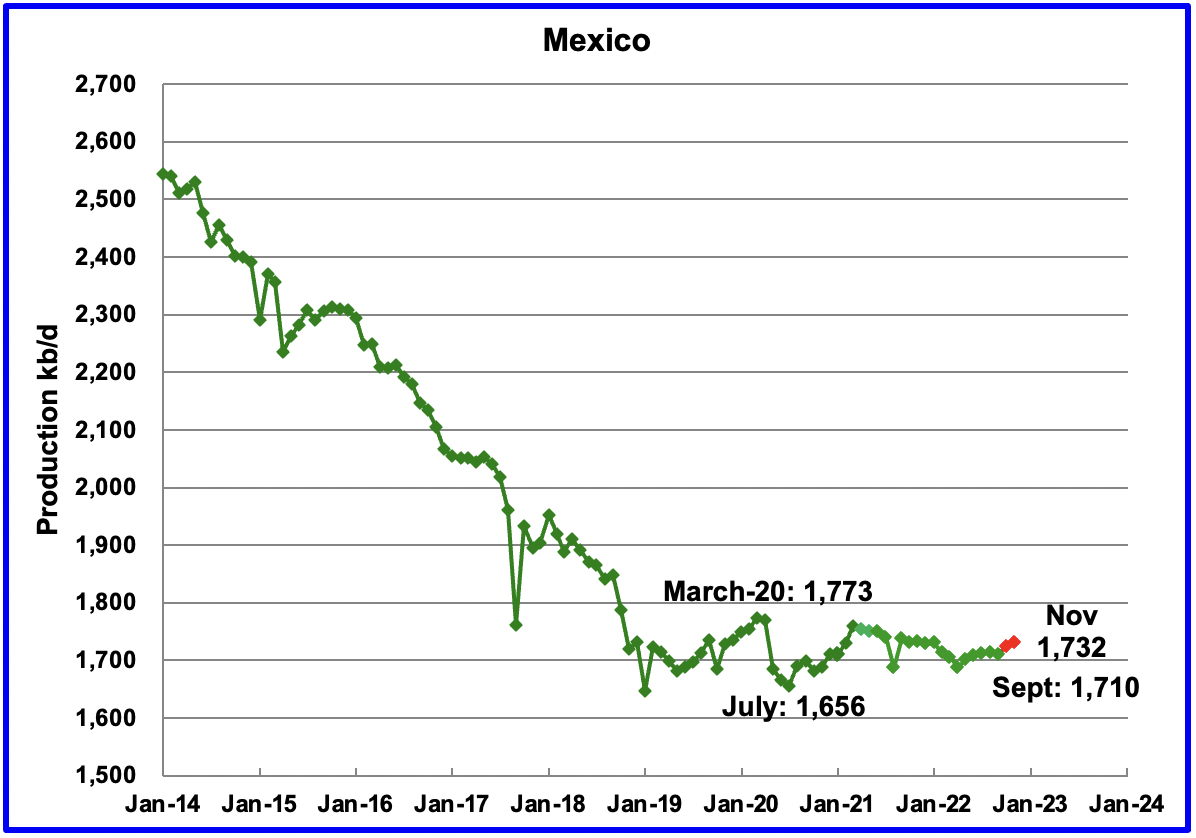
Mexico’s production as reported by the EIA for September was 1,710 kb/d.
The October and November estimates, red markers, were obtained by using the Pemex increments over September production and adding those to the EIA’s September output because Pemex reports higher production than the EIA.
OPEC continues to forecast flat production for Mexico in 2023 due to decline rates in mature fields.
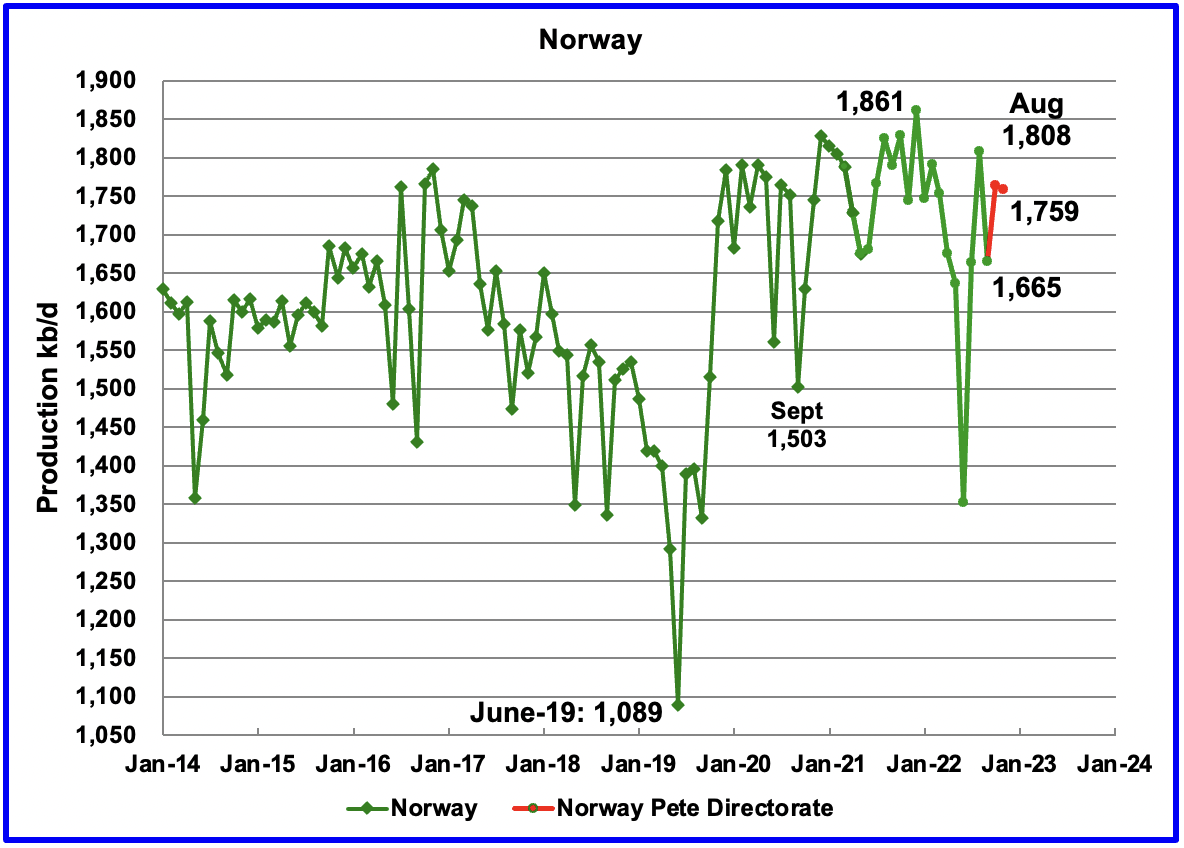
The EIA reported that Norway’s September production decreased by 144 kb/d to 1,665 kb/d. OPEC reported the drop was due to maintenance in the Oseberg and Troll fields. October’s production increased to 1,764 kb/d.
The Norway Petroleum Directorate (NPD) reported that production decreased by 5 kb/d from October to November to 1,759 kb/d (Red markers). According to the NPD: “Oil production in November was 8.7 percent lower than the NPD’s forecast and 5.7 percent lower than the forecast so far this year.”
Growth is expected in late 2022 and into 2023 when the second phase of the Johan Sverdrup field development starts production and other small fields come on line. According to OPEC “The Johan Sverdrup Phase 2 is projected to be the main source of increased output for later this year and next year. Equinor has confirmed that Johan Sverdrup field startup occurred on Dec 15, 2022.
“At plateau, the Johan Sverdrup field will produce 720,000 barrels of oil daily, aiming to rise to 755,000 barrels per day. Johan Sverdrup alone can thus meet 6-7 percent of the daily oil demand in Europe. Recoverable volumes in the Johan Sverdrup field total 2.7 billion barrels of oil equivalent.”
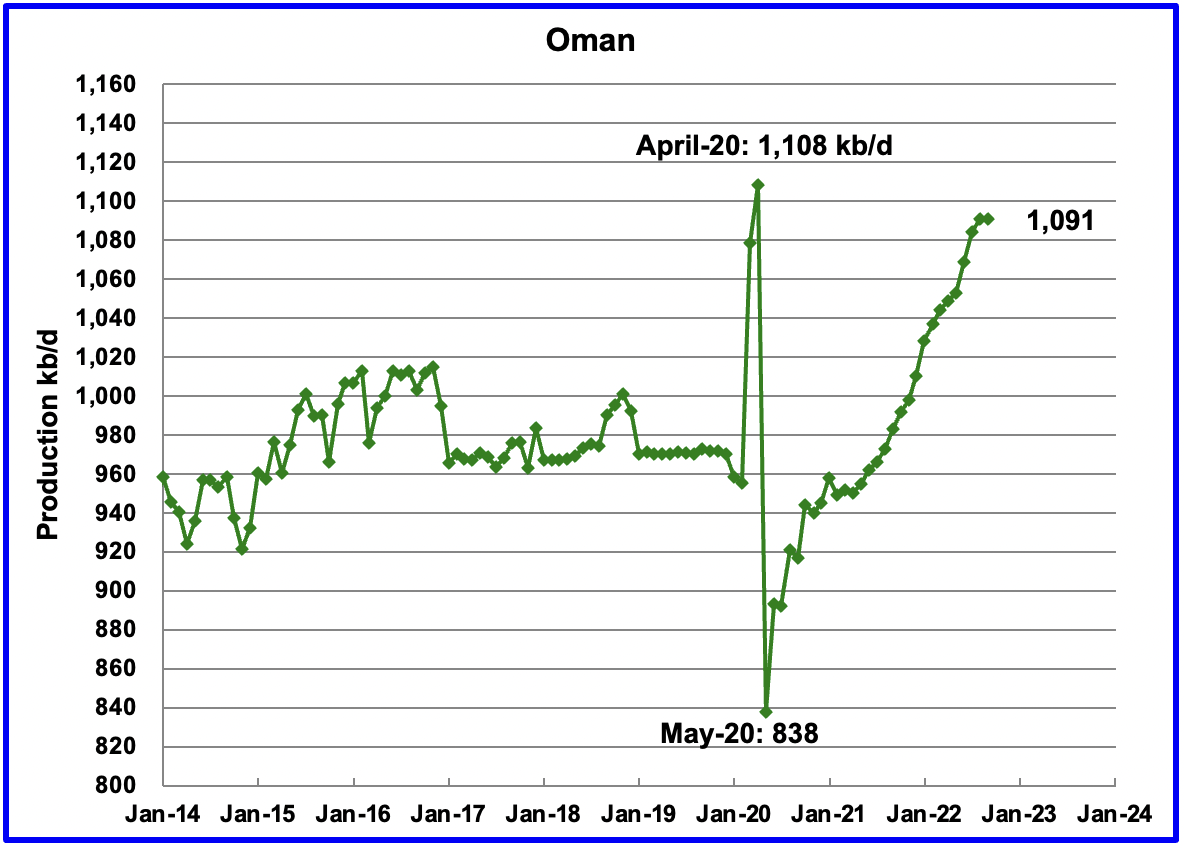
Oman’s production has risen very consistently since the low of May 2020. Oman’s September production was unchanged at 1,091 kb/d. It is 17 kb/d short of its pre-pandemic high.
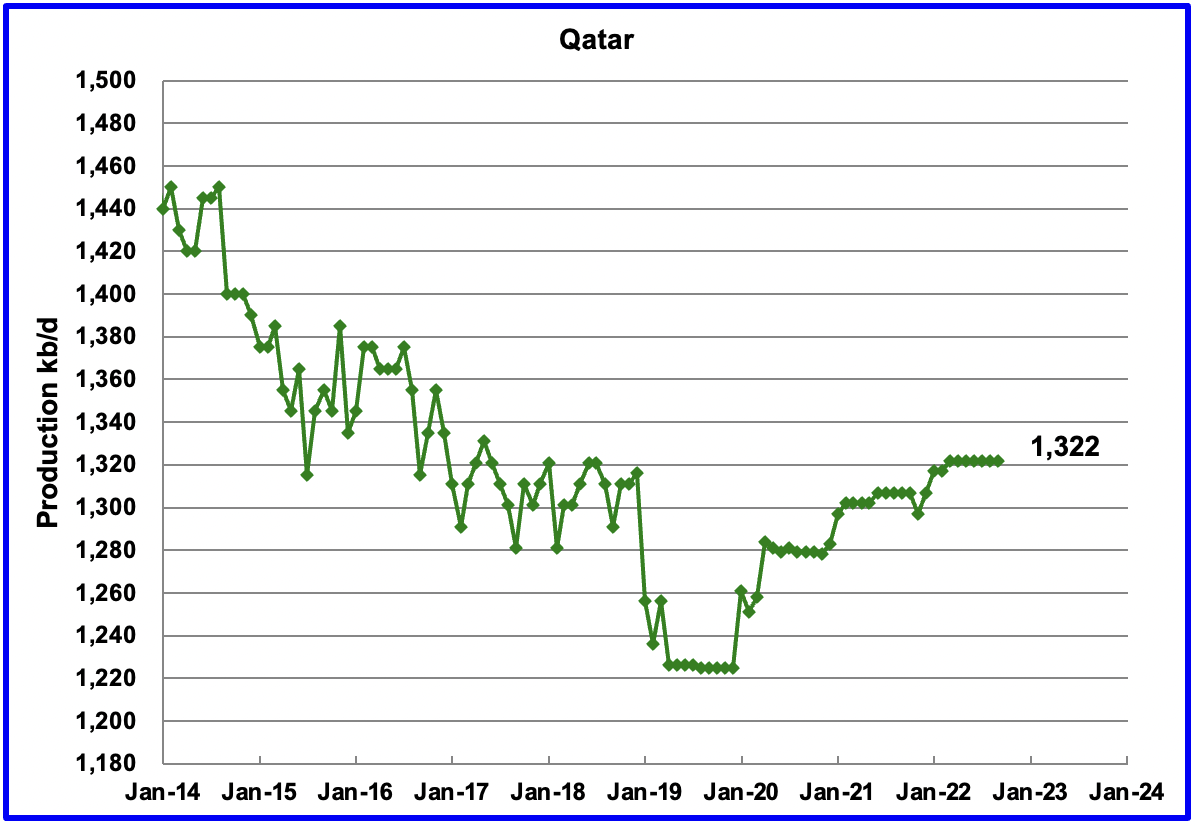
September’s output was unchanged at 1,322 kb/d.
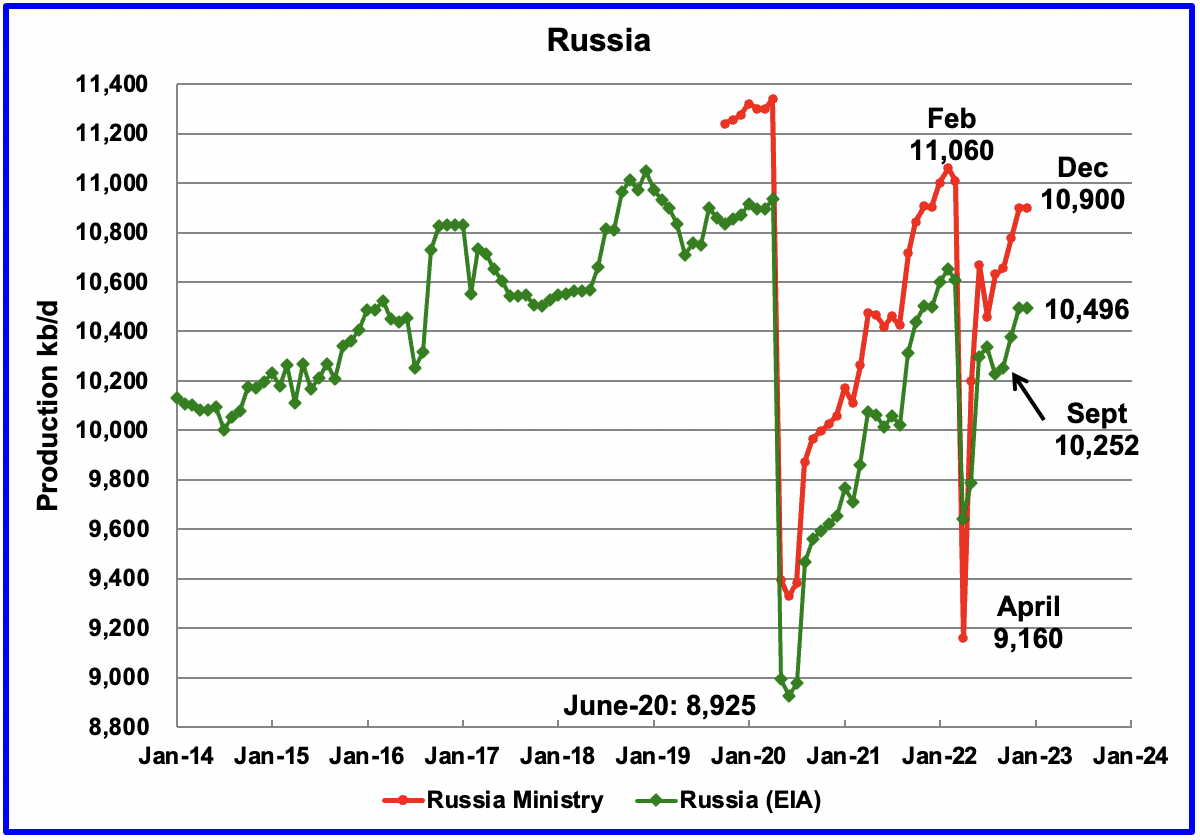
The EIA reported that Russian output increased by 25 kb/d in September to 10,252 kb/d.
Russia’s Ministry data for October production of 10,780 kb/d was taken from this source and November’s 10,900 kb/d was taken from this source. In light of all of the sanctions, it is surprising to see such robust production.
December production is shown unchanged based on this statement: Russia will keep oil production in December at the November level amid the EU’s embargo and the price cap, Deputy Prime Minister Alexander Novak told reporters.
The EIA production numbers for October to December are derived from the Russia Ministry data by subtracting 404 kb/d. In the past, when production data was obtained directly from the Russian Energy Ministry, it was found that the EIA arbitrarily subtracted 404 kb/d from the Ministry data.
Production at Russia’s Sakhalin-1 near full oil output after Exxon (XOM) exit. According to this source: Oil output from Russia’s Sakhalin-1 project has recovered to 140,000-150,000 barrels per day (bpd), about 65% of the capacity and will soon hit full level of about 220,000 bpd.
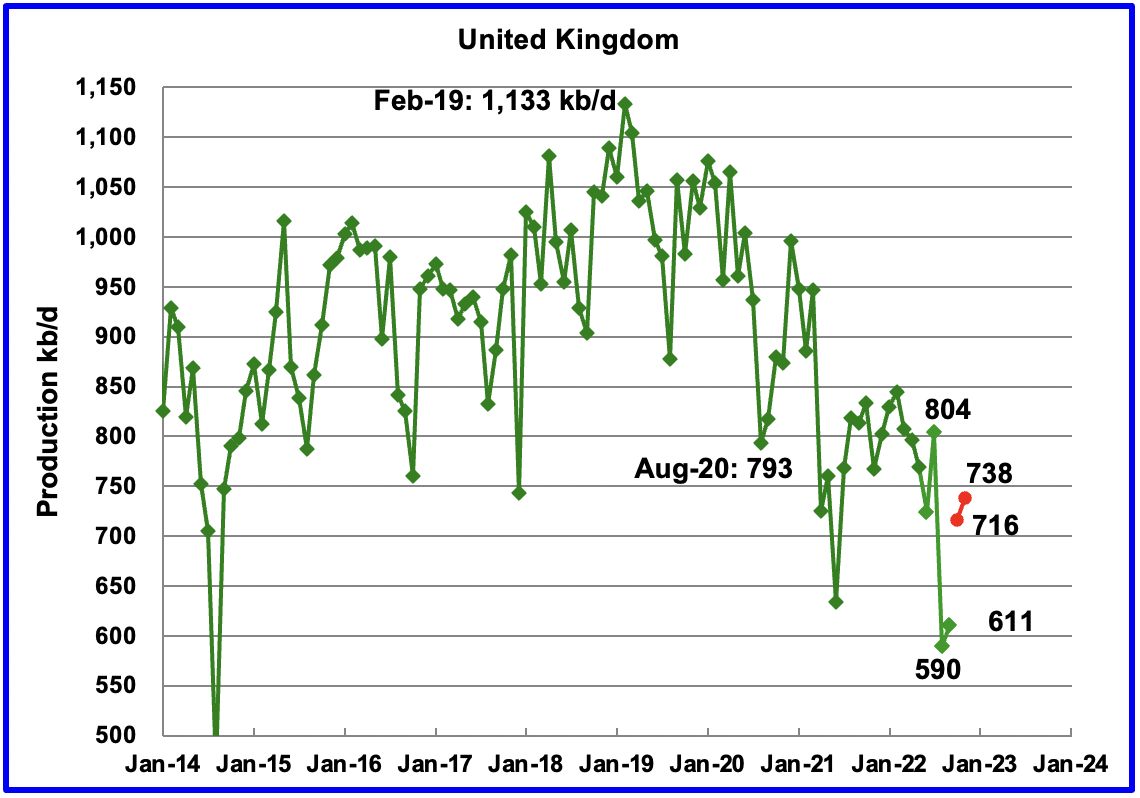
The EIA reported UK’s production increased by 21 kb/d in September to 611 kb/d.
According to this source, North Sea Transition Authority (NSTA), October’s production increased by 115 kb/d to 716 kb/d (Red Markers) and an additional 22 kb/d in November to 738 kb/d.
The UK petroleum regulator said that three key elements could help boost production in North Sea.
According to this report, “More recent signs suggest that drilling will pick up in the medium term. Commodity prices have stayed consistently high this year, accelerating development plans of 30 projects which target 1.5 billion barrels and are currently progressing towards consent decisions.”
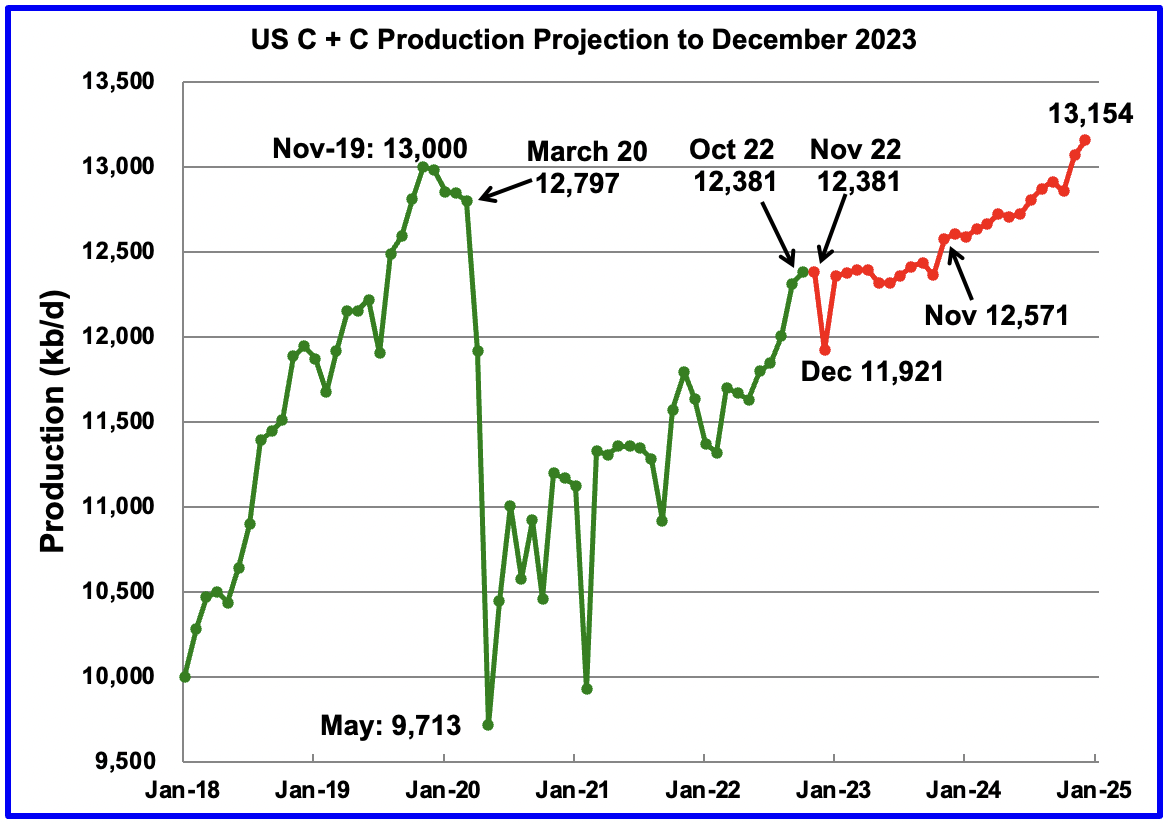
U.S. October production increased by 69 kb/d to 12,381 kb/d to a New post pandemic high. For October, the state with the largest increase was New Mexico, 41 kb/d, along with a number of smaller increases from the other producing states.
The red graph is the EIA’s forecast for US oil production out to December 2024. Output reaches 13,154 kb/d and exceeds the pre-pandemic high of 13,000 kb/d. Note that there is essentially no production increase in the US from October 2022 to October 2023. Production begins to rise again in November 2023. The December drop is associated with extreme weather in North Dakota and possibly Texas and New Mexico.
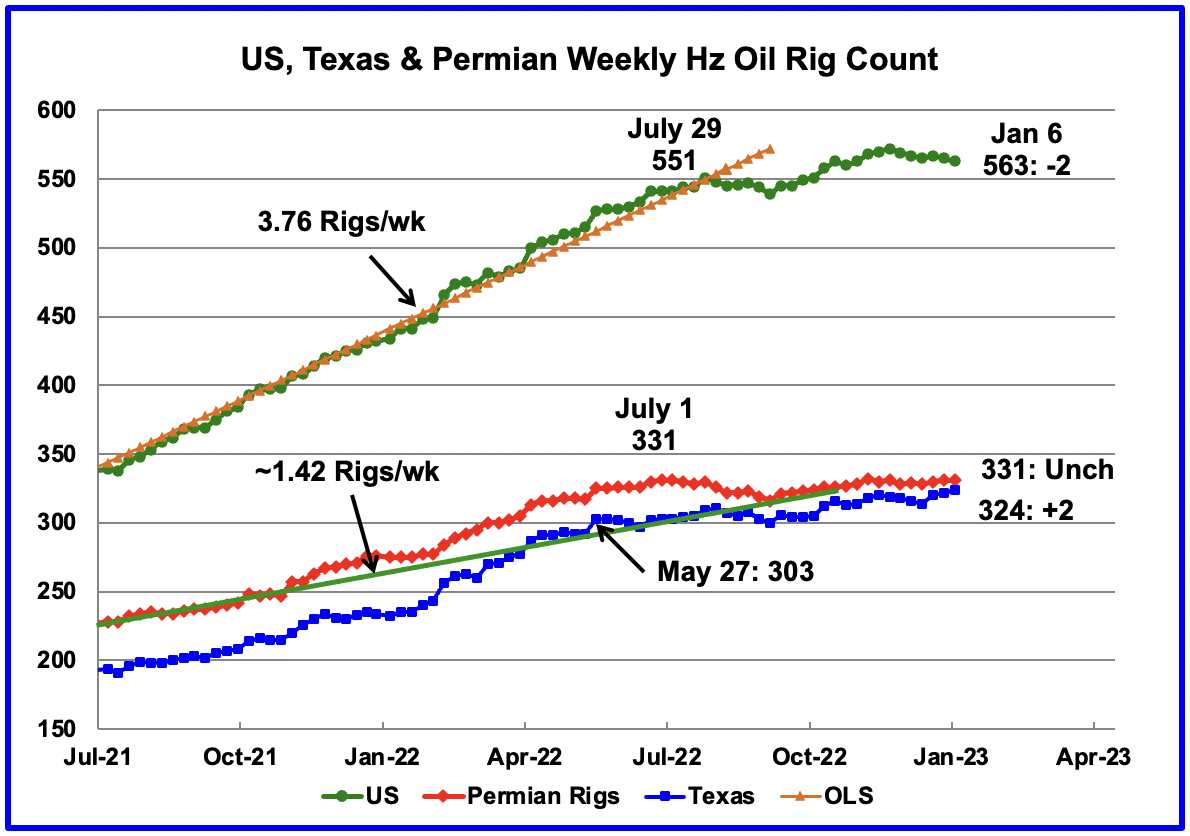
After the week ending July 29, the rate of Hz rig additions slowed. However since the low of 539 in the week ending September 9, Hz rig growth returned until the Thanksgiving/Xmas break period. From a high of 572 rigs in the week ending November 25, the rig count has dropped to 563 in the week ending January 6.
Permian rigs were unchanged at 331 in the week ending January 6 and are still at the same level as the week ending July 1, 331. With Permian rigs essentially flat since July 1, this implies that rig activity has increased in the other basins. Texas rigs increased by 2 to 324, in the week ending January 6.
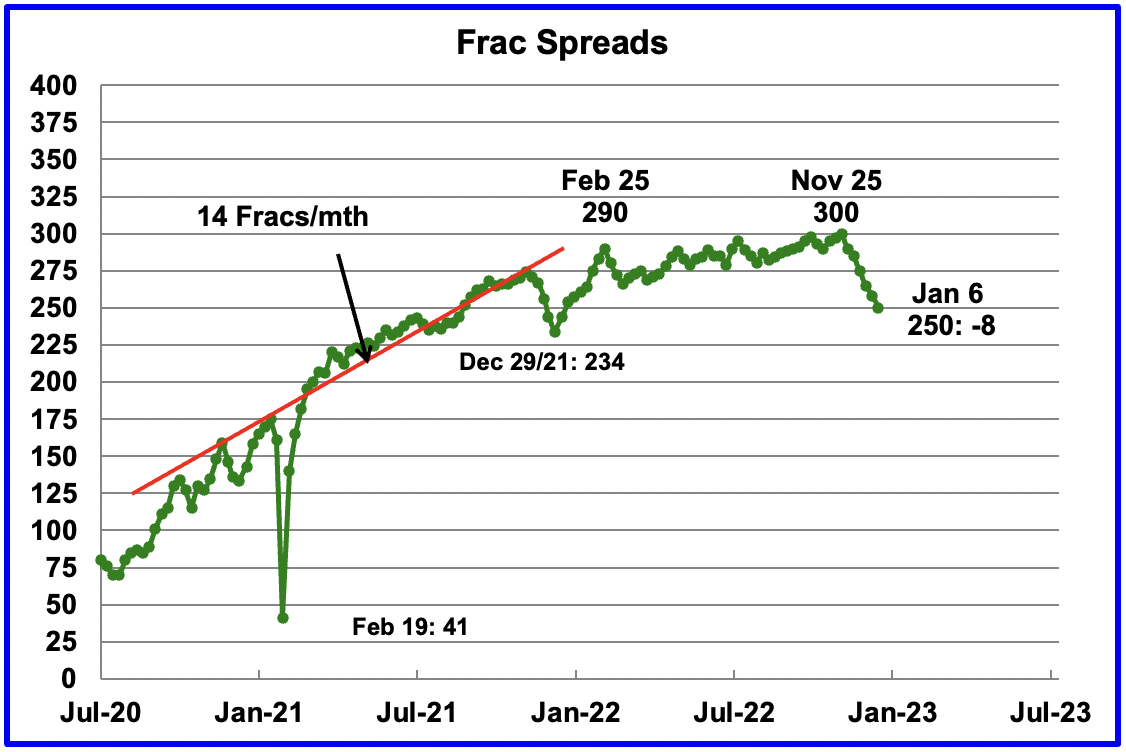
For frac spreads, the general trend since late February 2022, when the count was 290, can best be described as essentially flat at around the 290 level up to the end of November. For the week ending January 6, the frac spread count decreased by 8 to 250 and is down 50 spreads from the high of 300 on November 25. The count should return close to 300 by late February 2023.
Last year the frac count peaked in mid November and then headed into the Thanksgiving and Christmas break low of 234 in December 2021, down 40 from the November high.
Note in the US production chart above, output fell in December 2021 and January 2022. Will the same trend be repeated this year as the spread count drops? See next chart.
Note that these 250 frac spreads include both gas and oil spreads.
Note that most of the weekly production numbers since October 28 to the last week in December have been close to 12,100 kb/d, 280 kb/d lower than October’s output of 12,381 kb/d.
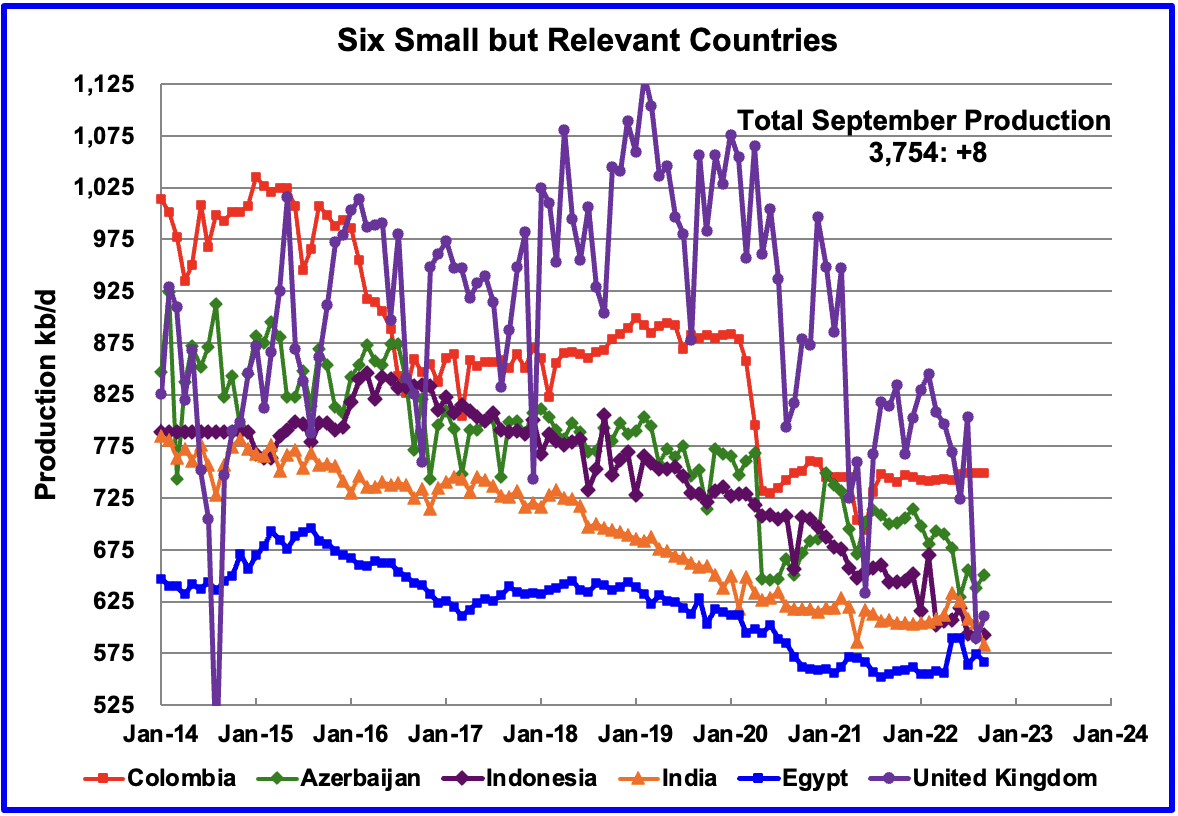
These six countries complete the list of Non-OPEC countries with annual production between 500 kb/d and 1,000 kb/d. Note that the UK has been added to this list since its production has been below 1,000 kb/d since 2020.
Their combined September production was 3,754 kb/d, up 8 kb/d from August’s 3,746 kb/d.
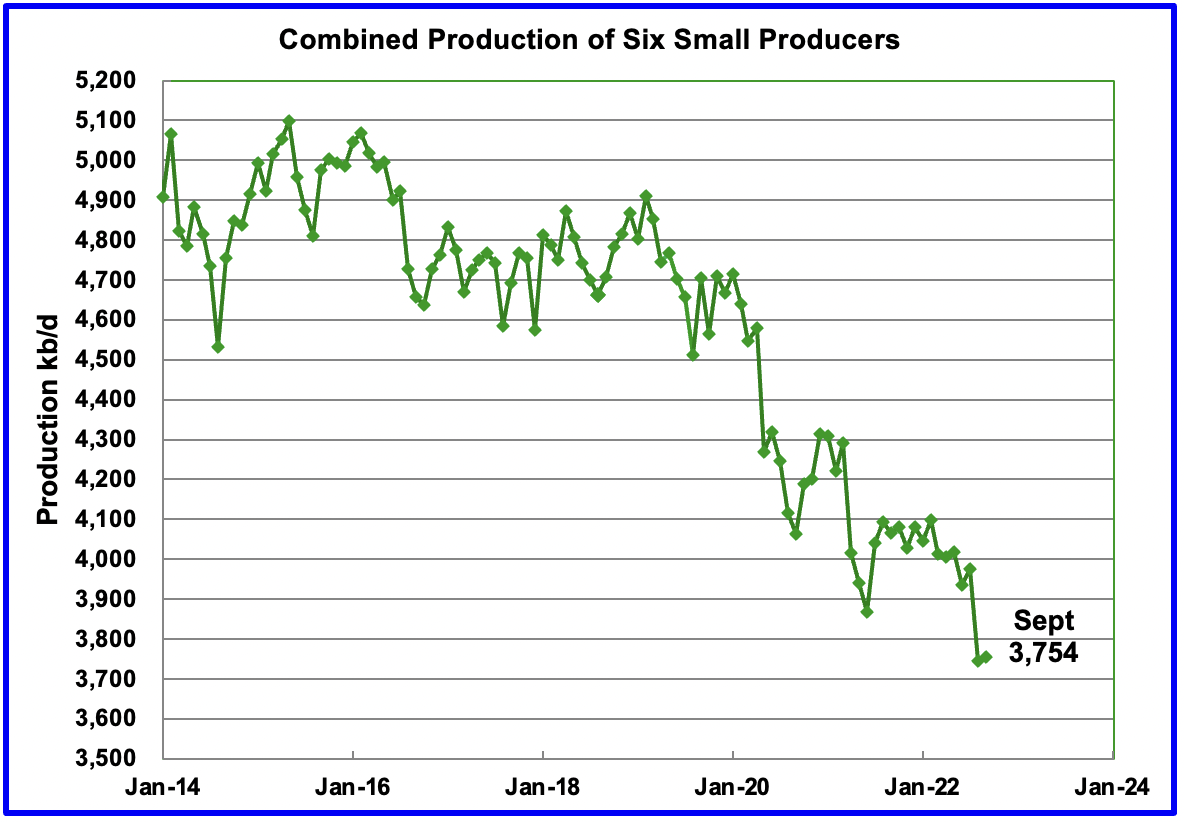
The overall output from the above six countries has been in a slow steady decline since 2014 and the decline continues.
World Oil Production Ranked by Country
Above are listed the World’s 11th largest oil producers.
In September 2022, these 11 countries produced 75.4% of the world’s oil. On a YoY basis, production from these 11 countries increased by 3,931 kb/d. Note that every country except Iran and Norway increased production in September.
The largest increase came from the US, 289 kb/d. Norway had the largest production drop, 144 kb/d.
World Oil Production Projection
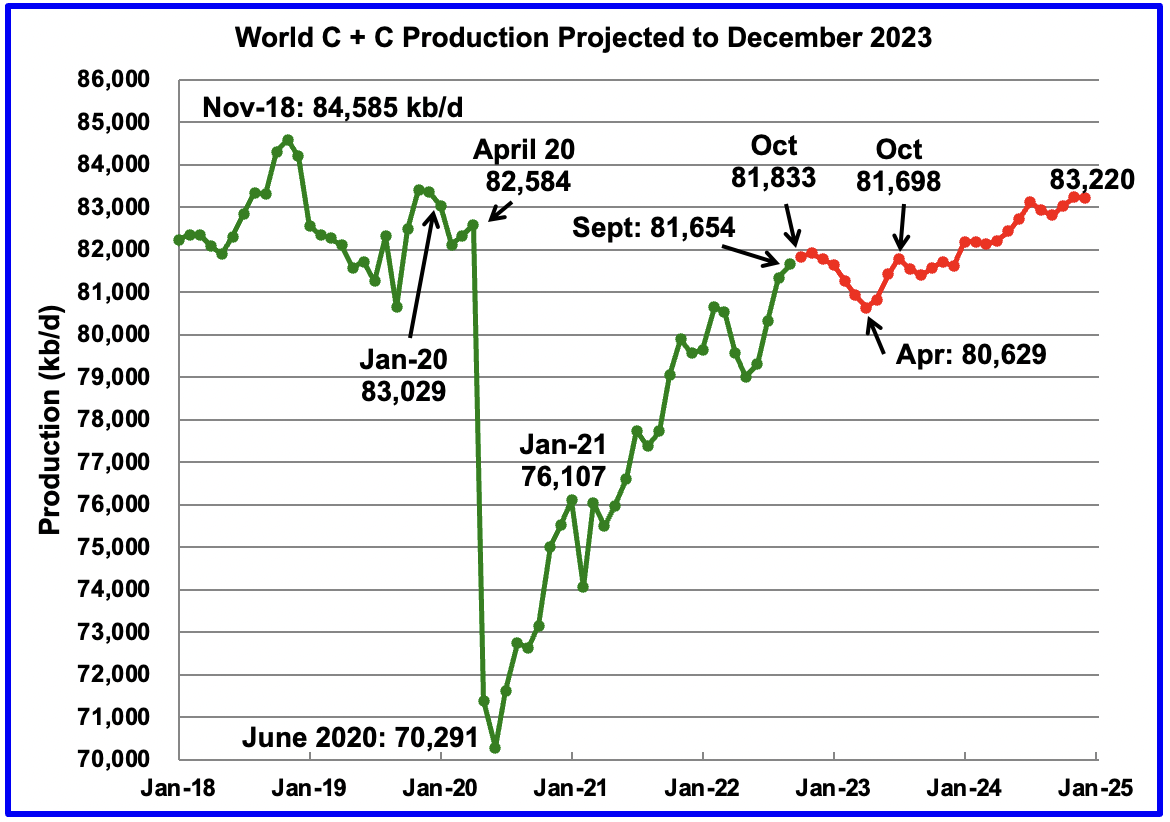
World oil production in September increased by 314 kb/d to 81,654 kb/d according to the EIA (Green graph). Note that August production was revised down from 81,446 kb/d to 81,340 kb/d. This means that the September increase from the original August estimate was 208 kb/d. October is expected to add 179 kb/d to 81,833 kb/d.
This chart also projects World C + C production out to December 2024. It uses the January 2023 STEO report along with the International Energy Statistics to make the projection. (Red markers).
It projects that World crude production in December 2024 will be 83,220 kb/d. Note that this post pandemic high of 83,220 kb/d is 1,365 kb/d lower than November 2018 peak.
The drop from November 2022 to April 2023 is primarily due to a projected drop in Russian oil output.
Editor’s Note: The summary bullets for this article were chosen by Seeking Alpha editors.
Be the first to comment