

Lemon_tm/iStock via Getty Images
This article was originally published on June 3, 2022.
Economic earnings increased year-over-year (YoY) for all but two sectors through the trailing-twelve-months ended Q1’22 for the NC 2000[1], [2], our All Cap Index.
This report is an abridged version of All Cap Index & Sectors: Q1’22’s Soaring Economic Earnings Aren’t Sustainable, one of our quarterly reports on fundamental market and sector trends.
Economic earnings provide a more accurate picture of the true underlying cash flows of a business than GAAP earnings.
Economic Earnings Nearly Doubled in Q1’22
Economic earnings for the NC 2000 rose from $563.4 billion in 1Q21 to $1.0 trillion in Q1’22, while GAAP Earnings rose from $1.3 trillion to $2.1 trillion over the same time. Economic and GAAP earnings are only slightly below calendar 2021 levels – the highest since 1998, which is the earliest our analysis is available.
However, the NC 2000’s soaring economic earnings are likely to reverse trend soon.
Indeed, a major headwind facing economic earnings is a rising WACC, which in the TTM ended Q1’22 added $104.1 billion to the cost of capital. The start of rapid inflation artificially boosts GAAP earnings as profits on current sales are calculated using historic inventory costs. Once inflation cools, the process is reversed, and GAAP earnings become artificially depressed. However, investors can protect themselves from such false signals by utilizing economic earnings, which account for expected inflation as reflected in the firm’s WACC.
Key Details on Select NC 2000 Sectors
While all sectors saw a YoY rise in GAAP earnings, economic earnings for the Real Estate and Basic Materials sectors fell in Q1’22.
The Energy sector saw the largest YoY improvement, $158.0 billion, in economic earnings, which rose from -$112.1 billion in 1Q21 to $45.8 billion in Q1’22.
The Technology sector generates the most economic earnings of any sector and grew economic earnings by 30% YoY in Q1’22. On the flip side, the Real Estate sector has the lowest economic earnings and saw a $1.3 billion YoY decline in economic earnings in Q1’22.
Below, we highlight the Industrials sector which saw economic earnings improve by $54.9 billion YoY in Q1’22.
The full version provides the same details for every sector as this report does for the Industrials Sector.
Sample Sector Analysis: Industrials
Figure 1 shows economic earnings for the Industrials sector rose from -$5.5 billion in 1Q21 to $49.4 billion in Q1’22, while GAAP earnings rose from $67.7 billion to $162.8 billion over the same time.
Figure 1: Industrials Economic Earnings Vs. GAAP: 1998 – Q1’22
NC 2000 Industrials Sector Economic Earnings Since 1998 (New Constructs, LLC)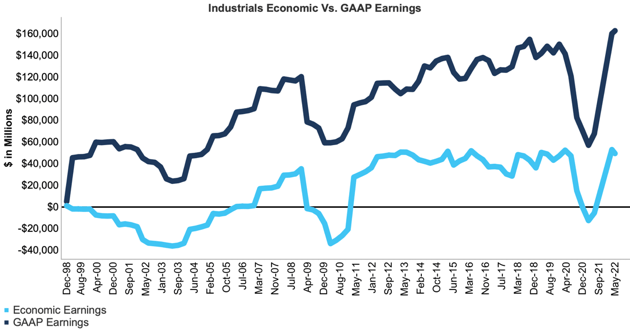
Sources: New Constructs, LLC and company filings. Our economic earnings analysis is based on aggregated TTM data for the sector constituents in each measurement period. The May 16, 2022 period incorporates the financial data from calendar Q1’22 10-Q, as this is the earliest date for which all the calendar Q1’22 10-Qs for the NC 2000 constituents were available.
Disclosure: David Trainer, Kyle Guske II, and Matt Shuler receive no compensation to write about any specific stock, style, or theme.
Appendix: Calculation Methodology
We derive the economic earnings and GAAP earnings metrics above by summing the Trailing Twelve-Month individual NC 2000 constituent values for economic earnings and GAAP earnings in each sector for each measurement period. We call this approach the “Aggregate” methodology.
The Aggregate methodology provides a straightforward look at the entire sector, regardless of market cap or index weighting and matches how S&P Global (SPGI) calculates metrics for the S&P 500.
[1] The NC 2000 consists of the largest 2000 U.S. companies by market cap in our coverage. Constituents are updated on a quarterly basis (March 31, June 30, September 30, and December 31). We exclude companies that report under IFRS and non-U.S. ADR companies.
[2] This report is based on the latest audited financial data available, which is the Q1’22 10-Q in most cases. Price data as of 5/16/22.
Be the first to comment