

Iryna Drozd/iStock via Getty Images
Thesis
The stock market habitually ignores fundamentals completely when the mood is at either the greed or fear extreme. And Alibaba (NYSE:BABA) and Amazon (NASDAQ:AMZN) as simply the latest examples as you can see from the following chart. Not that long ago (around 2021), both stocks had been trading at immense valuation premiums. To wit, BABA demanded a P/S multiple of around 10x and AMZN around 5.0x. Then the bubbles burst quickly and now BABA is trading only at 1.73x P/S ratio and AMZN at 1.97x, both at only a fraction of the market average of 4.61x represented by the NASDAQ 100 index.
Source: Seeking Alpha data.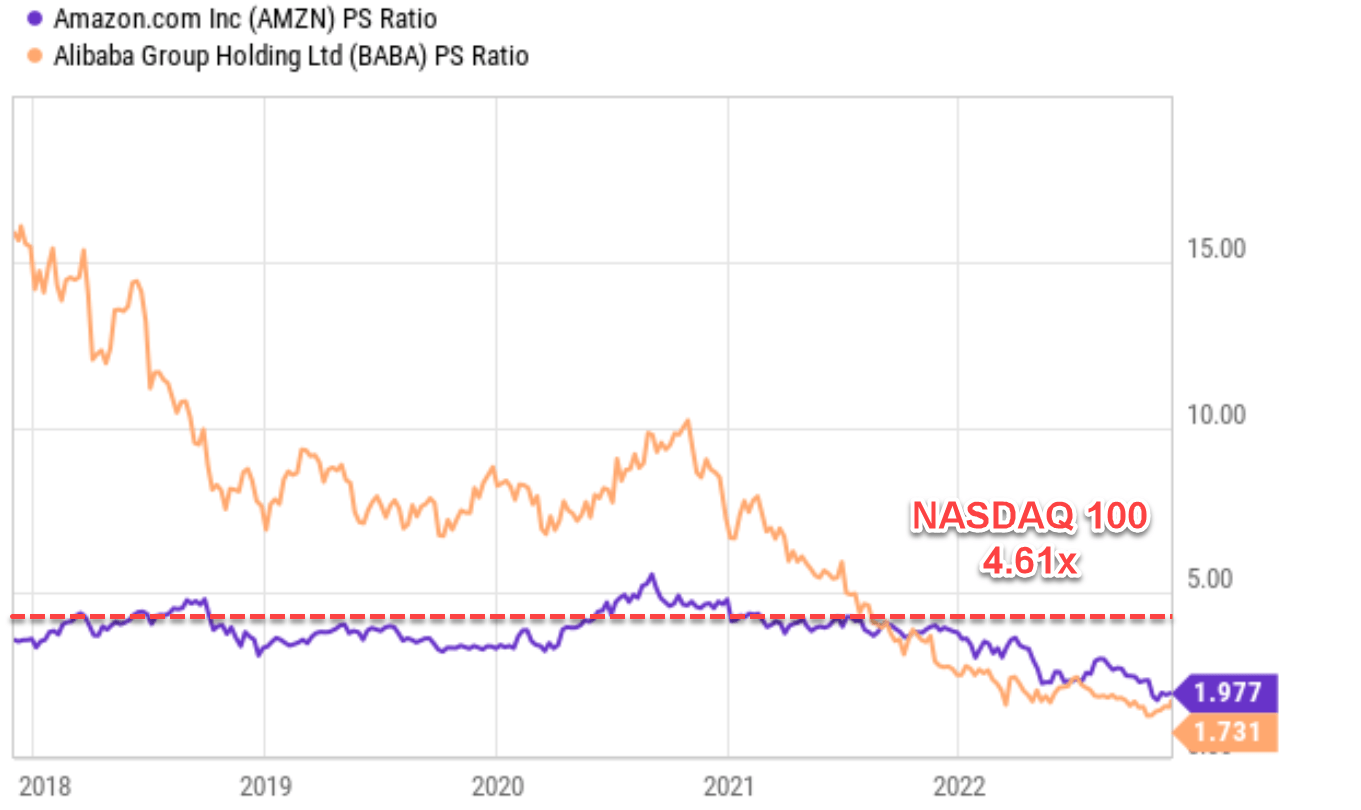
Thus, it is the thesis of this article to examine if the above valuation correction is overdone (an almost 6x P/S ratio contraction for BABA and almost 3x contraction for AMZN). And you will see that my conclusion is yes.
It is true that both businesses have faced strong headwinds (some common and some unique to each of them) as you can clearly see from the following chart. BABA suffered a large decline in EBIT profit margin since 2021 both due to the macroeconomic slowdown of China’s economy and also the tightened regulations. Its EBIT margin dropped from an average of 24% to a bottom of around 0% in the first half of 2022. Its margin has recovered to a healthy 13.5% in the most recent quarter, but still a far cry from its long-term average (only about ½ of its long-term average). The picture of AMZN is quite similar, although less dramatic. Its EBIT margin has been in a nosedive since ~2021 too. Its EBIT margin has been consistently above its average of 5.25% (except for two quarters) before 2021. However, it dropped to below 0% in the first of 2022. Its margin has recovered to a positive 2.8% in the most recent quarter, but still only ½ of its long-term average.
However, in the remainder of this article, I will argue that despite such profitability headwinds, the overvaluation correction is overblown. The current valuations in both stocks have ignored the growth curve from the secular e-commerce penetration and also their various high-growth initiatives. Their current profitability headwinds could persist but are ultimately temporary the way I see things. And furthermore, I see the price volatilities created thy such headwinds to be entry opportunities for long-term investors. To wit, for AMZN, near-term headwinds such as shipping congestion and inflation persisting could cause its prices to be stuck in a $90~$95 trading range, providing a reasonable entry point. For Alibaba, its current valuation is already very attractive, and China’s ongoing protest and Zero COVID policy could create an even better entry point for long-term holdings.
Source: Seeking Alpha data.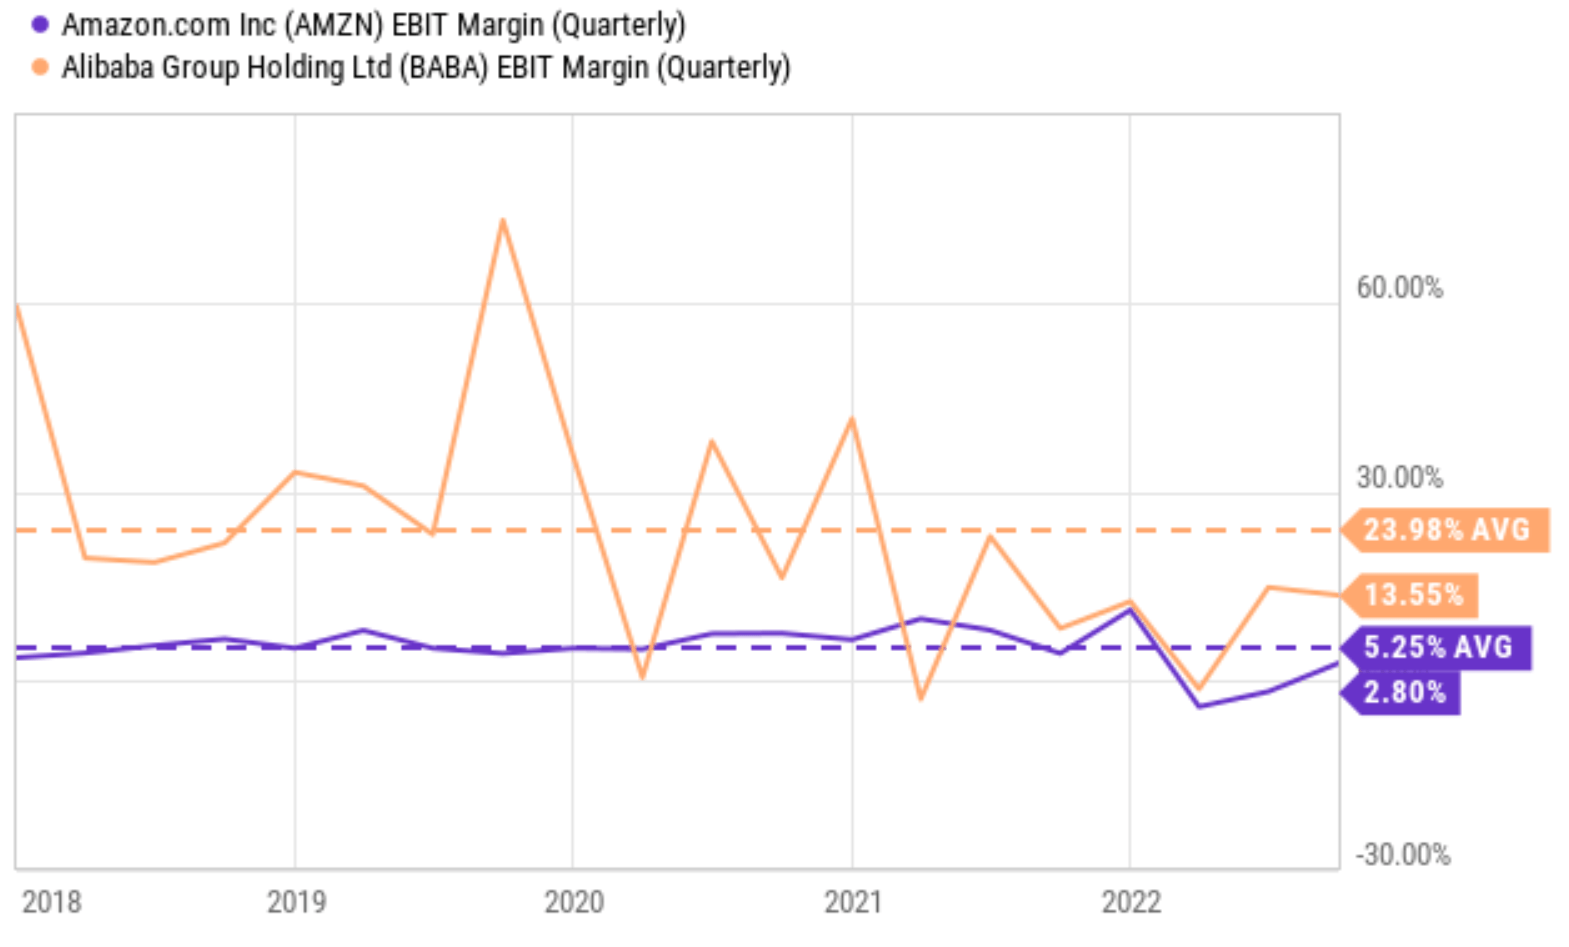
The “China Risk”
First, let me start with what’s comparable and what’s not between these two businesses. I view BABA and AMZN as the bellwether stocks in the e-commerce sector – that is why this article picked them to gain a more vantage view of the current status of the e-commerce sector. And both stocks are comparable, or even identical, in many of their operation details and initiatives (e.g., both are leaders in the cloud space).
However, the elephant in the room is that BABA faces a “China risk” that AMZN does not. I won’t dive too much into the “China risk”. It is a broad and vague concept. Different readers and authors seem to interpret it differently. As the title of this article suggests, I will focus more on business fundamentals rather than geopolitics.
For the “China risk”, I would refer readers to Ray Dalio and his writing. In particular, I highly recommend his book, The Changing World Order (a few quotes are provided below from this book). I read all of his books (not that many anyway) and follow his writings closely. And I view him as a leading expert on both China and the U.S., and especially their interplays.
- “I urge those of you who have not spent considerable time in China to look past the caricatured pictures that are often painted by biased parties and rid yourself of any stereotypes you might have that are based on what you thought you knew about the old “communist China” – because they are wrong.”
- “Triangulate whatever you are hearing or reading with people who have spent a lot of time in China working with Chinese people.”
- “As an aside, I think the widespread medium distortions and the blind and the near-violent loyalties that stand in the way of the thoughtful exploration of our different perspectives are a frightening sign of our times.”
BABA and AMZN’s R&D sustainability
As detailed in my earlier writings, for “new-economy” stocks like BABA and AMZN, a key business fundamental aspect I always check is their R&D: especially the sustainability and yield.
Therefore, let’s first see how sustainable BABA and AMZN have been funding their new R&D efforts. The chart below displays their R&D expenditures in the past 10 years as a fraction of their total sales. As you can see, both BABA and AMZN have been consistently and also aggressively investing in R&D. In AMZN’s case, it has been only spending a minimal amount on R&D before 2016 (less than 1% of its revenues). But after 2016, it cranked up its R&D substantially to a level of 12.0% of its total sales and has maintained it at this level since then. In BABA’s case, it has been spending on average 10.0% of total revenues on R&D efforts systematically.
Source: Author based on Seeking Alpha data.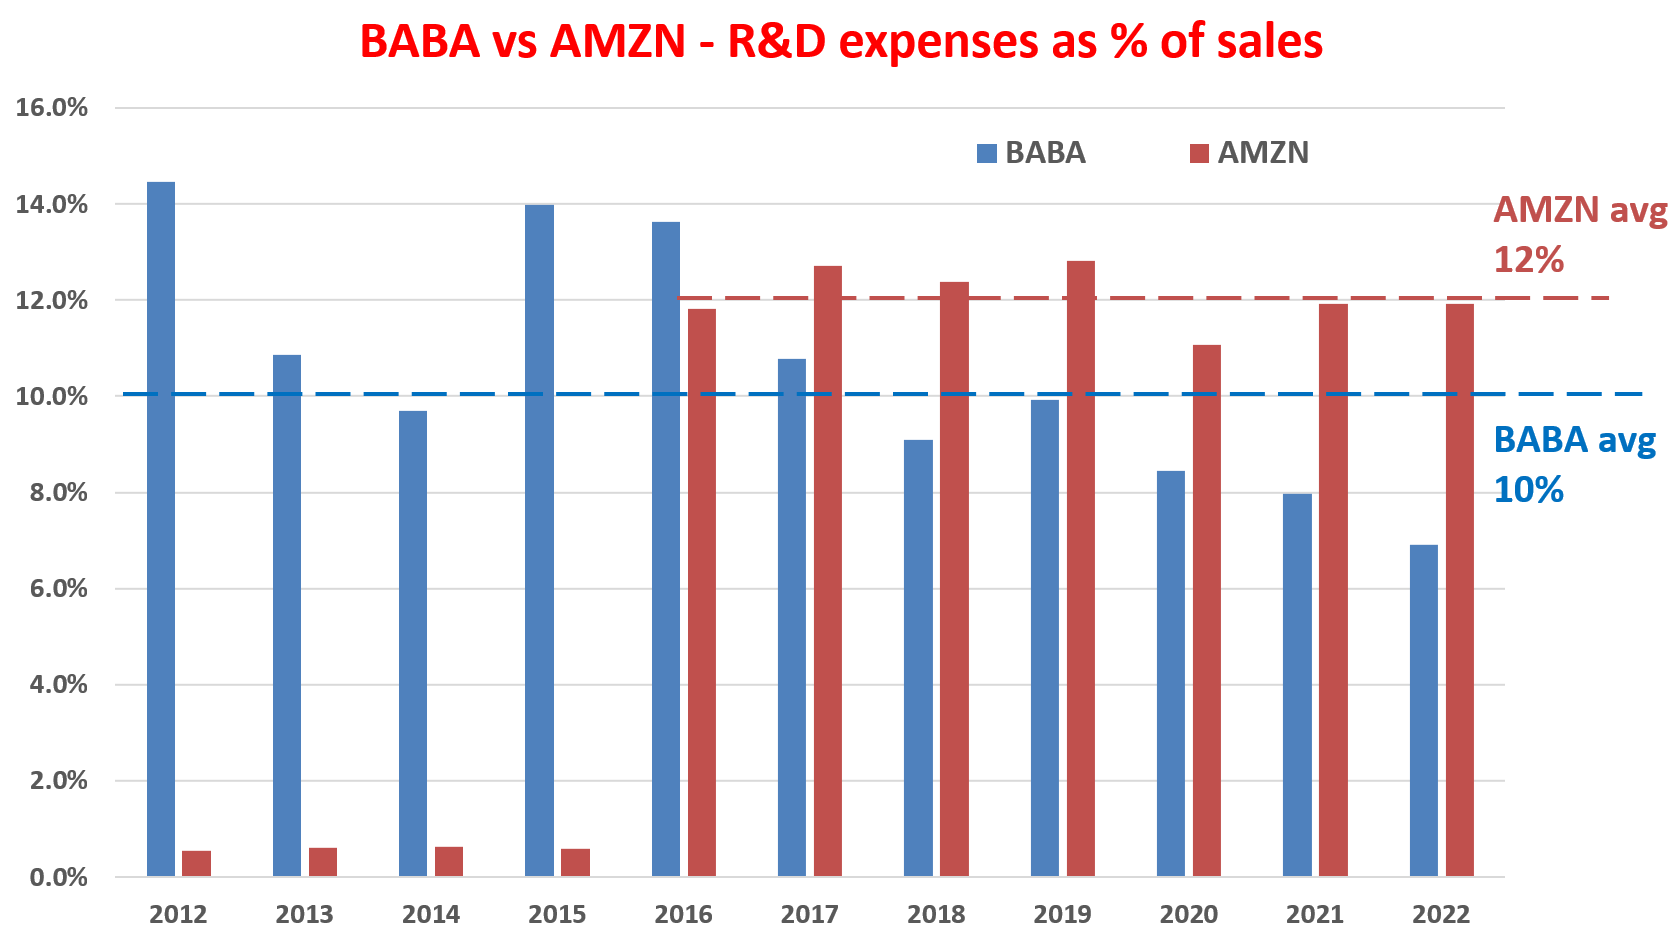
After establishing their R&D sustainability, let’s examine how effective their R&D processes have been. The examination in this article follows a method detailed in my earlier article. The essential idea is to apply Buffett’s $1 test on R&D expenditures. More specifically:
- The purpose of any corporate R&D is obviously to generate profit. Therefore, this analysis quantifies the yield by taking the ratio between profit and R&D expenditures. We used the operating cash flow as the measure of profit.
- Also, most R&D investments do not produce any results in the same year. They typically have a lifetime of a few years. Therefore, this analysis assumes a 3-year average investment cycle for both BABA and AMZN’s R&D expenses. As a result, we used the 3-year moving average of operating cash flow to represent this 3-year cycle.
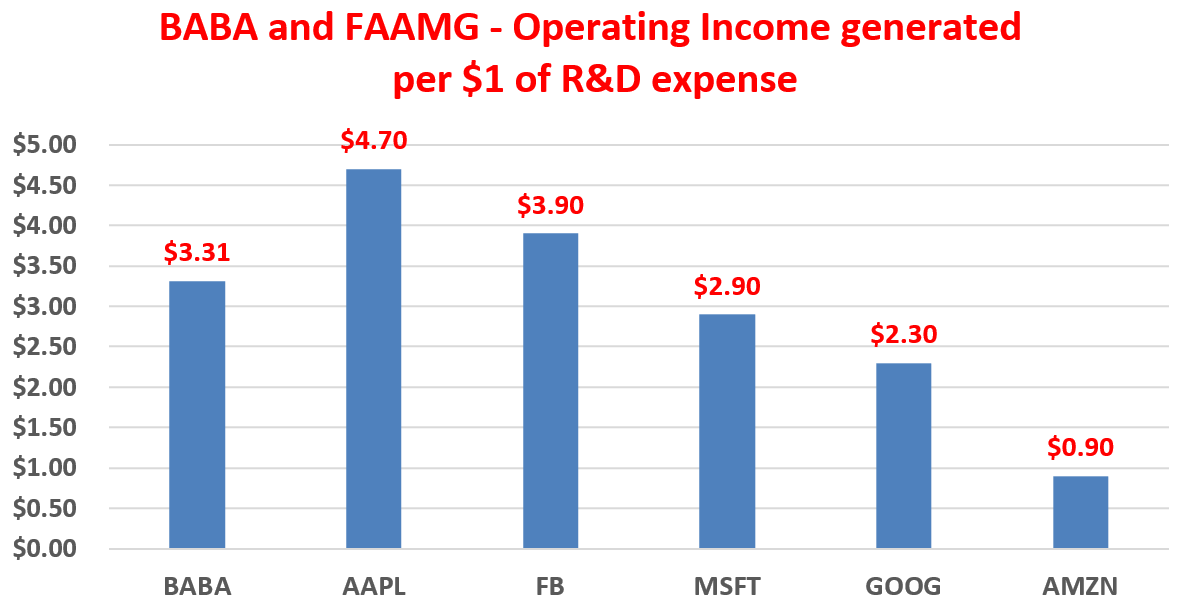
And the results are shown in the chart below for BABA and AMZN. As you can see, their R&D yields are different qualitatively, with BABA’s yielding about $3.31 per $1 of R&D expenses and AMZN yielding only about $0.90. However, note that despite the qualitative differences, both BABA and AMZN have been demonstrating consistency in their R&D yield, signaling an efficient and sustainable process.
Also, to put things under a broader perspective, the next chart compares BABA and AMZN against the rest of the FAAMG stocks. As seen, the FAAMG stocks as a group feature an average R&D yield of $2.94. And BABA’s $3.13 is only behind Apple and Facebook (or Meta Platforms).
Source: Author based on Seeking Alpha data. Source: Author based on Seeking Alpha data.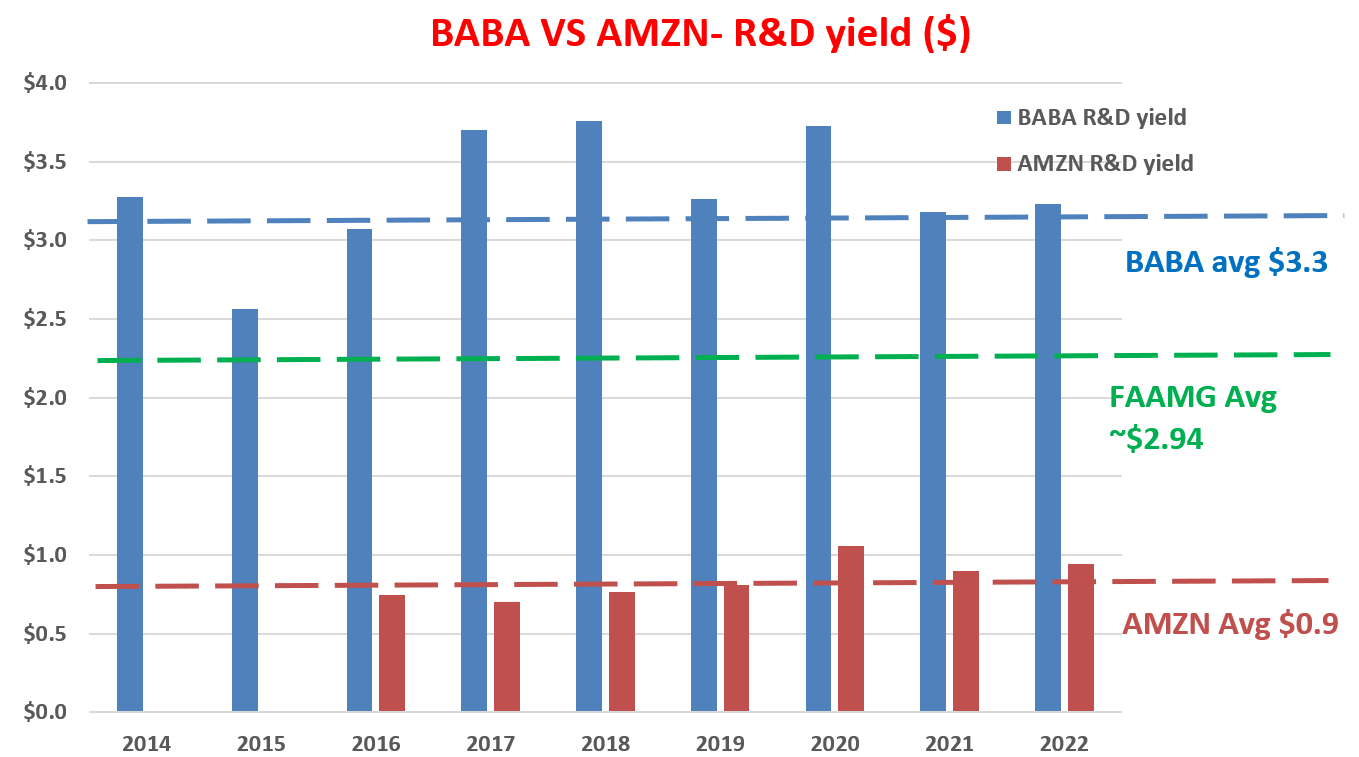
BABA vs. AMZN: profitability issues and potentials
We’ve examined their profitability above by the EBIT margin. Here, I will use ROCE (return on capital employed) as the main metric to take a closer look. As detailed in my blog article, ROCE is the most fundamental metric because:
ROCE considers the return of capital ACTUALLY employed and therefore provides insight into how much additional capital a business needs to invest to earn a given extra amount of income – a key to estimating the long-term growth rate. Because when we think as long-term business owners, the growth rate is “simply” the product of ROCE and reinvestment rate, i.e.,
Long-Term Growth Rate = ROCE * Reinvestment Rate
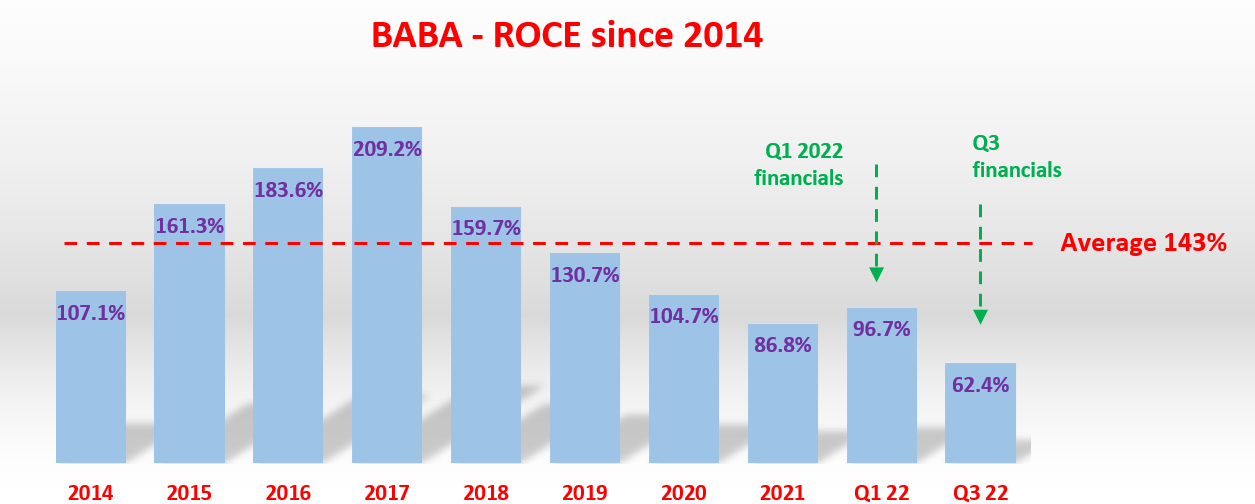
The ROCE results for BABA and AMZN are shown in the chart below. It is no secret that BABA’s profitability has suffered tremendously in the past few years, and this is clearly shown in its ROCE data. Even just a few years back in 2019~2020, its ROCE has been astronomical, exceeding 100% (rivaling that of AAPL, the one with the highest ROCE in the FAAMG pack). But as aforementioned, due to the slowdown of China’s macroeconomic growth and also the tightened regulation controls since 2021, its ROCE has suffered immensely. To wit, its ROCE has been on average 79.5% since 2020. And it currently hovers around 62.4% based on its most recent 2022 Q3 TTM financials as shown in the 2nd chart below.
AMZN’s ROCE in recent years has unfortunately followed a similar trend as seen, except with a less dramatic decline. AMZN boasted a superb ROCE in the earlier part of the decade too, between 50% and 100%. In recent years since 2020, AMZN’s ROCE has contracted substantially to an average of 29.0%. And its most recent 2022 Q3 TTM ROCE is even below this average as seen.
However, when we broaden our view a bit wider, both AMZN and BABA still enjoy robust ROCE. As a reference point, the overall economy’s ROCE is around 20%. And as I will argue next, AMZN and BABA enjoy far better growth potential than the overall economy thanks to the secular shift towards e-commerce.
Source: Author based on Seeking Alpha data. Source: Author based on Seeking Alpha data.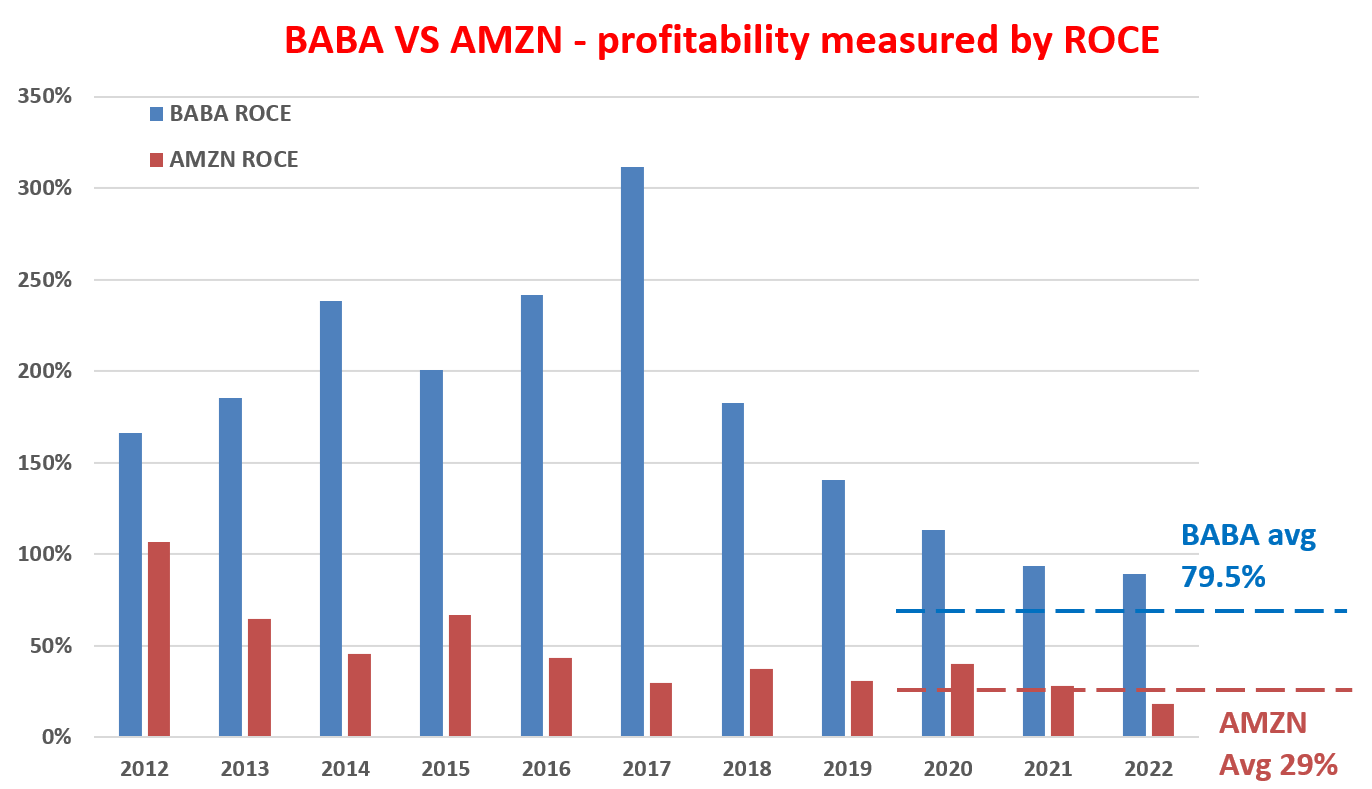
BABA vs. AMZN: secular trend and growth prospects
As aforementioned, I see BABA and AMZN as the bellwether stocks in the e-commerce space, and I also see both of the best-positioned stocks to capitalize on the secular growth of e-commerce. With all the online shopping apps installed on our smartphones, it is sometimes easy to form the misconception that e-commerce penetration is already toward an end. But the reality is nothing but. The global e-commerce penetration is at ~20%. Thus, the majority (80% of it) of commerce is still offline. Global retail e-commerce sales only reached $4.2 trillion in 2020. The bulk of the growth curve is still yet to come, with retail e-commerce projected to double in size by 2026, hitting $7.4 trillion.
Source: Oberlo data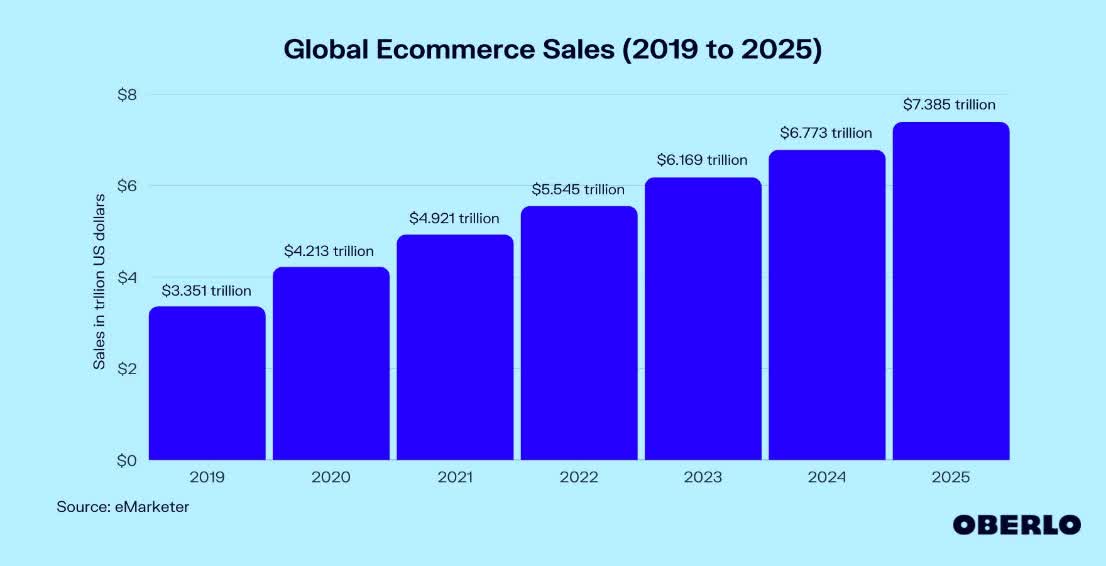
Another key growth area for both BABA and AMZN is could. AMZN is the leading cloud provider in the U.S., with a market share far higher than MSFT and GOOG as seen from the following IOT report. In particular,
The cloud market has seen revenues grow at high double digits for years according to the report. The global public cloud market reached $157 billion in 2021and is expected to grow into a $2 to $10 trillion industry in a few years according to another.
And just AMZN is the dominant cloud provider in the U.S., BABA is the dominant player in China and other overseas markets. With the rapid growth potential in the could space, I anticipate AMZN and BABA to enjoy the support of this secular trend for many years to come.
Source: IOT report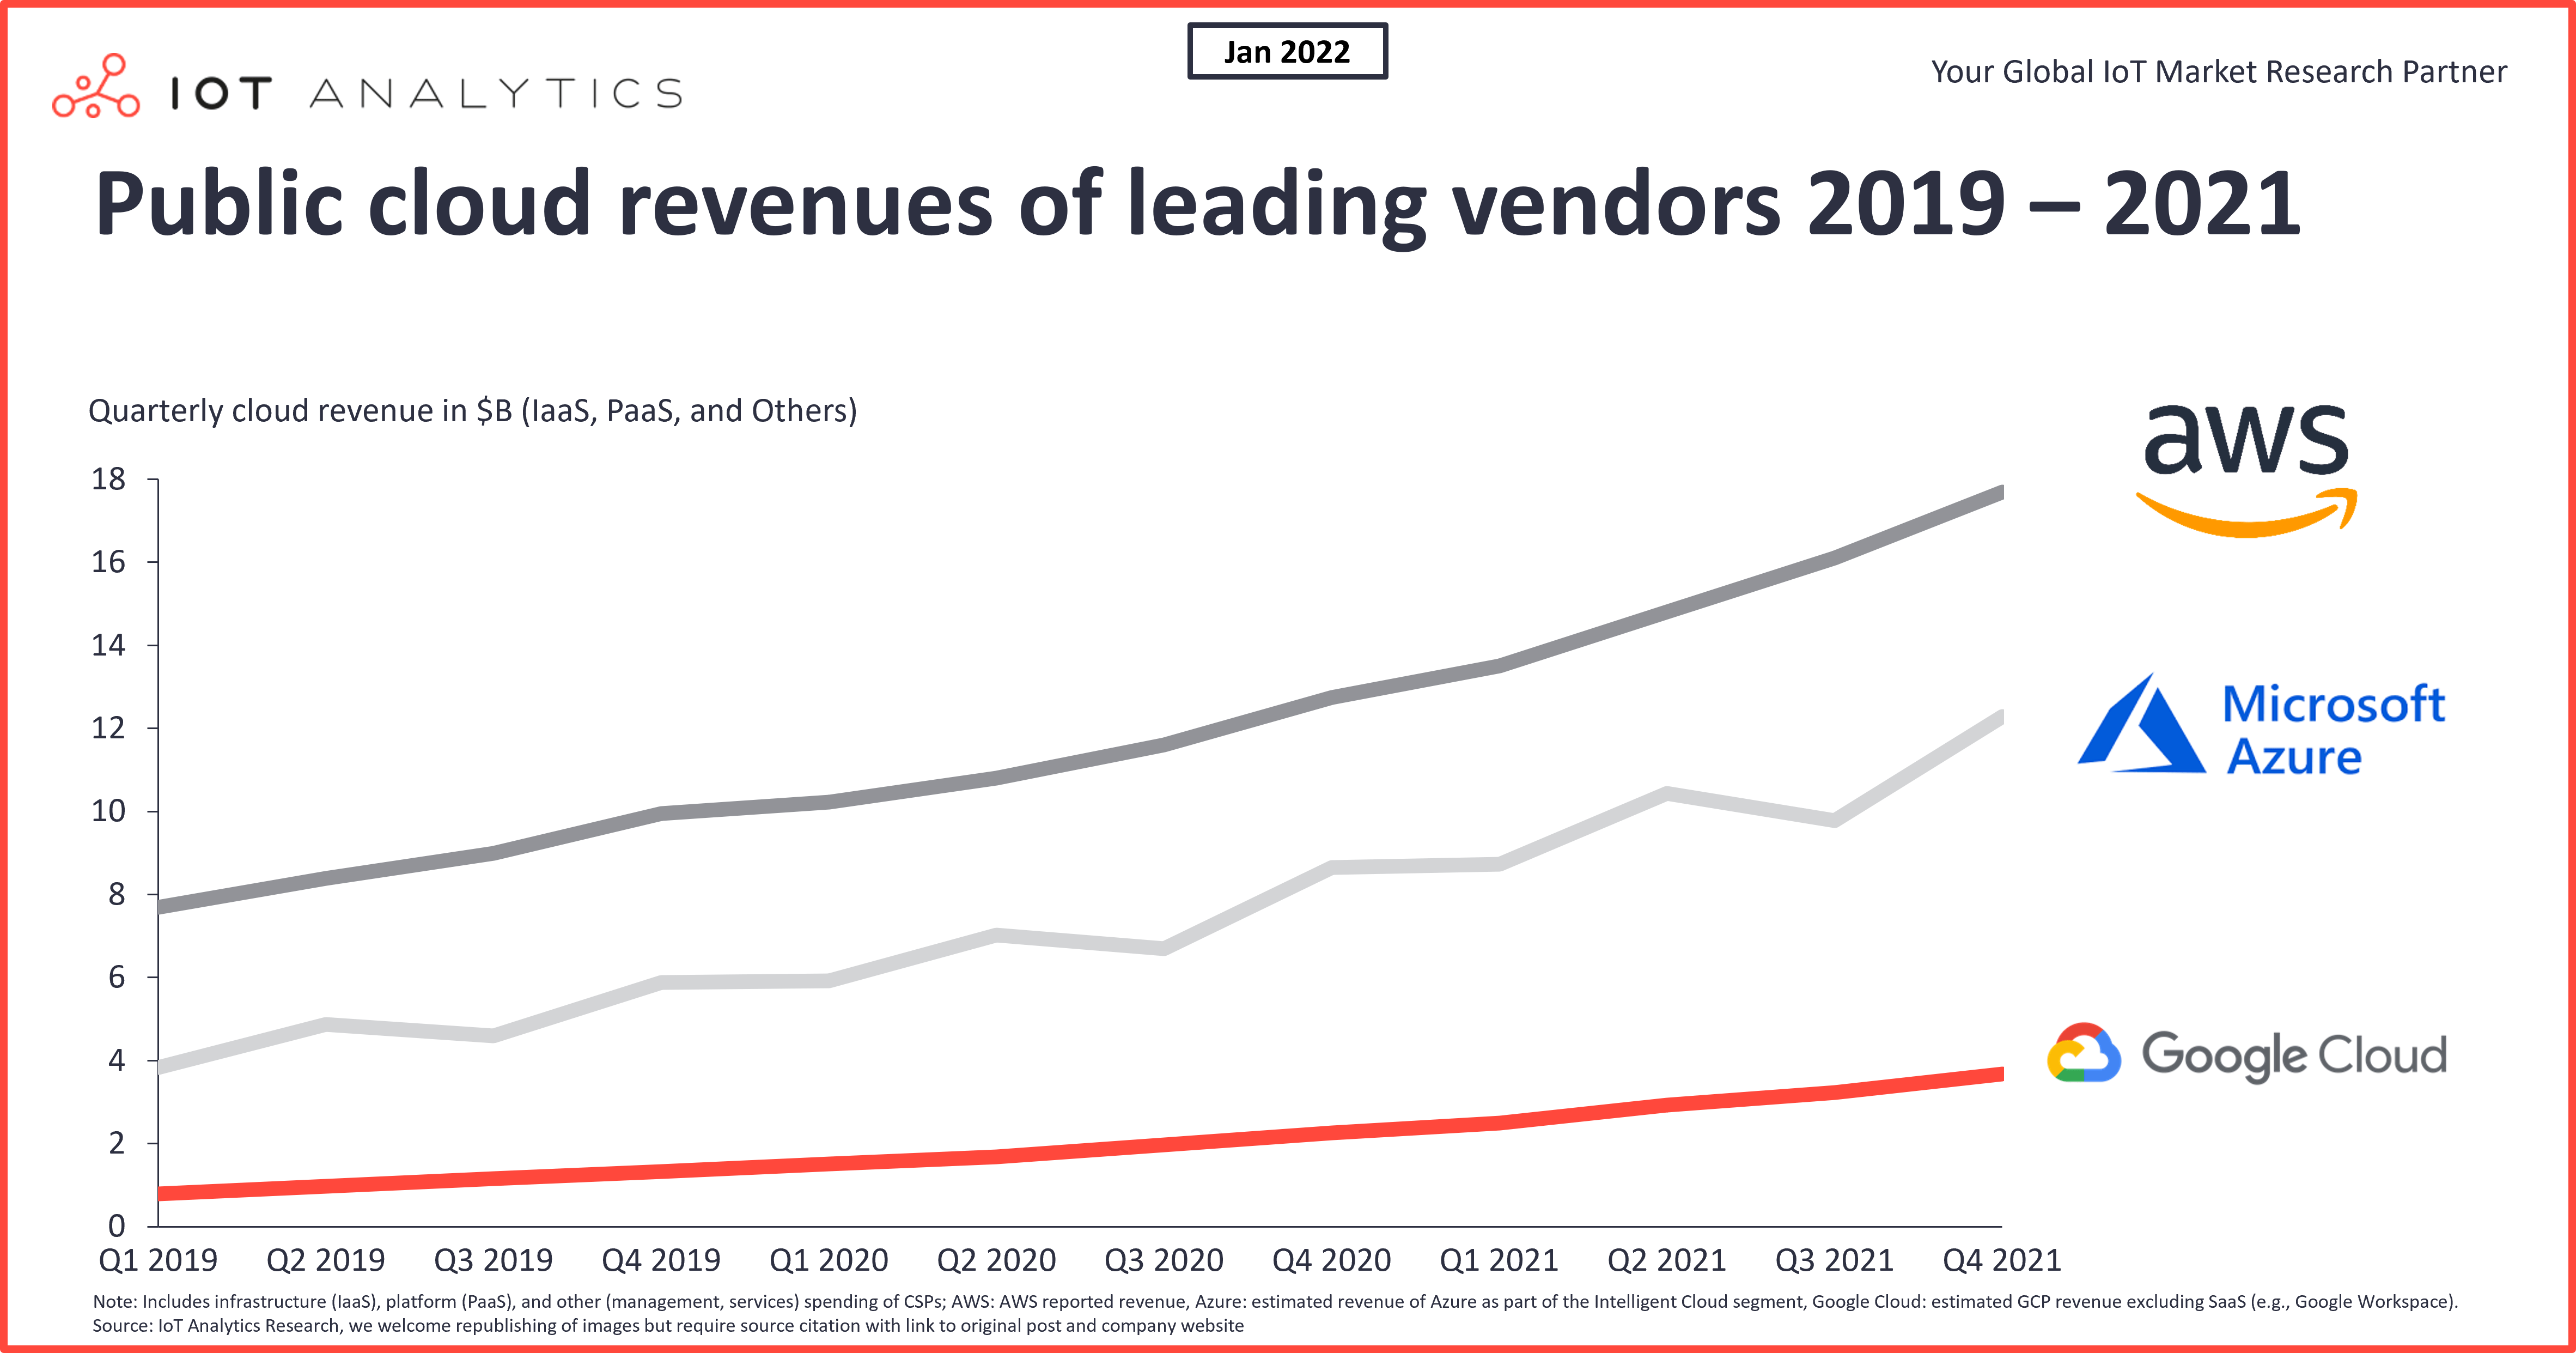
Risks and final verdict
As aforementioned, there are definitely headwinds for both stocks in the near term. For BABA, China’s COVID-19 restrictions are still impacting many parts of the country’s economy (with ripple effects to other countries). Customer growth in its China Commerce division (TaoBao and Tmall in particular) could take time to recover depending on the macroeconomic conditions. AMZN faces a range of near-term uncertainties such as inflation, supply chain pressures, and also currency exchange rates. The profitability of AMZN has been pressured by these headwinds in recent years as mentioned above and I see them persisting into 2023. These headwinds have created a challenging environment for its retail operations, which reported operating losses in recent quarters (as seen from the EBIT margin earlier). In response, AMZN has been dealing with cost control issues. For example, it had to shut down its subsidiary, fabric.com (which sold fabrics for almost 30 years), as a way to slash costs.
All told, I see the market sentiment toward the eCommerce sector has shifted from extreme greed to extreme fear in the past 2 years, as represented by the tremendous valuation contraction in BABA and AZMN stocks. However, business fundamentals still matter and will always matter. As you can see from the table below (which summarizes the key fundamentals and valuation metrics discussed throughout the article), both are still excellent businesses if you just look past the immediate headwinds. In particular, the PE of BABA (around 10x) is so low that it implies a permanently stagnating business despite the tremendous growth opportunities mentioned above. In particular, its cloud segment and International Commerce Retail segment, including Lazada and AliExpress, offer plenty of growth potential.
Source: Author based on Seeking Alpha data.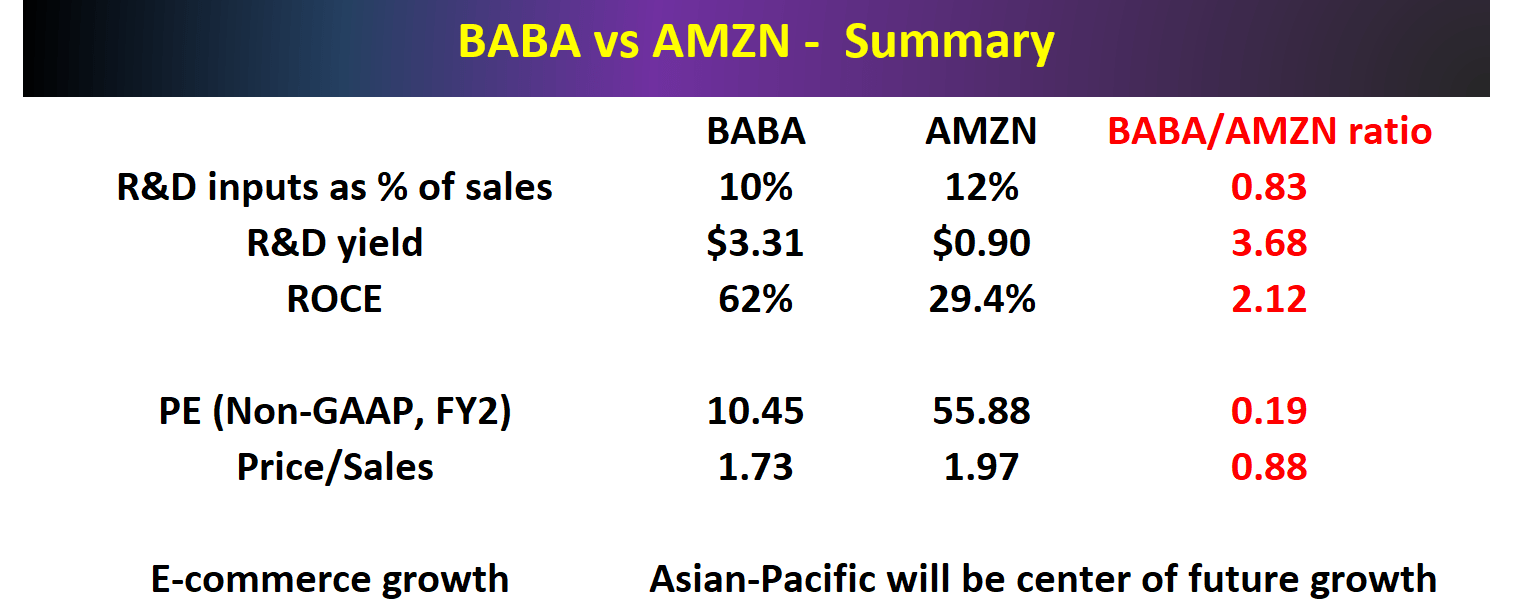
Be the first to comment