

Andrew Burton
As we’re all coughing from the latest dust created by equity markets stomping their hooves in a second attempt at bullish aggression, Alibaba Group Holding Limited’s (NYSE:NYSE:BABA, OTCPK:BABAF) fortunes don’t immediately appear that bullish. However, Alibaba has formed a wave one two pattern complex, albeit at the moment price is languishing in the lower to mid echelons of the structure, perhaps still recovering from its third wave fakeout and both recent and current headwinds.
With tens of millions still under strict lockdown in China as regions are still trying to contain outbreaks of Covid 19, Alibaba is also still perhaps staring at the battle-ready equity heavyweights while it nurses a few wounds. This year’s Q2 earnings came with a revenue beat, but growth flatlined for the first time in the company’s history, undoubtedly affected by supply chain issues along with the strict regulatory requirements enforced by Beijing for over a year and half while the crackdown on the domestic technology sector continues. One must also wonder if Chinese planes carrying out military drills around Taiwan added to investor indecision.
Alibaba still remains an e-commerce giant and has technically set up a Bullish formation, so we will move to the charts to look at the current wave structure, including the fakeout, and dissect a resistance level and target.
Alibaba current macro structure. Monthly chart (C Trader )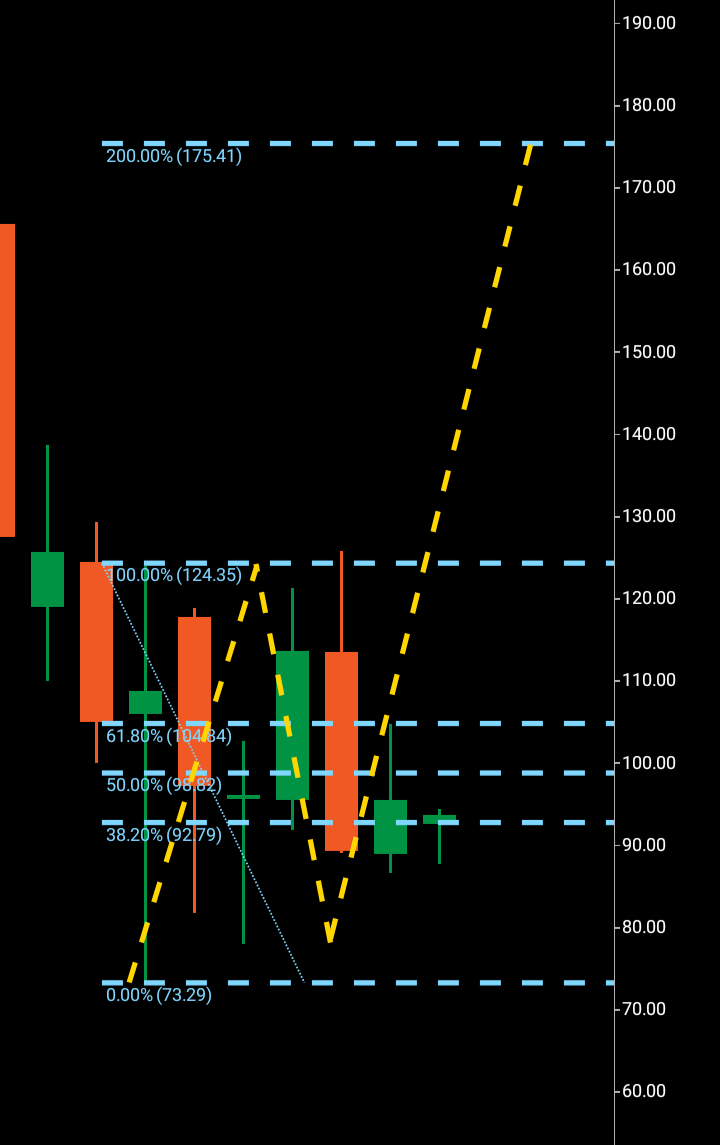
We can see on the monthly chart above the far left bullish candle that spans the length of the whole wave one. This candle has a low of $73 and high of $124 and has technically seen a very protracted wave two that has effectively gone sideways for months. In June, price broke ever so slightly above the previous resistance leading to a technical fakeout by turning extremely bearish, however price has not been carried outside the low of $73. So, a nervy time aside for those who entered a bullish trade at the resistance break point, price has held up reasonably well and is technically still primed to break out higher.
It is one of the old famous trading questions, to let a market run a bit higher to lower the probability of a fakeout once resistance has been broken or to take the trade immediately a pip above the point of breakout. If you chose the latter, a case like this would be quite nervy to say the least, if you chose the former you’d be still lying in wait rent-free for a better opportunity. Alternatively, waiting for a market to go a little higher before entry is pips missed as a third wave completes… go figure.
So we can see the wave one $73-$124 and sideways wave two $124-$76. Often when price is condensed between two ranges particularly that aren’t very far apart and is forced to go sideways as it tests areas between support and resistance, this can be seen to be very bullish if it were to break out upwards obviously. The third wave should it break above $124 would be due to land at $175 for a numerical replication of wave one which we have technically printed. As price has been condensed for so long, we will also examine the other Fibonacci levels in case of a large bullish move to cover the possibility of a price explosion because of the squeeze.
Alibaba monthly with extended Fibonacci levels (C Trader )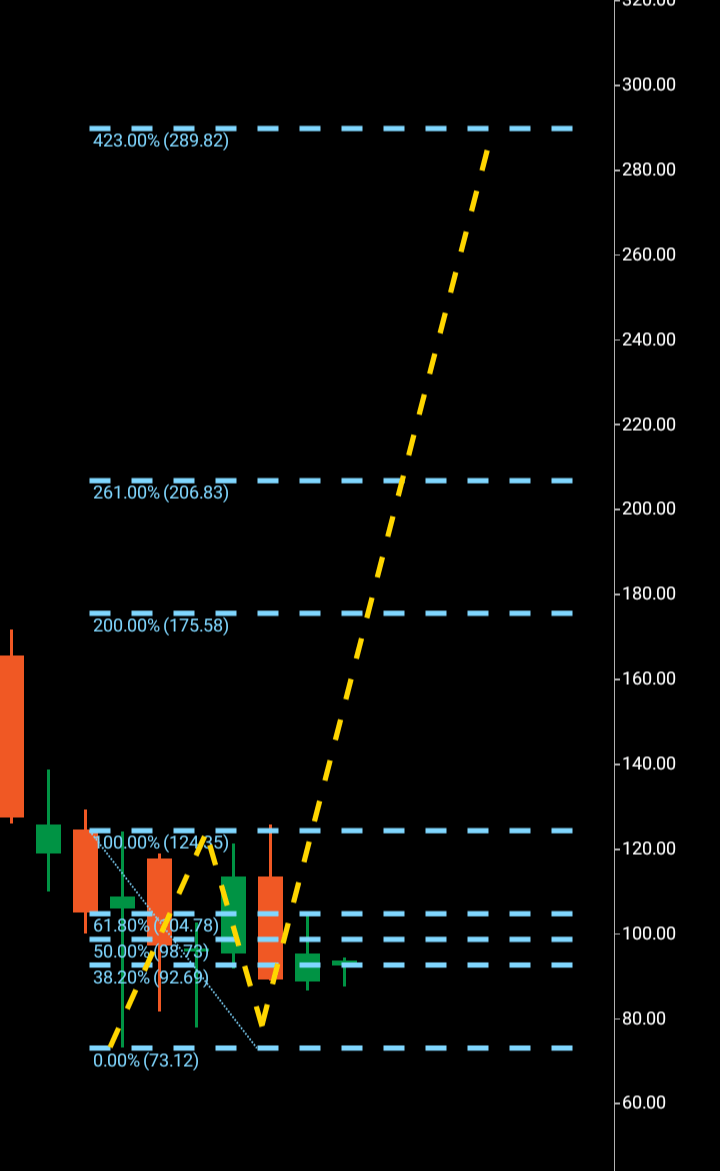
Above the continuation, possible Fibonacci levels are outlined with $206 and $289 further targets should Alibaba continue through the wave patterns if the third wave does break out.
Below is the weekly chart that magnifies how the pattern is forming on the monthly.
Alibaba weekly (C Trader )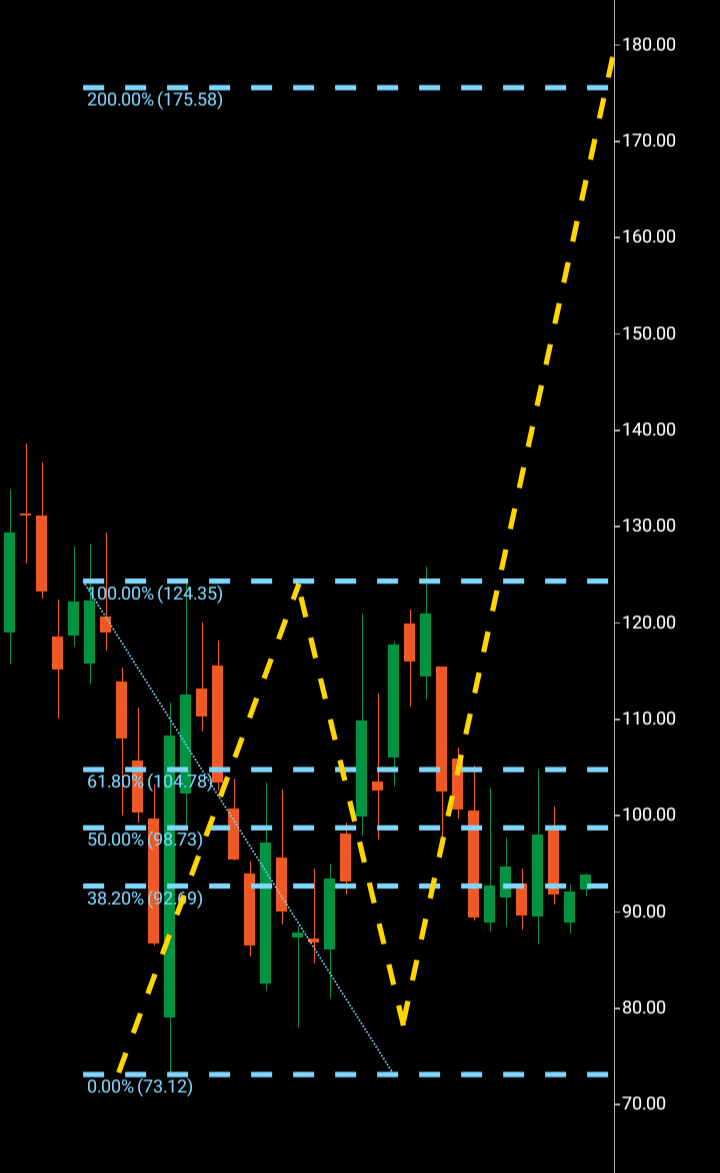
We can see above on the left hand side that a very bullish set of weekly candles were then nearly matched by a set of bearish candles, although price did stay above the low. It was only as this pattern set in the middle of the chart that we can see two three wave patterns on the weekly chart that actually led to the fake out with current price trying to find bullish traction.
To finalize, if price can drive above $125, it would technically initiate the third wave for a second time, with $175 being the initial target and anything below $73 rendering any move upwards a fail.
About the Three Wave Theory
The three wave theory was designed to be able to identify exact probable price action of a financial instrument. A financial market cannot navigate its way significantly higher or lower without making waves. Waves are essentially a mismatch between buyers and sellers and print a picture of a probable direction and target for a financial instrument. When waves one and two have been formed, it is the point of higher high/lower low that gives the technical indication of the future direction. A wave one will continue from a low to a high point before it finds significant enough rejection to then form the wave two. When a third wave breaks into a higher high/lower low the only probable numerical target bearing available on a financial chart is the equivalent of the wave one low to high point. It is highly probable that the wave three will look to numerically replicate wave one before it makes its future directional decision. It may continue past its third wave target but it is only the wave one evidence that a price was able to continue before rejection that is available to look to as a probable target for a third wave.
Be the first to comment