

Robert Way/iStock Editorial via Getty Images
Introduction
My thesis is that Alibaba (NYSE:BABA) will deliver massive amounts of operating income from commerce in the decade ahead. I don’t see anyone that looks to be close to them in the next few years with respect to operating income from e-commerce.
The fiscal years for Alibaba and Walmart (WMT) end in March and January, respectively. The graphs in this article use calendar years so Alibaba’s fiscal year through March 2022 and Walmart’s fiscal year through January 2022 go under 2021.
When the Alibaba 4Q22 release came out for their FY22 ending in March, the exchange rate was about 0.1577 RMB to 1 USD. At the time of this writing it is closer to 0.15 RMB to 1 USD.
The Landscape
Alibaba has a substantial base on which they will power operating income in the decade ahead. Looking at the last fiscal year, operating income from Alibaba’s China commerce segment was RMB 172,219 million which is around $26 billion. This is about the same as Walmart’s company-wide operating income but nearly all of Walmart’s operating income comes from brick and mortar stores as opposed to e-commerce. There is plenty of room for numerous e-commerce companies in China. JD (JD) has done well with wealthy customers who insist on high quality merchandise. Pinduoduo (PDD) is fun for buyers who want to do social and group shopping. Amazon (AMZN), JD and Pinduoduo get a lot of headlines based on gross merchandise volume (“GMV”) but their e-commerce operating income levels are small compared to Alibaba. Only $6,347 million of Amazon’s 2021 operating income was outside of AWS. The 2021 operating income numbers for JD and PDD were RMB 4,141 million and RMB 6,897 million, respectively. These equate to just $621 million and $1,035 million, respectively.
Machine Learning
Tmall and Taobao have a large number of users and a prodigious amount of data on which machine learning feeds. An April MIT Technology Review post explains the virtuous cycle enjoyed by digital giants like Alibaba as they continually improve their recommendation engines:
The architectural and technical genius of recommender-system design lies in its compelling blend of data gathering, ongoing algorithmic innovation, and network effects. The more people use these systems, the more valuable they become; the more valuable they become, the more people use them. Machine-learning capabilities accelerate that virtuous cycle to ensure recommendations and advice become ever-more relevant and compelling.
Opportunities
Alibaba has numerous opportunities including their participation in China’s economic expansion. The World Bank shows that China’s GDP nearly doubled from 2011 to 2020, going from $7.6 trillion to $14.7 trillion. Alibaba’s operating income should keep climbing as China’s GDP and middle class continue to increase in size.
Alibaba has opportunities beyond e-commerce as we know it. A June 2021 Wired article talks about the way Alibaba has invented the supermarket of the future:
Towson says. “Eventually, consumers won’t even know the difference between online and offline. You’ll walk down the supermarket aisle, chatting to the AI assistant on your phone as it’s suggesting items. You’ll pick up the sneakers you ordered online earlier that day. You’ll stream a movie on the same platform as they cook your food in store. It’ll all be one experience. This is just the first iteration and it’s pretty compelling.
Flexibility
Three years ago I didn’t envision today’s world in which we are experiencing relatively high inflation in the U.S. Eventually this type of change could hit China too and Alibaba is more flexible than other asset-heavy companies like JD.
Valuation
In September 2021, Alibaba announced that they are investing RMB 100 billion to promote common prosperity over 5 years. I view this type of forced investment in the same light as higher corporate taxes such that the government is coming in as a silent partner; the valuation range has to be adjusted down. I believe it will be more than just taking away RMB 20 billion in earnings from shareholders for each of the next 5 years. There is a good chance it will go up from there. As such, I don’t think it is unreasonable to assign a multiple of 25x or so on the annual amount of RMB 20 billion that would otherwise go to shareholders each year such that the valuation is now lower by RMB 500 billion or $75 billion.
Among other things, I look at operating income, operating cash flow (“OCF”) and free cash flow (“FCF”) for Alibaba and competitors when thinking about valuations. It would be facile to go straight down to these numbers without first having an understanding of gross merchandise volume (“GMV”) and revenue. There is competition between these companies but the e-commerce pie will grow in the decade ahead such that this is not a zero sum game.
Smaller companies like Pinduoduo and JD are increasing GMV more rapidly than Alibaba but all the e-commerce companies below are increasing volume faster than brick and mortar retailers like Walmart:
GMV (Author’s spreadsheet)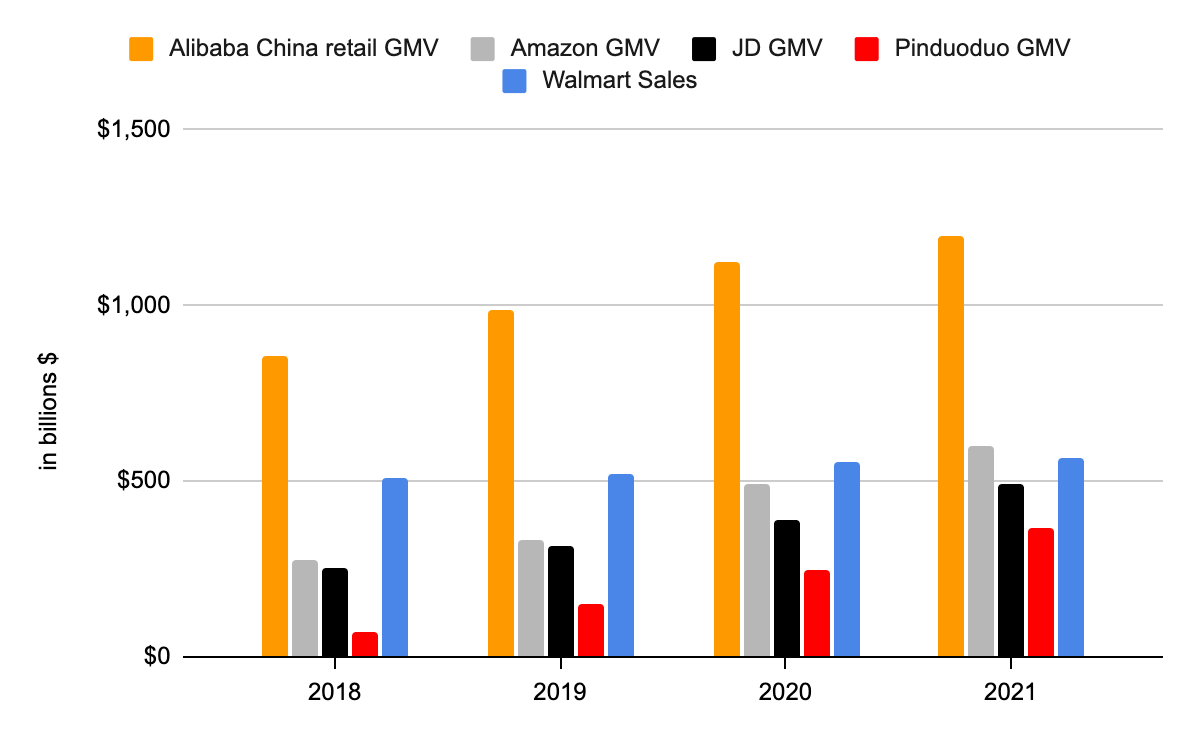
*The Amazon estimates are from Marketplace Pulse.
*The Alibaba fiscal year begins April 1st.
*The Walmart fiscal year begins February 1st.
The tables are turned for Alibaba and Amazon when we switch from GMV to company-wide revenue. Despite the fact that Alibaba moves about twice the merchandise volume of Amazon, Alibaba has a much lower take rate such that their revenue is significantly lower. We’re talking about company-wide revenue so it includes non-commerce figures. It is noteworthy that Amazon has a sizable first-party (“1P”) e-commerce business while Alibaba does not. Marketplace Pulse shows that Amazon’s 2021 GMV segments are broken down as $210 billion 1P and $390 billion third-party (“3P”); Amazon’s revenue for these GMV segments is $222 billion and $103 billion, respectively:
Revenue segments (Author’s spreadsheet)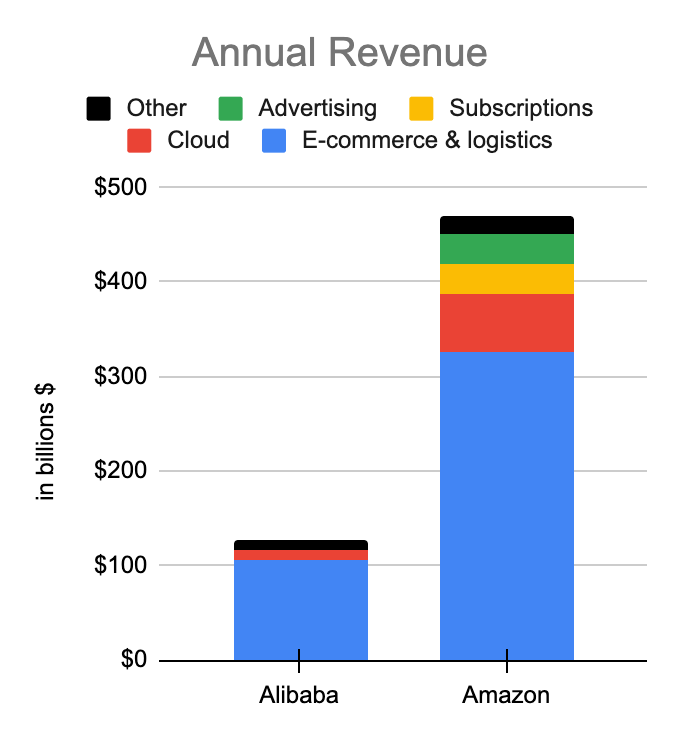
Now that we appreciate the disparate types of revenue at Amazon, we look at company-wide revenue for the group. Again, Alibaba is almost entirely 3P revenue while Amazon, JD and Walmart have enormous 1P businesses:
Company-wide revenue (Author’s spreadsheet)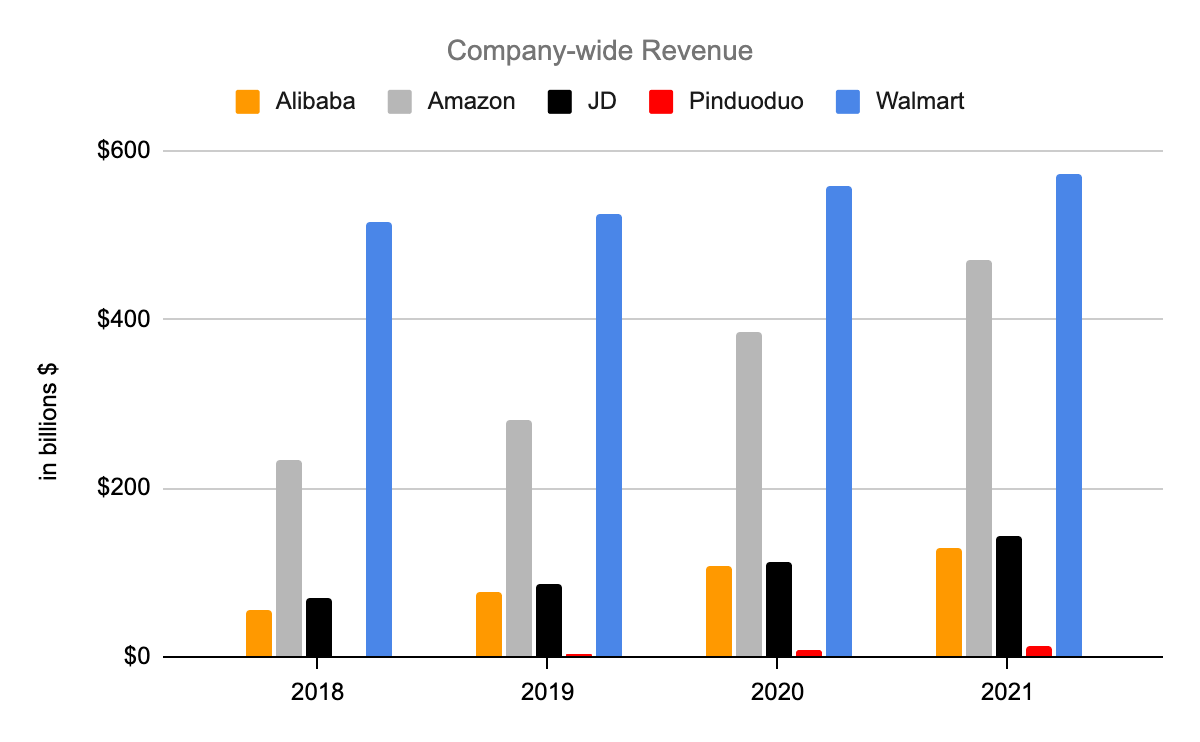
Alibaba breaks down their operating income such that we can see the power of their China commerce segment:
Operating income segments (Alibaba earnings release through March 2022)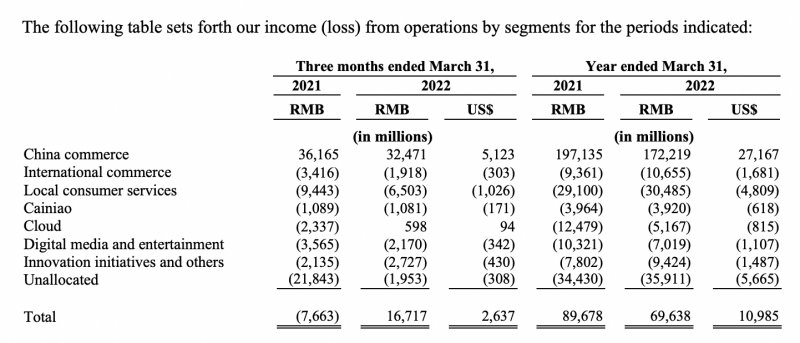
Meanwhile, Amazon’s 2021 operating income was $24,879 million and $18,532 million or nearly 75% of this came from AWS!
Alibaba’s FY22 China commerce operating income of RMB 172,219 million above was equivalent to about $27 billion back when the release came out but it is now equivalent to about $26 billion due to currency fluctuations. On the whole, I dislike Alibaba’s adjusted EBITA tables because they ignore share-based compensation. However, the amortization of intangible assets and impairment of goodwill lines from those tables are useful because in my view these GAAP expenses aren’t really economic expenses. The amortization of intangible assets line from the EBITA table comes to RMB 11,647 million on a consolidated basis and RMB 6,154 million of this is from the Local consumer services segment. The unallocated line includes goodwill impairment of RMB 25,141 million relating to Digital media and entertainment. If the rest of the unallocated operating loss of RMB 10,770 million and the innovation operating loss of RMB 9,424 million are absorbed by the China commerce segment then its operating income falls to RMB 152,025 million or a little under $23 billion. I think this segment is worth 15 to 16x this amount or around $345 to $370 billion. The other segments currently have negative operating income but they are worth more than zero. Alibaba’s strategic investments are worth billions and their interest in the Ant Group is considerable.
The Cloud segment had less revenue in the March 2022 quarter than the December 2021 quarter but we can assuage ourselves knowing that the Cloud segment reduced its operating losses from FY21 to FY22 and it had positive operating income of RMB 598 million for the latest quarter. I like to compare Alibaba’s Cloud segment to Google Cloud as Google Cloud is increasing revenue faster but Alibaba Cloud is losing less money:
Alibaba Cloud (Author’s spreadsheet)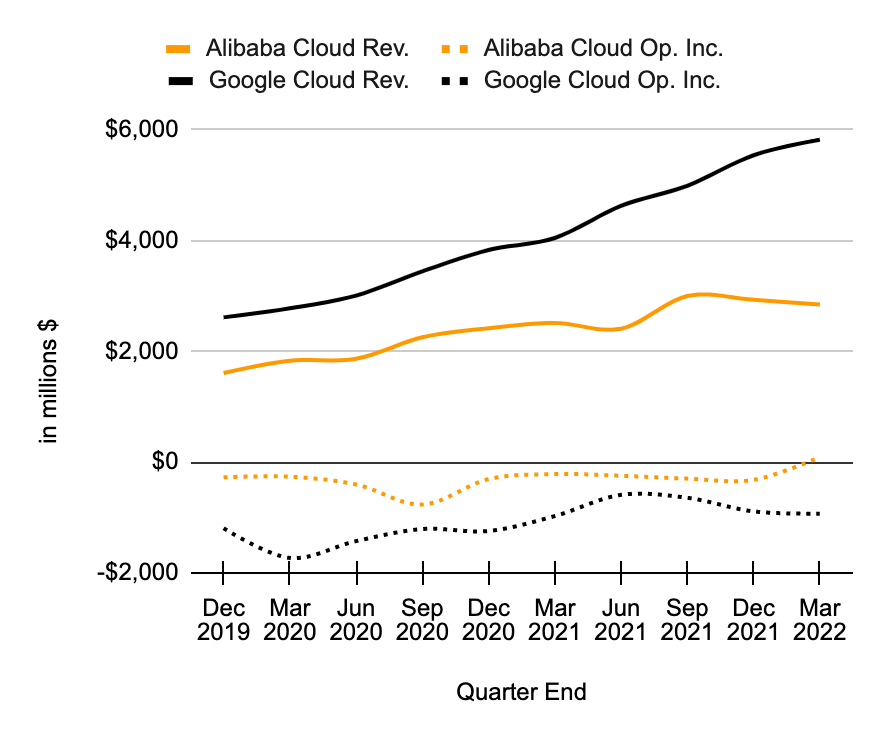
I also like to think about the OCF yield. Looking at the last fiscal year, Alibaba has an OCF yield of nearly 17% or RMB 142,759 million/RMB 853,062 million while Amazon has an OCF yield of a little under 10% or $46,327 million/$469,822 million. Much of this is because Amazon’s low-margin 1P business is responsible for substantial revenue but it doesn’t contribute much to operating income or OCF. Were it not for Amazon’s AWS business, I believe their OCF yield would be down near the JD and Walmart level of 5% or so:
OCF Yield (Author’s spreadsheet)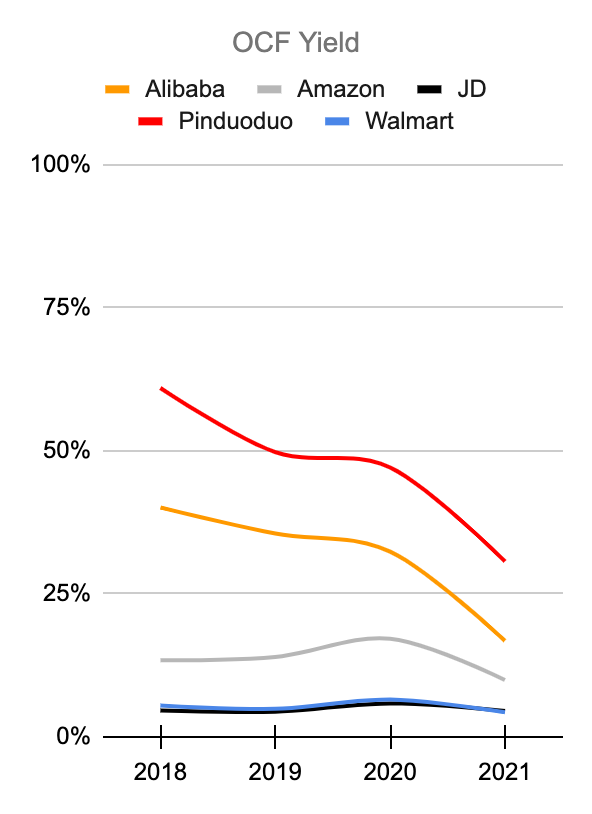
It isn’t just Alibaba that has seen a lower level of operating cash flow in the last fiscal year; Amazon and Walmart have declined in this area as well:
OCF (Author’s spreadsheet)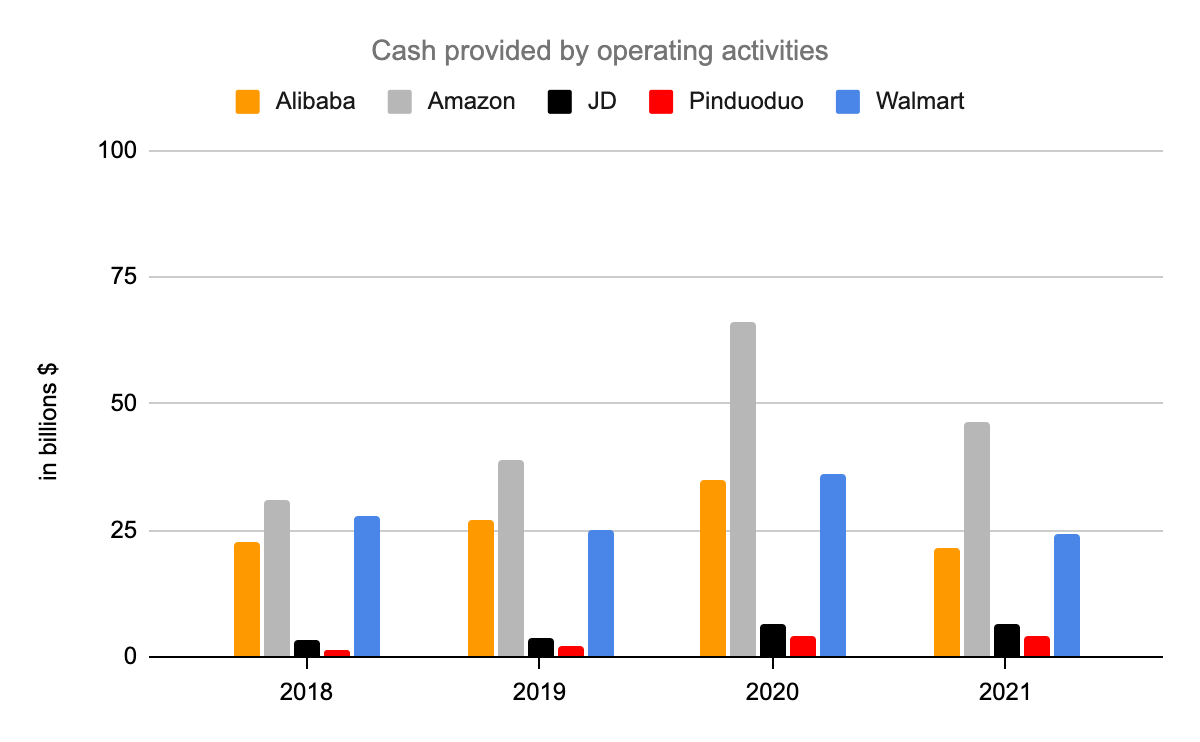
Alibaba’s free cash flow (“FCF”) was down in FY22. The latest earnings release cited a decrease in profit and the RMB 18,228 million Anti-monopoly Fine:
Free cash flow, a nonGAAP measurement, was RMB 98,874 million (US $15,597 million), a decrease of 43% year-over-year from RMB 172,662 million in fiscal year 2021, mainly due to a decrease in profit and the full payment in the amount of RMB 18,228 million of the Anti-monopoly Fine.
I’m optimistic that Alibaba can get FCF back to the FY21 level and beyond in the years ahead:
FCF (March 2022 release)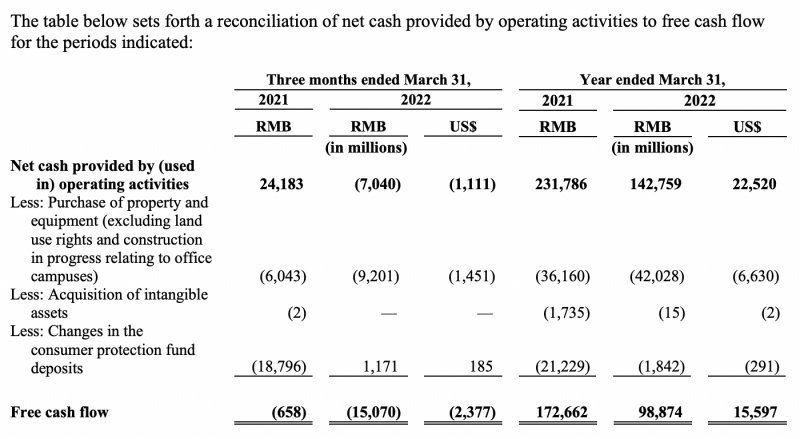
Note that I think of stock-based compensation as a cash expense. This was RMB 23,971 million for the fiscal year ending in March 2022 and RMB 50,120 million for the fiscal year ending in March 2021.
The weighted number of shares for the quarter ending in March was 21,401 million. Each American depositary share represents 8 ordinary shares. As such, the market cap is about $281.5 billion based on the June 12th ADR price of $105.23. Cash and short-term investments outweigh long-term debt such that the enterprise value is less than the market cap.
Again, I believe the China commerce segment alone is worth more than the current market cap so the stock is undervalued in my opinion.
Be the first to comment