

agnormark
It’s been a mixed start to the Q2 Earnings Season for the Gold Miners Index (GDX), with a few companies reporting increases to their FY2022 cost guidance due to inflationary pressures. However, Alamos Gold’s (NYSE:AGI) strong performance and ahead-of-budget mine commissioning allowed it to maintain cost guidance. Even more exciting, it unveiled a Phase 3+ Study at its Island Gold Mine, making it the proud owner of Canada’s lowest-cost mine in 2026. Given AGI’s improving margin profile and strong track record of reserve/production growth per share, I see the stock as a Buy on any weakness.
YLG Operations (Company Presentation)
Q2 Production
Alamos Gold (“Alamos”) released its Q2 results last week, reporting quarterly production of ~103,900 ounces, a 9% decline from the year-ago period. Meanwhile, all-in sustaining costs were up 3% to $1,170/oz. These might not seem like very impressive headline numbers. However, this was an exceptional quarter, with the company’s two main operations (Island and Young Davidson) producing a combined ~84,000 ounces of gold at all-in sustaining costs of ~$980/oz. So, if not for the much higher cost quarter in Mexico as the Mulatos District operations transition to its new La Yaqui Grande [LYG] Mine, Alamos would have had one of the lowest cost profiles sector-wide.
Fortunately, investors won’t have to wait to see the benefit of this new high-margin asset (YLG), with production expected to increase sharply in the second half from a full quarter of contribution from YLG. While Mulatos produced ~15,200 ounces in Q2 at all-in sustaining costs of $1,636/oz, La Yaqui Grande produced 5,000 ounces in its shortened quarter, at cash costs of $451/oz. These operating costs are miles below the industry average and will provide a significant boost to margins and production in 2023 as we see a full year of contribution from this asset.
Alamos Gold – Quarterly Production by Mine (Company Filings, Author’s Chart)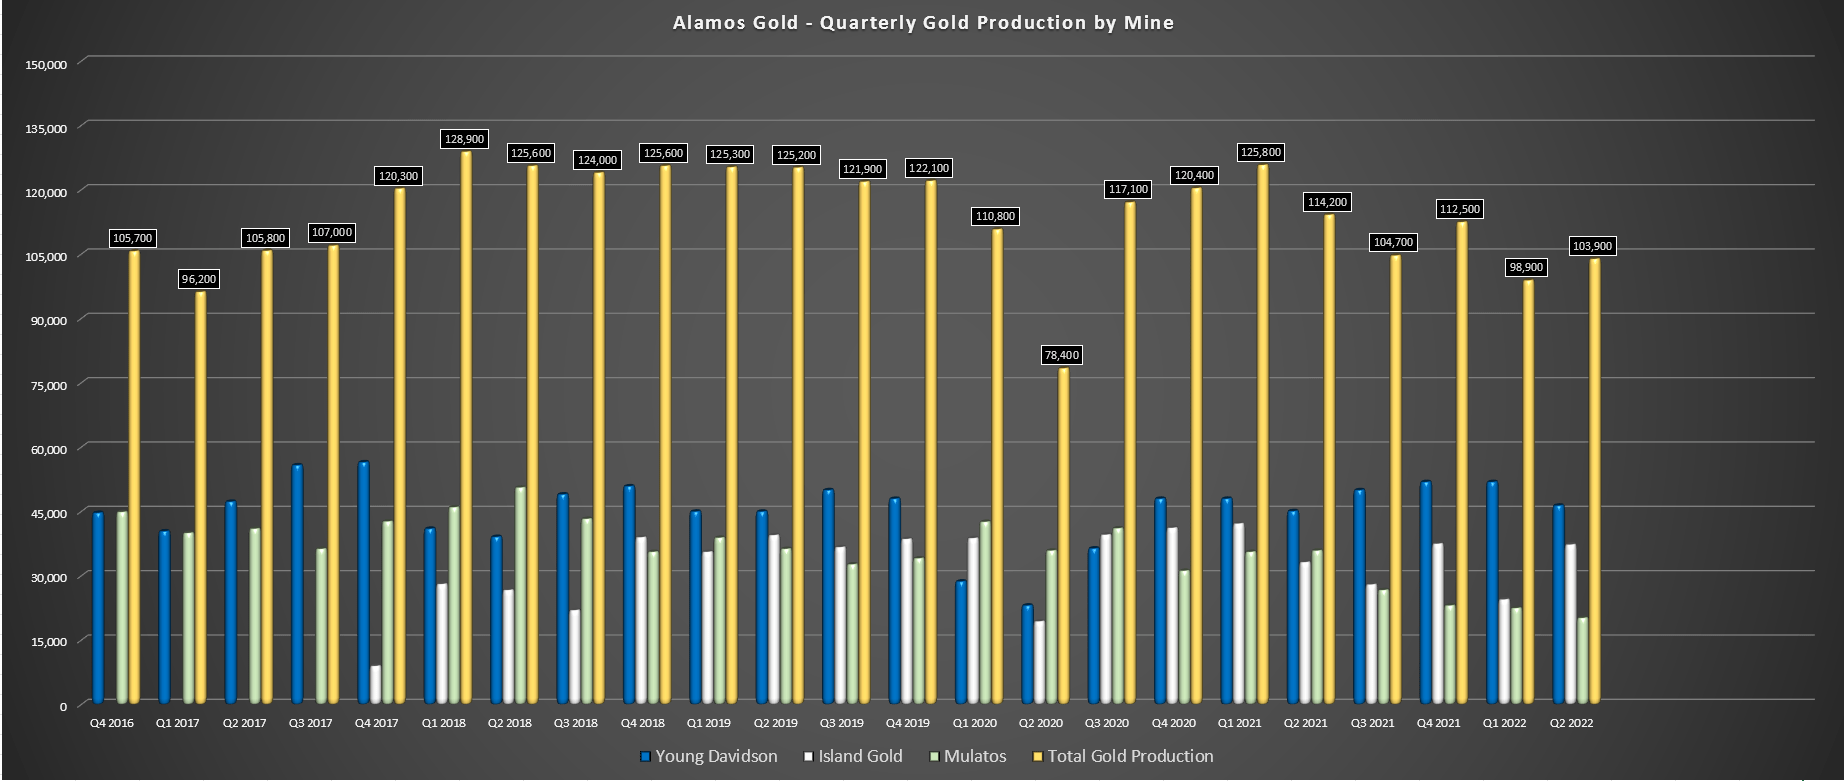
Looking at the rest of the portfolio, Young-Davidson had another solid quarter, evidenced by production of ~46,400 ounces at $1,087/oz costs. Notably, this marked the fourth quarter of mining rates above design of 8,000 tonnes per day (Q2 2022: 8,160 tonnes per day), and it generated over $30 million of free cash flow, a significant improvement from last year now that it’s out of the heavy investment phase (Lower Mine Expansion). This has placed the mine well on track to meet its annual guidance of 185,000 to 200,000 ounces, with ~98,300 ounces produced year-to-date.
Island Gold – Quarterly Gold Production (Company Filings, Author’s Chart)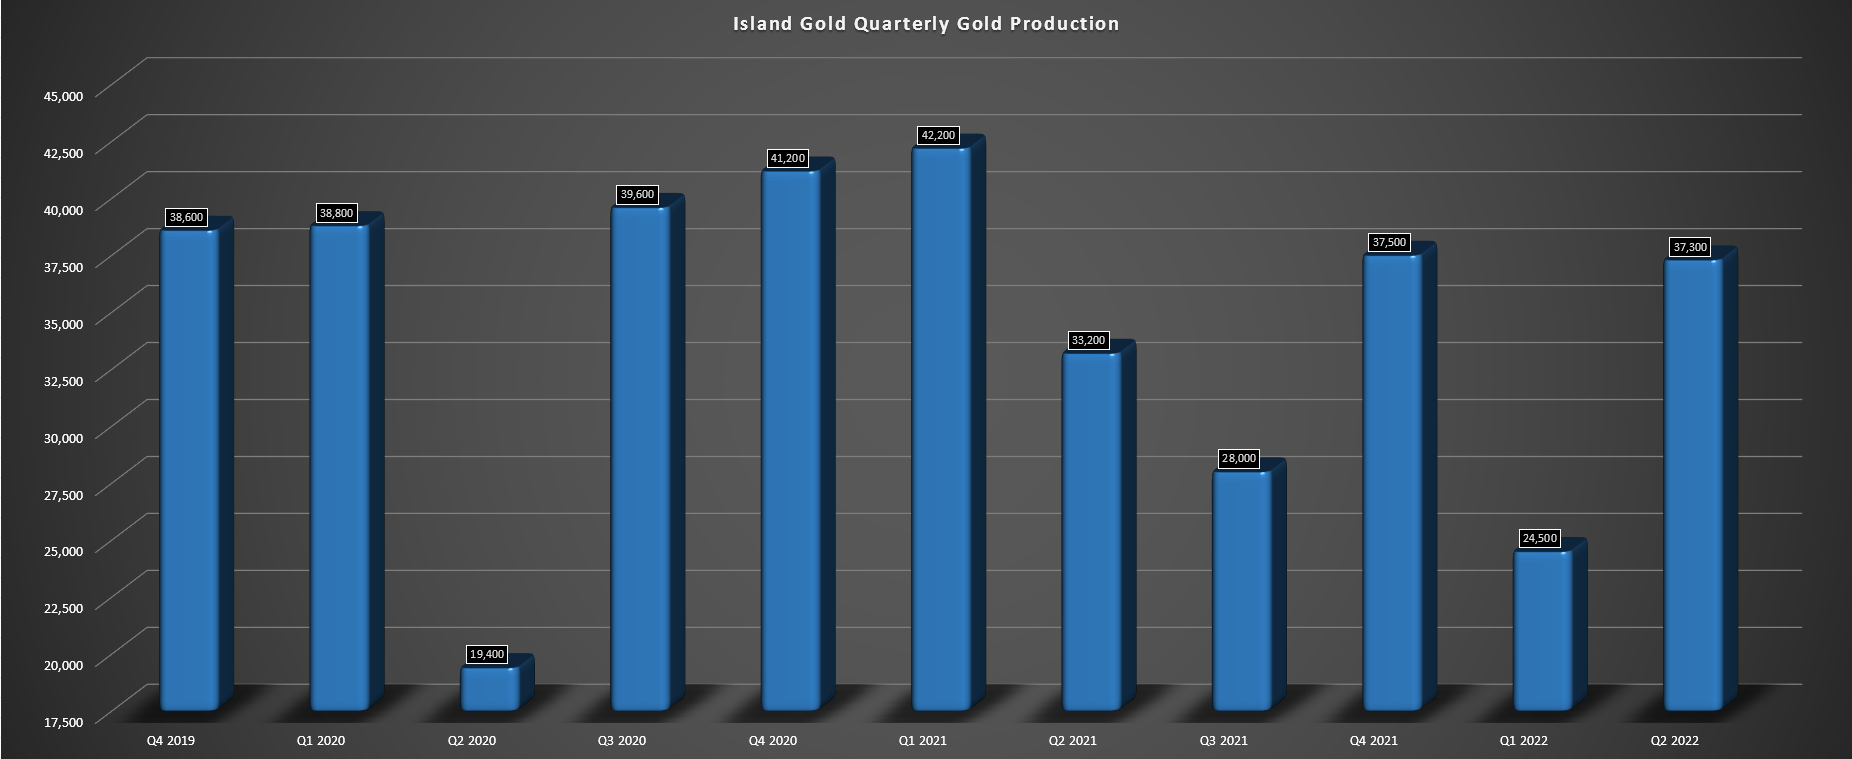
Moving over to Island, the mine had a much stronger quarter, producing ~37,300 ounces at all-in sustaining costs of $848/oz. This was a more than 12% increase from the year-ago period, driven by higher grades and throughput (~114,500 tonnes at 10.09 grams per tonne of gold) and the processing of 8,000 tonnes per day at the Young-Davidson mill. The company noted that due to the permitting limits at Island, stockpiled ore from Island will be processed at Young-Davidson, which has a much larger mill, which will boost production and cash flow. Given the solid operating performance, Island generated $20.2 million in free cash flow in the period (Q2 2021: $13.7 million).
Costs & Margins
While the operational performance was solid, it was the cost performance that really stood out for Alamos. In a period of rising gold prices and limited inflationary pressures like Q3 2020, less attention is paid to costs, given that margins are robust. However, in a rising cost environment with a flat/declining gold price, the wheat of the sector is easily separated from the chaff. In Alamos’ case, the company benefits from one ultra high-grade, low-volume operation (Island), leading to lower fuel consumption per ounce produced than its peers. It also benefits from a bulk-tonnage mine (Young-Davidson) with modest mining costs (sub $40/tonne).
Finally, while its Mulatos District operations are among the least attractive types of mines in a rising cost environment (high-volume, low-grade, heap-leach operations), YLG’s grades are well above the average heap-leach operation and benefit from existing infrastructure. Hence, while lower-grade heap-leach operations are likely to see sharply rising costs in this environment, like SSR Mining’s (SSRM) Marigold and Equinox’s (EQX) Mesquite Mine, LYG should enjoy all-in sustaining costs below $700/oz even after factoring in inflationary pressures. In summary, Alamos is relatively insulated from the inflationary pressures due to the nature of its operations (high-grade, heap-leach, high-grade underground, bulk mining underground).
So, while costs were up in the period ($1,170/oz vs. $1,136/oz), we will see Alamos’ costs begin to decline sharply in H2 2022, and they should drop below $1,060/oz in FY2023 (FY2022 guidance: $1,215/oz mid-point). Hence, even if the gold price is down in FY2023 and averages $1,775/oz, we would see Alamos enjoy meaningful margin expansion. This is a major differentiator for Alamos relative to a peer group that could see further margin contraction next year if the gold price can’t average at least $1,800/oz. The outlook for margin expansion next year is based on an average realized gold price of $1,820/oz in FY2022 ($605/oz AISC margins at guidance mid-point) and a $1,775/oz gold price in FY2023 ($720/oz AISC margins with $1,055/oz costs).
Alamos Gold – 2019-2026 Margin Progression vs. Peers (2019-2022) (Company Filings, Author’s Chart)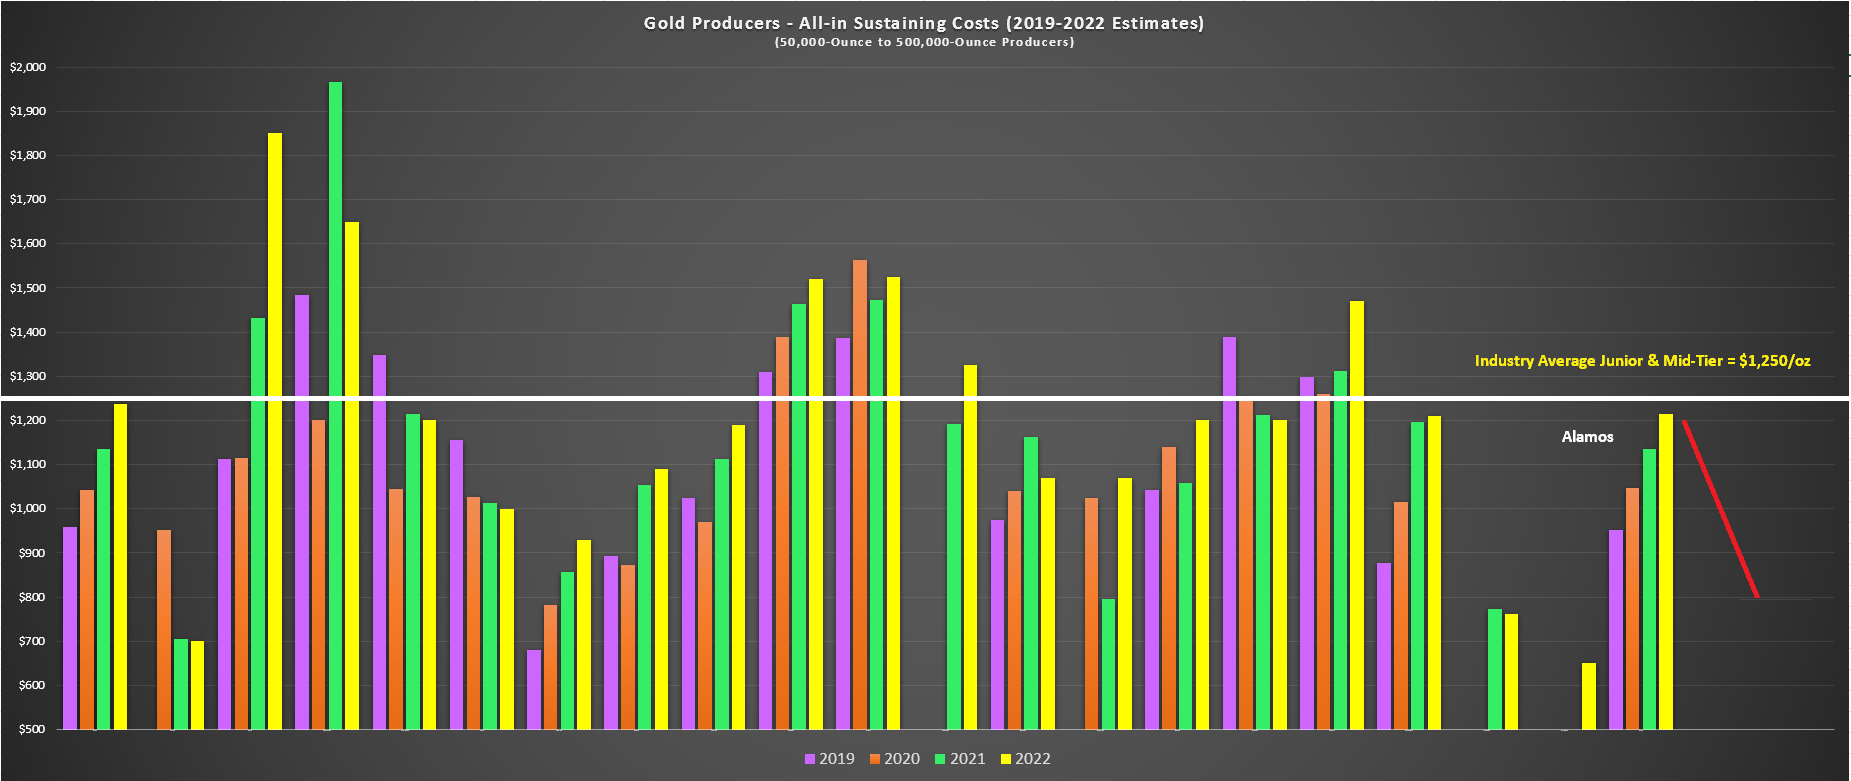
From a bigger picture standpoint, next year’s margin expansion will be a mere blip relative to the potential provided by its Island Phase 3+ Project. The reason is that all-in sustaining costs should decline below $850/oz on a consolidated basis post-2025, translating to another $200/oz in margin expansion. So, assuming a 3% annual increase in the gold price, which is below its historical average, we could see Alamos’ AISC margins increase from ~$605/oz in FY2022 to $1,180/oz between now and FY2026. This places Alamos in rare air among its peers, with ~30% production growth vs. FY2022 levels with a simultaneous 30% cost decline. For those unfamiliar, Island Phase 3+ will be operational in 2026, doubling production at all-in sustaining costs below $600/oz over the mine life.
Island Current vs. Island P3+ vs. Canadian Mines (Company Presentation)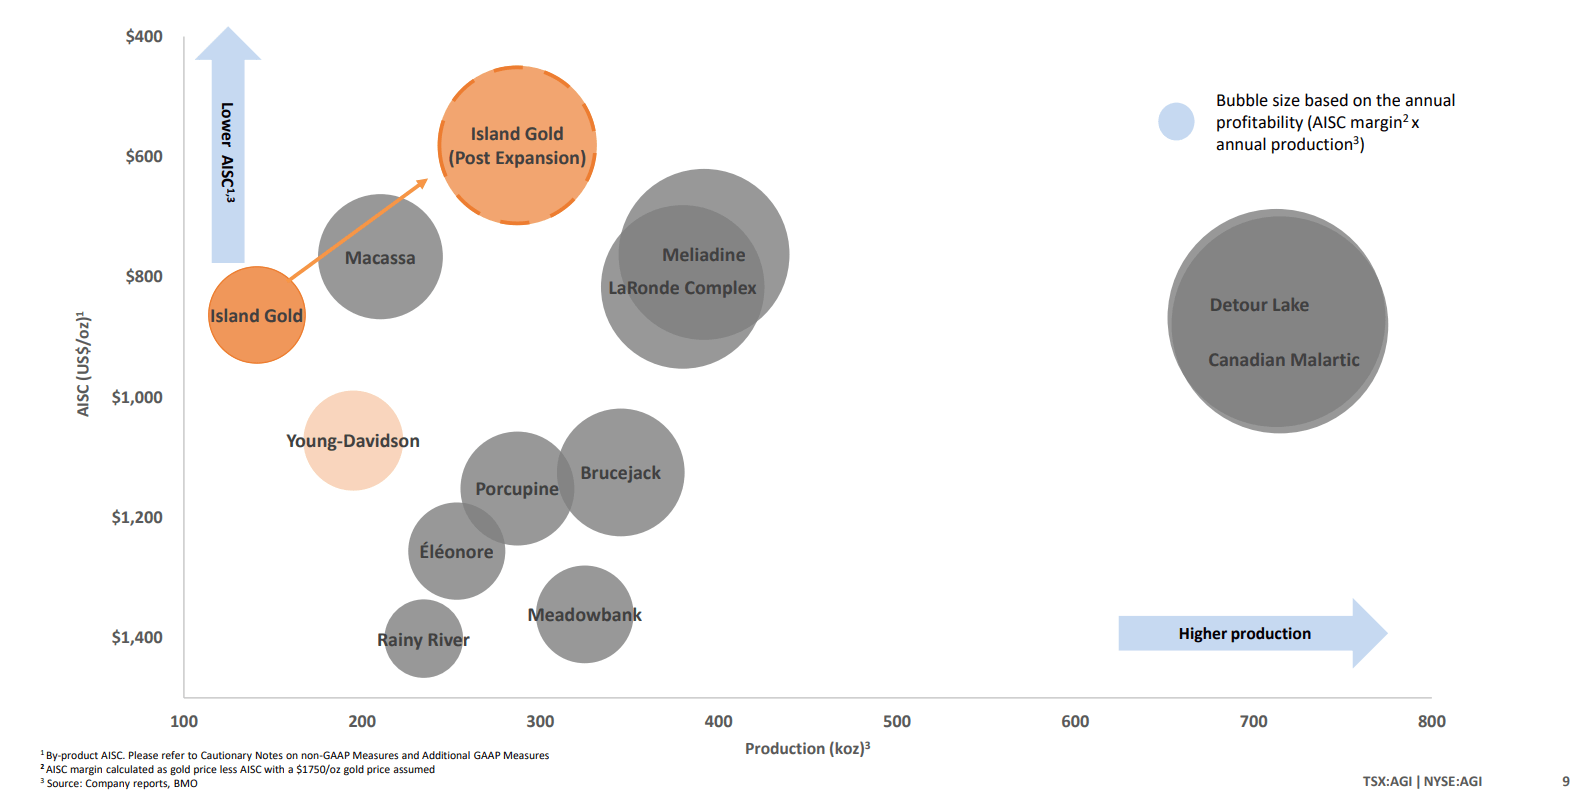
The above margin outlook ($1,180/oz vs. $605/oz) assumes a gold price of $1,820/oz in FY2022 and $2,025/oz in 2026, which I do not believe to be a stretch in the slightest. Notably, at this gold price, the After-Tax NPV (5%) for Island Gold would increase to ~$2.4 billion, making up more than 80% of its current enterprise value, assuming no further reserve growth. So, with investors getting most of Young-Davidson, Mulatos, and Lynn Lake for free, given that Island can easily be valued at 1.0x NPV (5%) as Canada’s lowest-cost mine post-2025, Alamos trades at a dirt-cheap valuation.
Before moving on to the financial results, it’s worth pointing out that this is fully-funded growth at an existing mine with a team with a track record of over-delivering on promises. This means an extremely low likelihood of a cost blowout, no financing risk, or financial hurdles to funding the expansion (Alamos generates over $200 million in annual mine-site free cash flow from Young-Davidson/Mulatos), and no issues from a permitting standpoint. In fact, Alamos has one of the strongest balance sheets industry-wide heading into this period, sitting on $120+ million in net cash and $600+ million in liquidity.
Financial Results
Given the solid operational performance combined with a higher gold price, Alamos had a strong quarter financially. This was evidenced by revenue of $191.2 million despite being in the weaker portion of the year and a return to free cash flow generation ($6.8 million). While trailing twelve-month free cash flow is still in negative territory, I would expect the company to generate close to $40 million in free cash flow this year despite the significant expansionary capital at its Island Gold Mine (Phase 3+ Expansion). Looking ahead to FY2023, Alamos should see a meaningful increase in free cash flow even if we see lower gold prices, benefiting from higher production and margins (~495,000 ounces at sub $1,050/oz costs).
Alamos Gold – Quarterly Free Cash Flow & Trailing-Twelve-Month Free Cash Flow (Company Filings, Author’s Chart)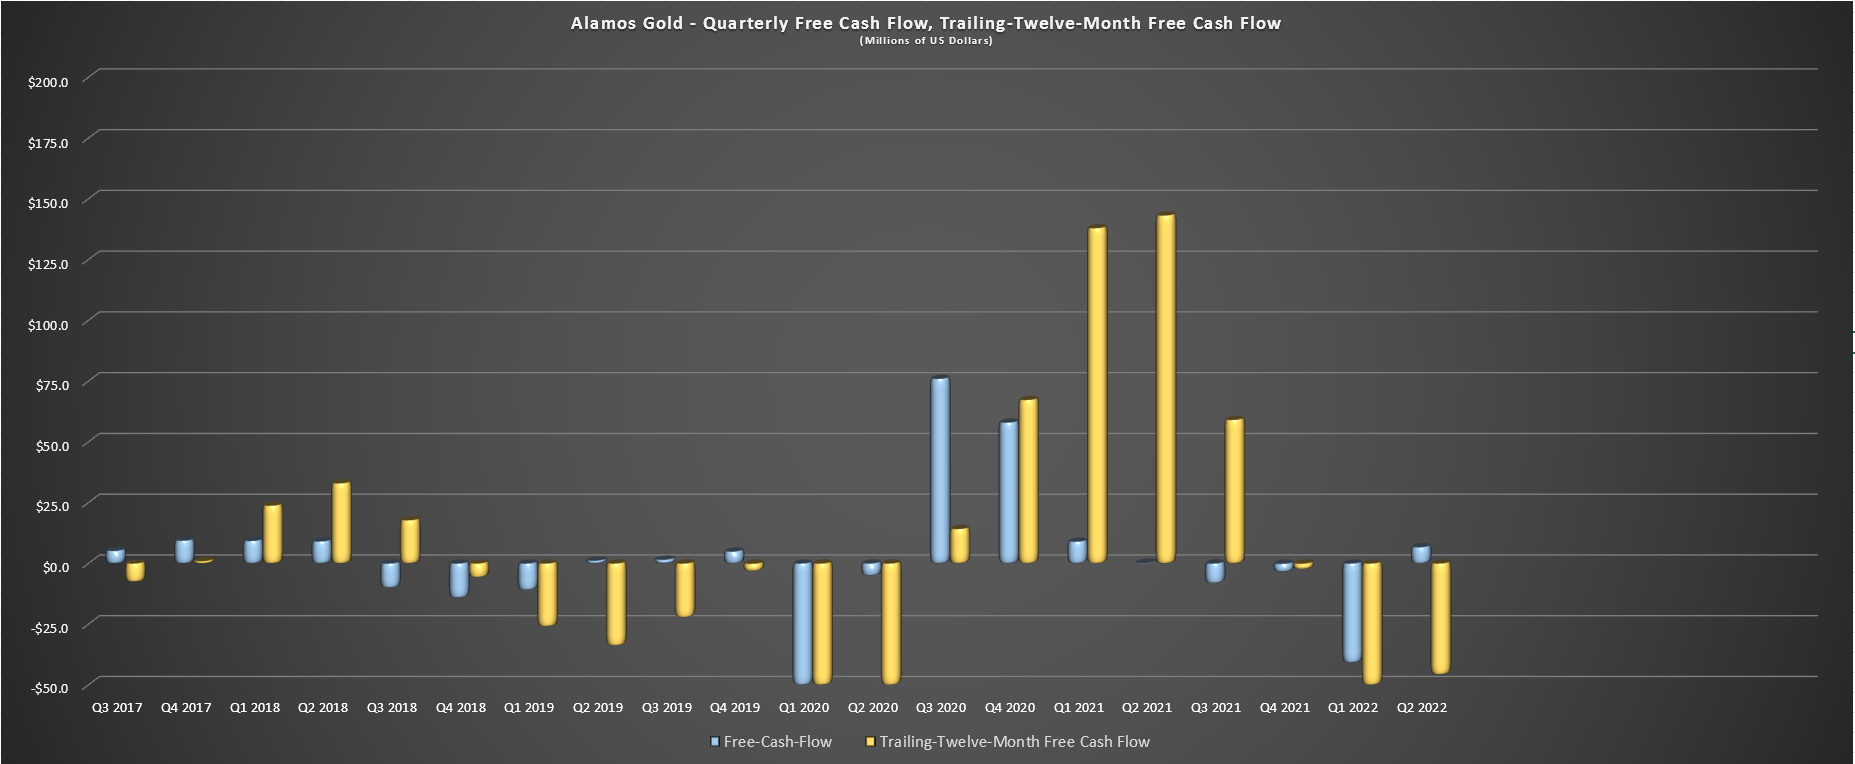
At first glance, investors might conclude that Alamos is expensively valued, trading at a low single-digit free cash flow yield. However, it’s important to note that this is solely due to the significant investment it’s making to transform Island Gold into one of the largest and lowest-cost gold mines globally. This is expected to pay off massively, with $260 million of average annual mine-site free cash flow at a $1,850/oz gold price, pushing total mine-site free cash flow generation north of $500 million in 2026. Besides, this values Lynn Lake at zero, a robust development project in Manitoba capable of producing 170,000 ounces per annum from 2027-2037.
Based on this outlook, the best way to value Alamos is from a P/NAV standpoint vs. trying to use trailing metrics that give zero value to the expansion it’s set to begin spending heavily on and its development project in the wings. Usually, I don’t like using forward metrics for the sector, given that this is a sector where several companies are notorious for being undisciplined and massively over-promising and under-delivering. However, as the metrics show below, Alamos has done a phenomenal job in every category and continues to grow reserves on a per share basis, giving strong visibility into long-term production at all its assets.
Alamos Gold – Key Metrics (Company Presentation)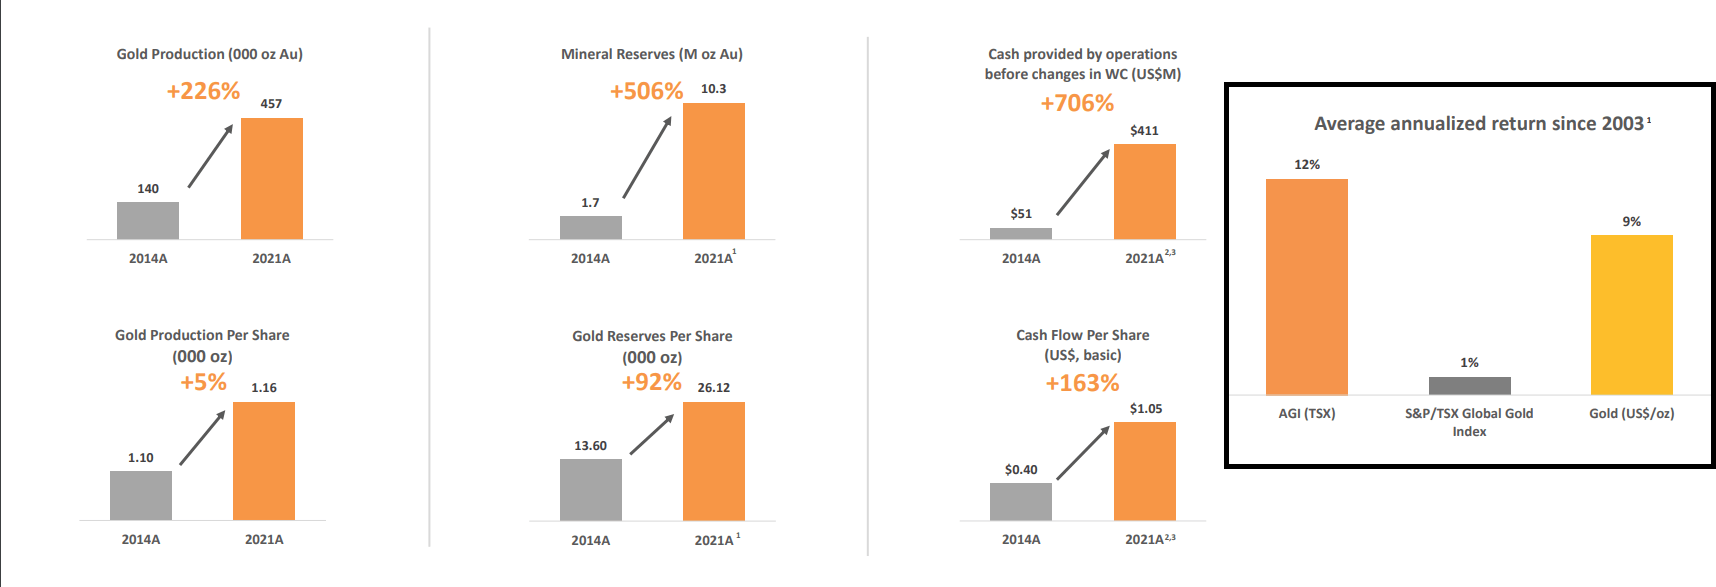
Given that it can fund Phase 3+ and Lynn Lake with no dilution and is buying back shares (~1.1 million shares repurchased in Q2), the gold production per share figure is set to soar in 2027 as the share count is flat to down and production increases to 750,000+ ounces per annum. This is a crucial metric for investors in the sector to watch because if a company is not growing or maintaining production per share, it’s often better just to hold the metal itself. The proof is in the pudding (above chart), with Alamos being one of the few companies to outperform the price of gold and the Gold Miners Index by a wide margin (12% annualized). In comparison, the group has seen lifeless performance since 2003 relative to gold (1% annualized return vs. 9%).
Technical Picture
Moving to the technical picture, Alamos also stands out among its peers, giving up ground grudgingly over the past four months. The Gold Miners Index has been pulverized on a relative basis, declining more than 35% from its April highs. In fact, while the index is just 6% off its lows, Alamos is 17% off its lows, suggesting it must be under accumulation. This is certainly supported by the technical picture, with Alamos being of the few companies that will enjoy a ~$350/oz improvement in costs between now and 2026 and a near exponential rise in free cash flow. At the same time, the average producer will struggle to hold the line on margins.
AGI Monthly Chart (TC2000.com)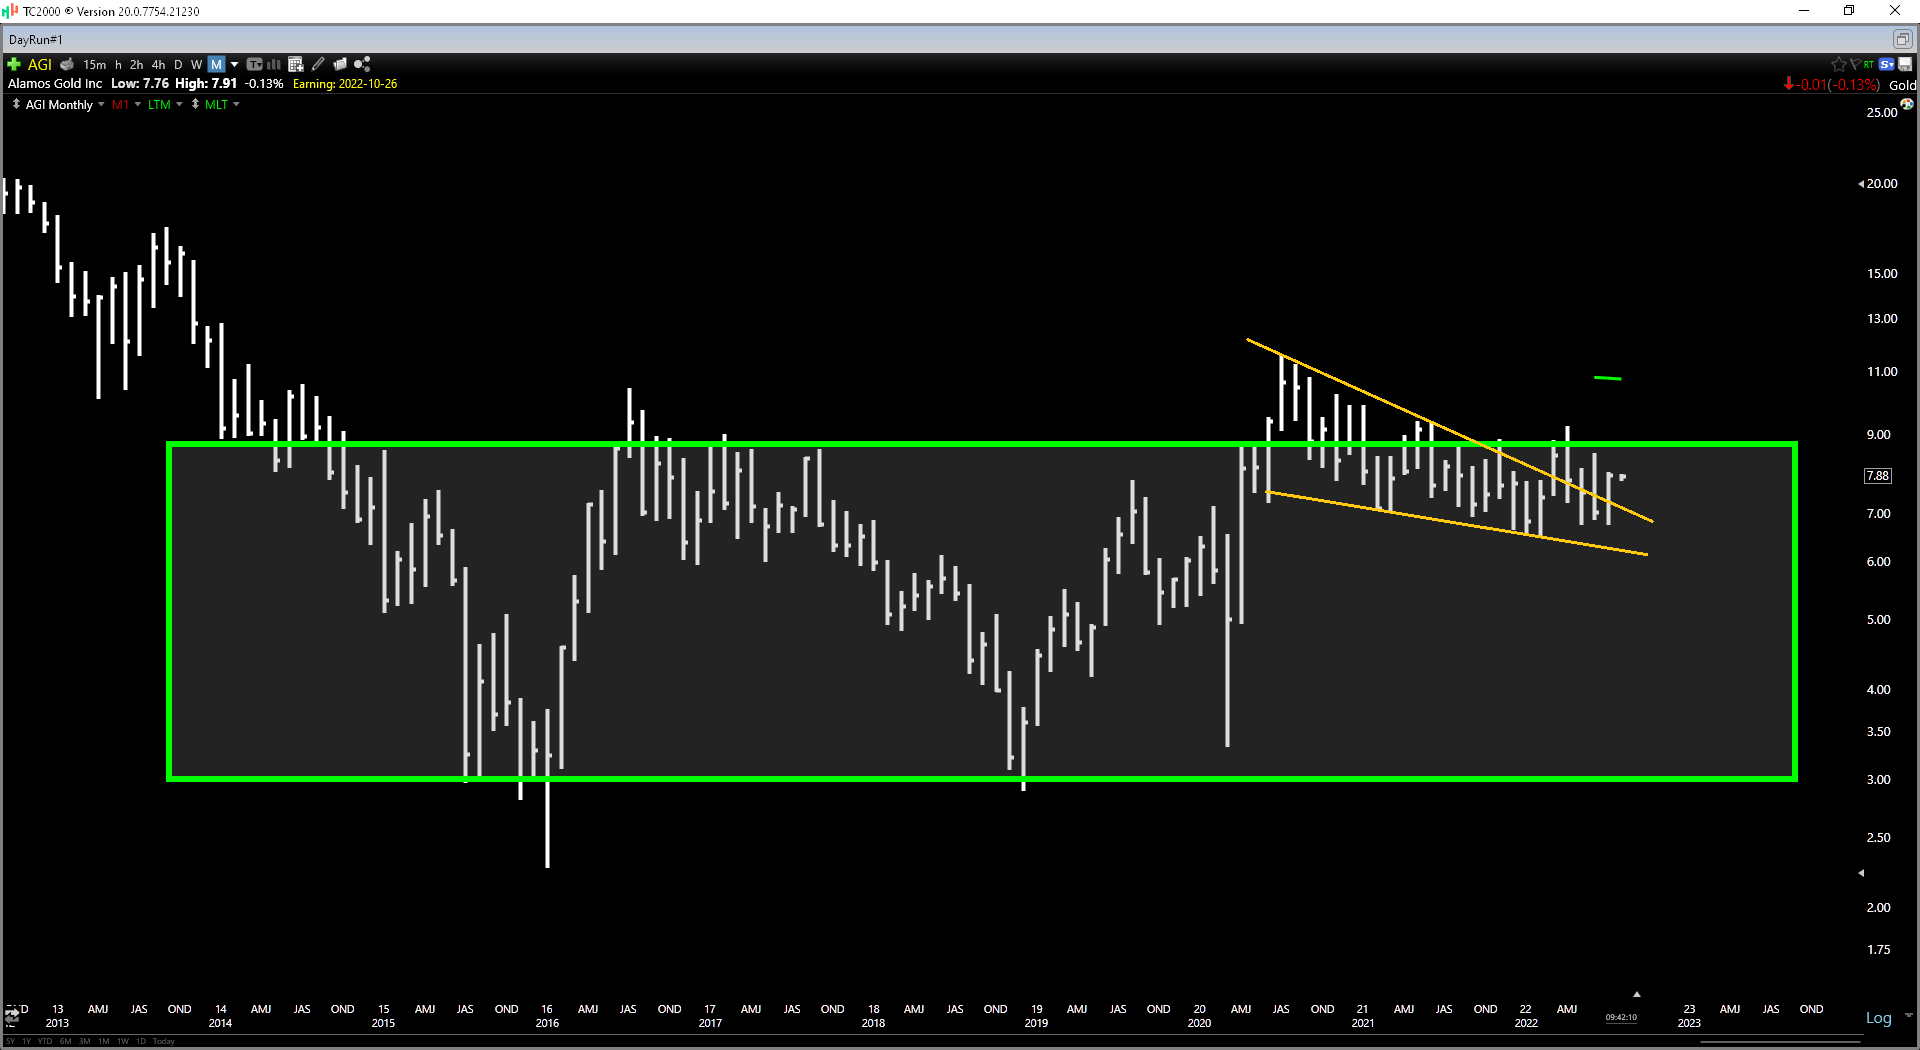
Taking a closer look at the chart below, we can see that Alamos looks to be building a loose definition of a base-on-base pattern. This pattern typically develops in industry leaders when the sector or index is in a bear market. It is a bullish pattern because while the sector makes lower lows and new resistance levels are built overhead, the leader trades near the top of its prior base, leaving much less resistance above it. The result is that when the weight comes off the sector and it finally bottoms, the leader (what appears to be Alamos in this case) is like a beachball underwater, allowed to surge higher given that it has minimal resistance overhead.
K92 Mining – Monthly Chart (2016-2019) (TC200.com)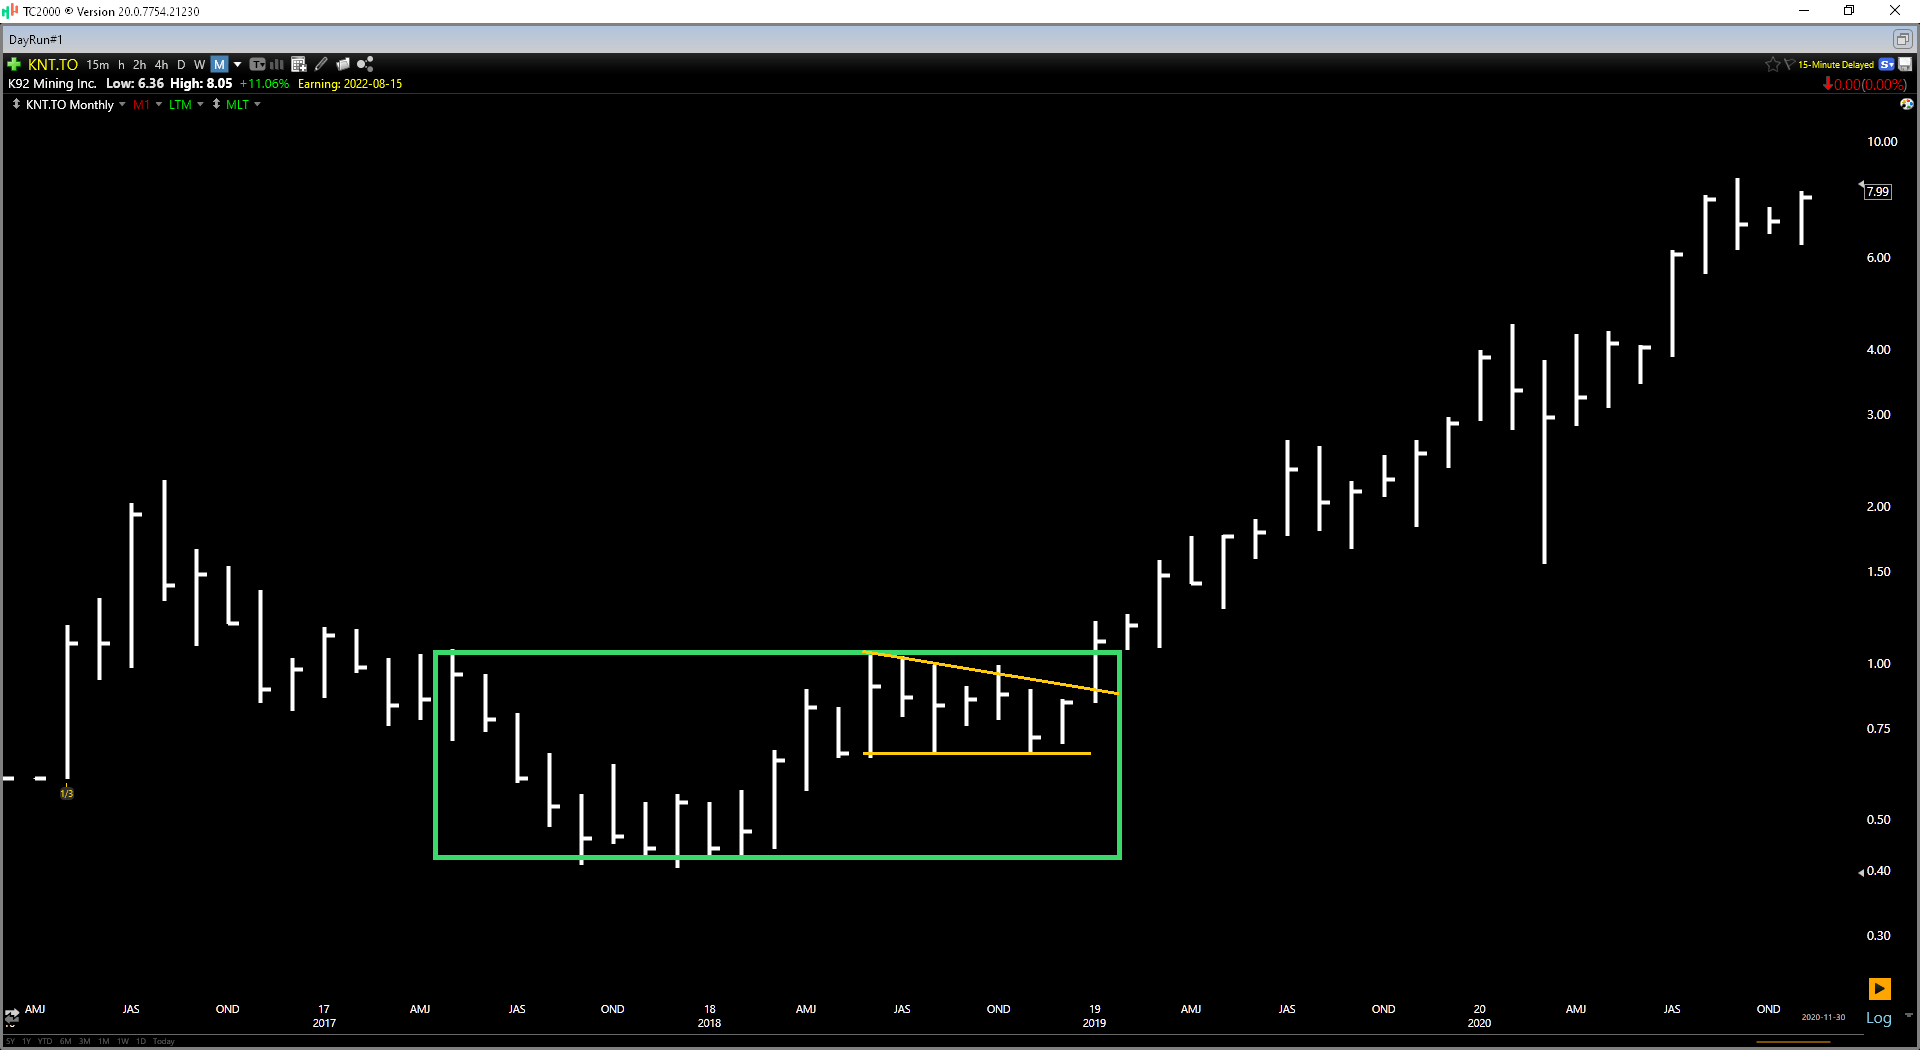
Obviously, history doesn’t have to repeat itself, and every situation is different. However, this is somewhat similar to how K92 Mining (OTCQX:KNTNF) was set up in the second half of 2018, during a similar violent cyclical bear market in the GDX. Following the end of this correction in the GDX, K92 Mining was the leader by a wide margin coming out of the bear market, tripling in price over the following 12 months. Given the market cap differences, I would not expect a repeat of this performance from Alamos Gold. Still, this extreme relative strength is a positive development and suggests that Alamos is a must-own name for investors seeking exposure to the precious metals sector.
Island Gold Mineralization (Company Presentation)
Summary
Alamos Gold had a solid Q2 performance and is one of the few companies so far that has maintained its cost guidance, helped by bringing its high-margin YLG Project online ahead of schedule. While the company’s operating costs may appear high in Q2, these are ahead of the industry average for FY2022 (estimates: ~$1,230/oz), and costs will drop significantly next year, with further improvement as Island Phase 3+ is completed. Given Alamos’ unique position of being somewhat insulated from inflationary pressures (high-margin YLG online and high-grade underground operations), its organic growth profile, and its dirt-cheap valuation, I see the stock as a Buy below $7.90 per share.
Be the first to comment