


cemagraphics
It’s been a long 55 months since I recommended investors avoid Akamai Technologies Inc. (NASDAQ:AKAM), and in that time, the shares are up about 22% against a gain of 36% for the S&P 500. Much has happened at the firm since, obviously, so I thought I’d revisit the name to see if it makes sense to buy the shares or not at the moment. Although they’re up since I wrote about them over four years ago, shareholders have had a bad time of it in 2022, with the shares down about 33% over the past six months. Obviously shares that are trading at $81 represent a less risky investment than the same shares when they’re trading at $120, obviously. I’ll try to work out whether or not it makes sense to buy by looking at the most recent financial performance. In particular, in my previous missive on Akamai, I complained about the buyback activity. I feel like writing about the buyback activity, so I’ll write about the buyback activity. In addition to this financial review, I want to look at the valuation, because, as my readers know by now, a great company can be a terrible investment at the wrong price.
My regulars know that we’ve come to the part of the article that I like to call “the thesis statement.” It’s here where I offer up the gist of my thinking in a short, hopefully pithy paragraph. I do this so you won’t have to wade through the entire article, and thus this paragraph may save you from excessive eye rolling and feelings of nausea. Anyway, I think the financial performance this year has been “middling.” Although sales and profitability are up nicely relative to the pre-pandemic period, there’s a strong disconnect between them when we compare 2021 to 2022. Net income actually fell in 2022 in spite of a decent uptick in revenue compared to this time last year. Additionally, the drivers for reduced profitability were (and will be) ongoing, so we can’t blame this on a series of one offs. More troubling still in my view is the fairly massive deterioration of the capital structure. Most troubling is the excessive buyback activity this year. While it’s impossible to perform a “to the penny” analysis of the price at which the company retired stock, I’m satisfied that that price was “excessive.” Although the shares are cheap according to simple valuation ratios, they’re still fairly optimistically priced, and I consider this to be inappropriate, especially against the backdrop of a market that’s, shall we say “having a moment.” I’ll put Akamai near the top of my watch list, as I’m intrigued by it in some ways, but I can’t pull the trigger at current prices.
Akamai Technologies Financial Snapshot
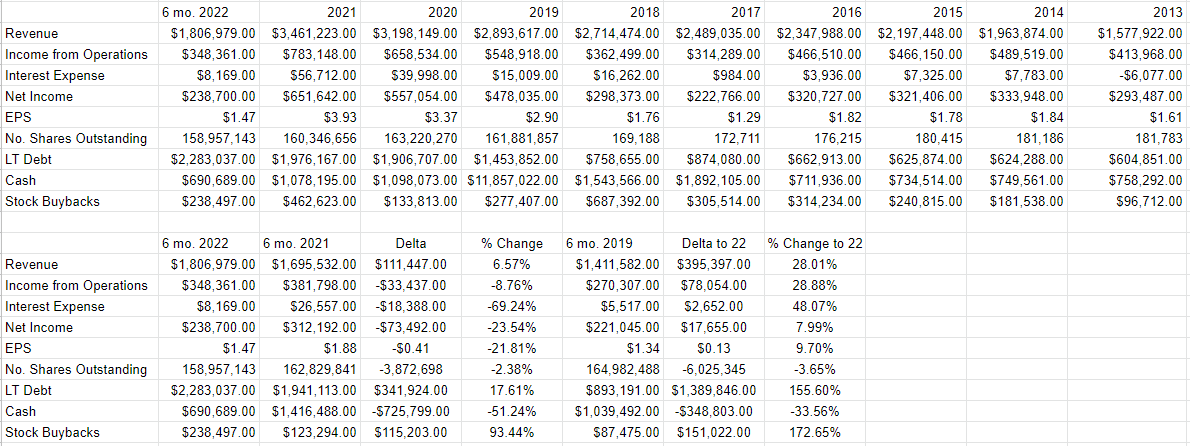
The most recent financial performance here was simultaneously good and bad in my view. It was good because revenue grew nicely between the first six months of 2021 and the most recent period. Specifically, sales were up by just under 7% from the year ago period. At the same time, though, net income was down by $73.4 million or 23.5% from this time last year. This was obviously the consequence of significant cost increases, most notably R&D (up 20.5%), Sales and Marketing (up 9.25%), G&A (up 8.7%), and $12.7 million restructuring charge. That said, the income statement looks much better recently relative to the period just before the pandemic. Revenue for the first six months of 2022 was 28% higher, and net income was up by 8%.
More significant, in my view, is the deterioration in the capital structure. Specifically, long term debt has increased by just under $342 million, while cash and marketable securities is off by $725.8 million relative to the same period last year. This increase in debt is particularly galling in light of the buyback activity, which, spoiler alert, I consider to have been a colossal waste of shareholder capital.
Buyback Activity
Before getting into the specifics of the buyback activity, I want to set the stage by putting the activity in the broader context of the company’s cash and liquidity needs. On page 38 of the latest 10-K, the company states “To date, we have financed our operations primarily through public and private sales of debt and equity securities and cash generated by operations. As of December 31, 2021, our cash, cash equivalents, and marketable securities, which primarily consisted of corporate bonds and U.S. government agency obligations, totaled $2.2 billion. Factoring in our outstanding convertible senior notes of $2.3 billion, our net cash as December 31, 2021 was in a negative position of $133.8 million.”
This negative net cash position is relevant, because in December 2021, the company elected to settle the principal amount of the 2027 Convertible Notes in cash. This decision may have made some sense in December of last year when the shares were trading very near the initial conversion price of $116. It seems that things didn’t work out well on that front, though, now that shares are trading well below the conversion price. I can’t blame the company for not having a crystal ball late last year, though. The point is that the company is going to pay off the debt with cash in 2027, and as of December it was about $134 million light. The situation has deteriorated since, with cash and marketable securities down by ~$726 million, and long term debt higher by about $342 million.
While I normally look at contractual obligations against cash when reviewing dividend sustainability, it’s useful in this case, so I plucked it off page 39 of the latest 10-K and present it below for your enjoyment and edification.
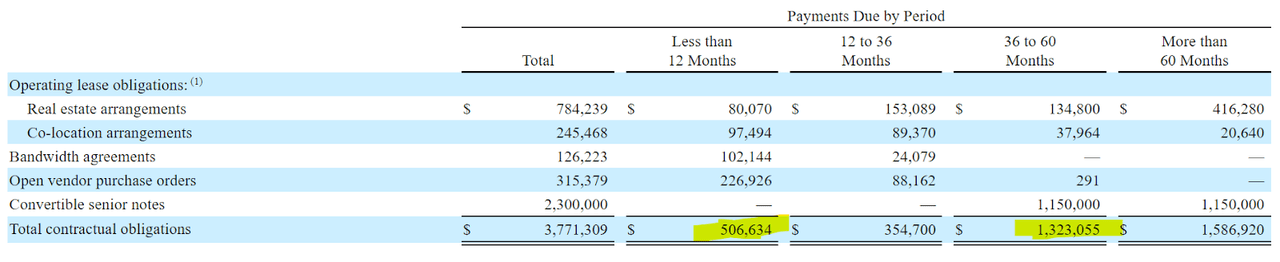
Akamai Obligations (Latest 10-K)
Given the above, I think it fair to suggest that cash is at a premium, and prudent management would try to preserve it as much as possible. With all of that out of the way, it’s time to write about buybacks.
The timing doesn’t line up perfectly because the 10-K reports shares outstanding late February, and the 10-Qs report that number by calendar quarter, but I think we can make some general inferences about the approximate price at which this company is buying back stock. Here’s what we know from the latest two 10-Qs and 10-K.
-
On February 22, there were 160,346,656 shares outstanding.
-
On August 5, there were 158.957,142 shares outstanding.
-
Between January 1 and June 30, the company spent approximately $238,497,000 on buybacks.
To simplify the exercise and account for the disconnect between “shares outstanding” timing and “money spent on buybacks” timing, I’m going to break these figures into “per day” amounts. Although this is an imprecise exercise, I think it offers some insight and gives us an understanding of what the company did with $238.5 million of owner wealth this year.
By my count, there were 115 trading days between February 22 and August 5 this year. Using the skills not so lovingly imparted to me by the good people at Holy Spirit School several decades ago, I’ve determined that the company retired an average of 12,083 shares per day. By my count, there were 125 trading days between January 1st and June 30th. Applying the same skills as above, I determine that the company spent $1,907,976 per day to retire shares over these 125 trading days. That works out to an extraordinary price of $157.91 per share. I’ll give the company the benefit of the doubt and assume that they didn’t retire shares on days when the price was relatively high. Even with that assumption, I think it’s reasonable to suggest that $239m is an egregious use of owner capital, especially when the company remains in a significant cash shortfall in regard to its convertible note.
I’ll admit that this analysis is imprecise, and that’s a consequence of FASB rules more than any desire on my part. I’m sure I’ll read your thoughts on my methodology below, and I’m willing to change my mind, but as of now I think the buyback this year was a waste.
All that written, in some sense, the capital wasted on the buyback is someone else’s problem, because I wasn’t a shareholder when it happened. For that reason, I’d be willing to consider buying this fast grower at the right price.
Akamai Financials (Akamai investor relations)
The Stock
If you subject yourself to my stuff regularly, you know that I think the stock is distinct from the business in many ways. A business buys a number of inputs, adds value to them, and then sells the results for a profit. The stock, on the other hand, is a traded instrument that reflects the crowd’s aggregate belief about the long-term prospects for a given company, and it’s buffeted by a number of forces that may have little to do with the underlying business. For instance, a fashionable analyst may offer an opinion about a significant customer, and that drives the stock up or down. The crowd may form a view about the relative attractiveness of stocks in general, and that drives shares up or down. The stock of a given company may be affected by narratives about currencies, and the shares of a given company get taken along for the ride. Strangest of all, stock investors can be mesmerized by the pronouncements of Fed officials, who drive prices up or down massively because of a 75 basis point difference in the overnight rate. Anyway, every company is impacted by things like the relative changes of one currency or another, but you’d be forgiven for thinking the shares often “overreact.”
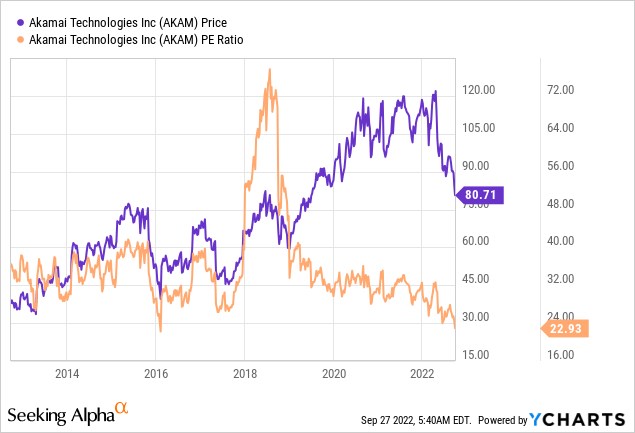
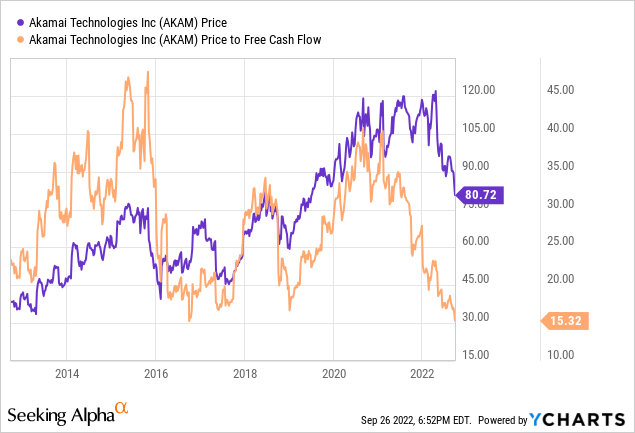
Although it’s tedious to see your favorite investment get buffeted around for reasons having little to do with the health of the business, within this tedium lies opportunity. If we can spot discrepancies between the price the crowd dropped the shares to, and likely future results, we’ll do well over time. It’s typically the case that the lower the price paid for a given stock, the greater the investor’s future returns. In order to buy at these cheap prices, you need to buy when the crowd is feeling particularly down in the dumps about a given name. As my regulars know, when judging the cheapness (or not) of a stock, I like to look at the ratio of price to some measure of economic value, like earnings, sales, free cash, and the like. Because I think “cheaper wins”, I want to see a company trading at a discount to both the overall market, and the company’s own history. Way back in February of 2018, I avoided these shares because they were trading at a PE of about 52, and a price to free cash flow of 28.6. Fast forward to the present and things look much better on those bases, and investors are paying near record lows for $1 of sales, per the following:
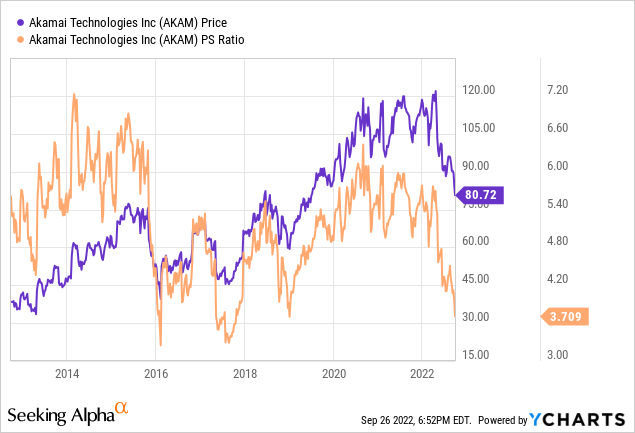
If you know I like cheap stocks, you also know that I want to try to understand what the market is currently “assuming” about the future of a given company. If you read me regularly, you know that I rely on the work of Professor Stephen Penman and his book “Accounting for Value” for this. In this book, Penman walks investors through how they can apply some pretty basic math to a standard finance formula in order to work out what the market is “thinking” about a given company’s future growth. This involves isolating the “g” (growth) variable in this formula. In case you find Penman’s writing a bit dense, you might want to try “Expectations Investing” by Mauboussin and Rappaport. These two have also introduced the idea of using stock price itself as a source of information, and then infer what the market is currently “expecting” about the future.
Anyway, applying this approach to Akamai at the moment suggests the market is assuming that this company will grow earnings at a rate of ~5.5% in perpetuity, which I consider to be fairly optimistic, actually. For that reason, I won’t be buying any Akamai at the moment, but I’m putting the stock very close to the top of my watch list.
Be the first to comment