


ipopba
Investment Summary
Following our last publication on Agiliti, Inc. (NYSE:AGTI) we’d advise there’s been minimal statistical change within the investment debate. In that report, where we rated AGTI a hold, there were a number of talking points for observation. To name a few:
- Compression in stock price in first ~18months since IPO, following challenges in its Health and Human Services agreement (“HHS”) and diminishing Covid-19 tailwinds.
- This was estimated to have a $10–$15mm adjustment to revenue from last year.
- Sizewise acquisition and integration moving along reasonably well with $38mm/$0.02 per share in revenue for Q2 FY22.
- Shares looked fairly priced at 18x forward earnings, price target at the time of $18.54 [price at publication of $17.24].
As we turn to the present day, we rigorously examined AGTI again to potentially revise our position on the stock. Here I’ll present the latest findings for AGTI. It’s worth noting that the majority of AGTI’s revenue and EPS upsides since listing ~18 months ago has arrived as a function of Covid-19 tailwinds and its HHS agreements. With both of these diminishing, this reduces the predictability of future cash flows, and, therefore, AGTI’s corporate value. Net-net, we continue to rate AGTI a hold, observing similar headwinds to share price appreciation down the line.
Q3 results a step up, but headwinds remain
First turning to AGTI’s Q3 financial results, it pulled a revenue clip of $271mm, a 300bps YoY increase. It’s important to make an apples-for-apples comparison and exclude the COVID-related boost from Q3 2021. After doing this, we note that AGTI’s YoY revenue growth was between 6% and 7%, on adjusted EBITDA of $66.5mm. It pulled this down to adjusted earnings per share of $0.19, compared to $0.23 this time last year. You can see the impact of the major headwinds to AGTI’s top-line growth [HHS agreement, Covid-19 windbacks] in Exhibit 1.
Since January 2022, revenue growth has pulled lower, along with core EBITDA growth and the level of recorded free cash flow (“FCF”). Still, investors can purchase the AGTI on a trailing FCF yield of ~400–500bps, which is worth taking note of.
Exhibit 1. Impacts from revenue headwinds clearly seen from January 2022. Yet, investors can still buy AGTI on a 400–500bps trailing FCF yield.
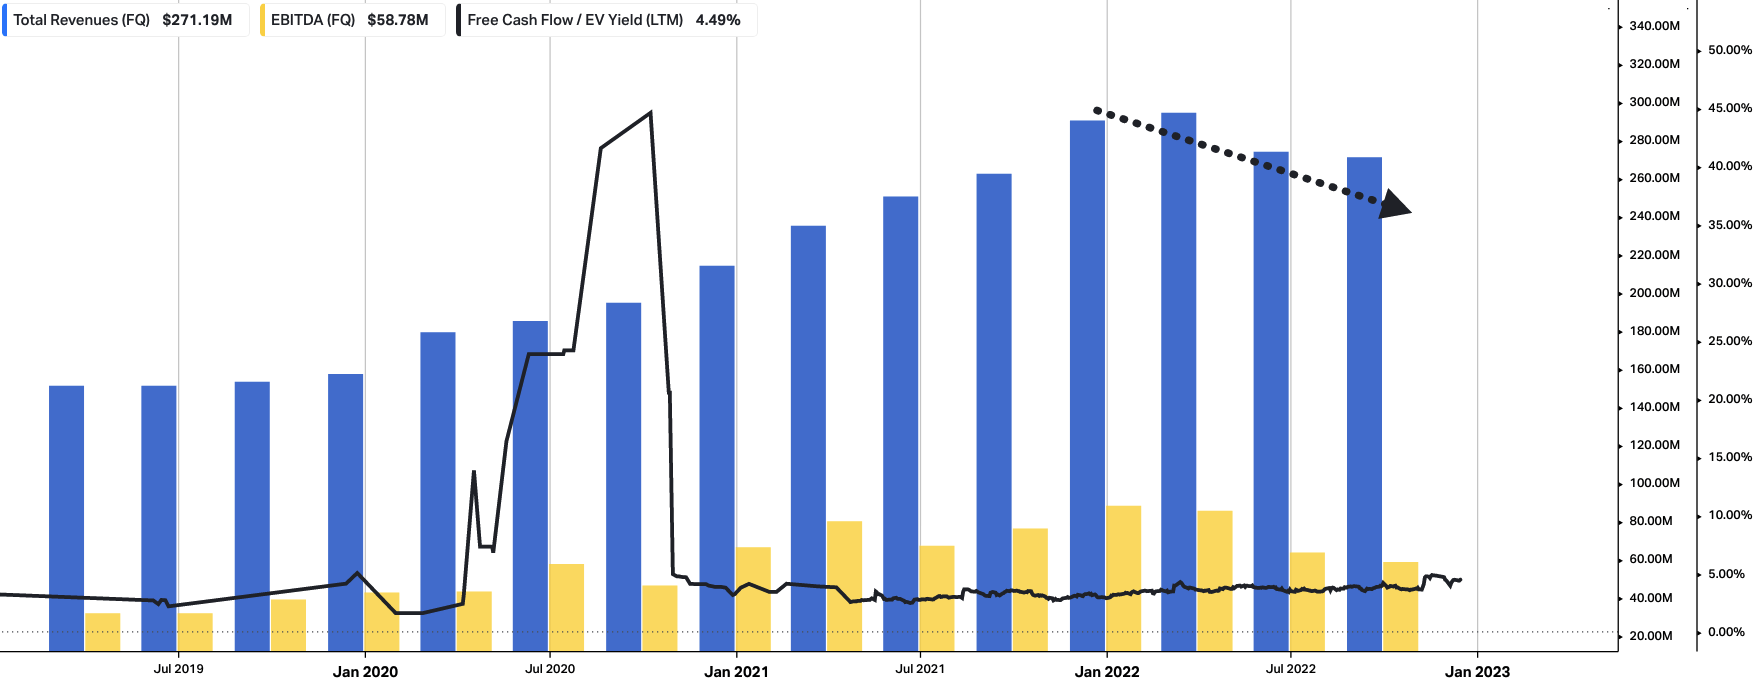
Data: HBI, Refinitiv Eikon, Koyfin
During the quarter, utilization for the company’s peak-demand rental devices treaded lower, though it appeared to have stabilized at a level slightly below pre-pandemic levels. Management expects to see a seasonal increase in utilization in the latter half of the fourth quarter and into Q1 FY23′.
As mentioned, the company recognized a $0.04 per share downside in EPS from Q3 FY21. This decrease was due to a slight drop in adjusted net income and an increase in the effective interest rate on our debt.
Moving to the divisional highlights, our main data points are as follows:
- In terms of clinical engineering, we saw that Q3 revenue was $104mm, representing a 700bps YoY decline.
- Revenue from the HHS agreement was lower YoY as the work shifted back to pre-pandemic maintenance and management activities, rather than being driven by COVID deployment and in-market support for medical devices.
- We’d also note that on-site managed services revenue totaled $64mm, a 12% YoY decline for the quarter. This decrease was primarily due to the revised pricing and scope of the HHS agreement mentioned above, and therefore was expected.
Finally, shifting to the balance sheet, there were several additional takeouts worth discussing. AGTI ended Q3 with net debt of $1.04 billion, comprising $1.07 billion in debt and $32mm in cash on hand. The company’s CFFO for the YTD to September 2022 amounted to $162mm.
These movements of cash flow brought the company’s leverage to ratio of 3.3x for Q3. It’s also worth noting that by the end of Q3 FY22 AGTI had retired over $120mm in debt obligations using cash on the balance sheet. As a result of these capital budgeting initiatives, the interest payment reduced by ~$3mm annually.
Guidance revision points to additional growth challenges
Management also downgraded guidance from previous estimates on the Q3 earnings call [Exhibit 2, taken from AGTI’s Q3 presentation].
It now projects full year revenue in the range of $1.11 billion–$1.12 billion in adjusted EBITDA between $290mm–$300mm. It expects to collect adjusted earnings per share in the range of $0.83 to $0.88 for the year.
Each of these down-steps in FY22 guidance represents a meaningful reduction in top–bottom line growth. This presents as a downside risk in the investment debate by estimation.
Exhibit 2. AGTI’s revised FY22 earnings guidance [revised down]
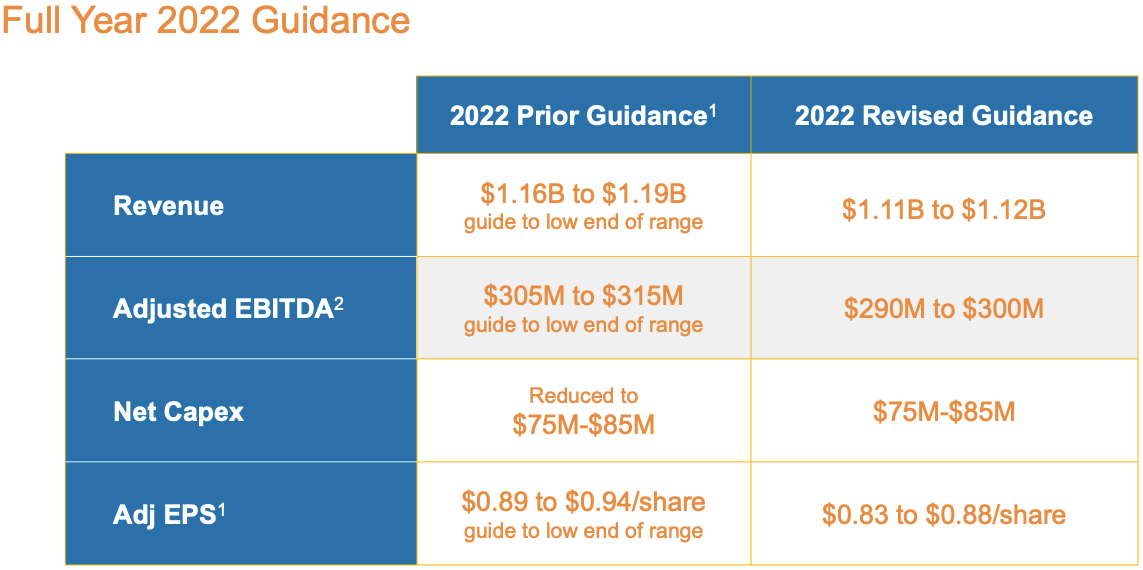
Data: AGTI Q3 FY22 investor presentation
These are reasonable growth assumptions and we are aligned with the company in its reduced guidance. With respect to GAAP estimates, you can see our forward EPS assumptions for the company in the chart below.
Exhibit 3. AGITI FY22–FY24′ EPS growth assumptions [internal estimates, quarterly and annual]
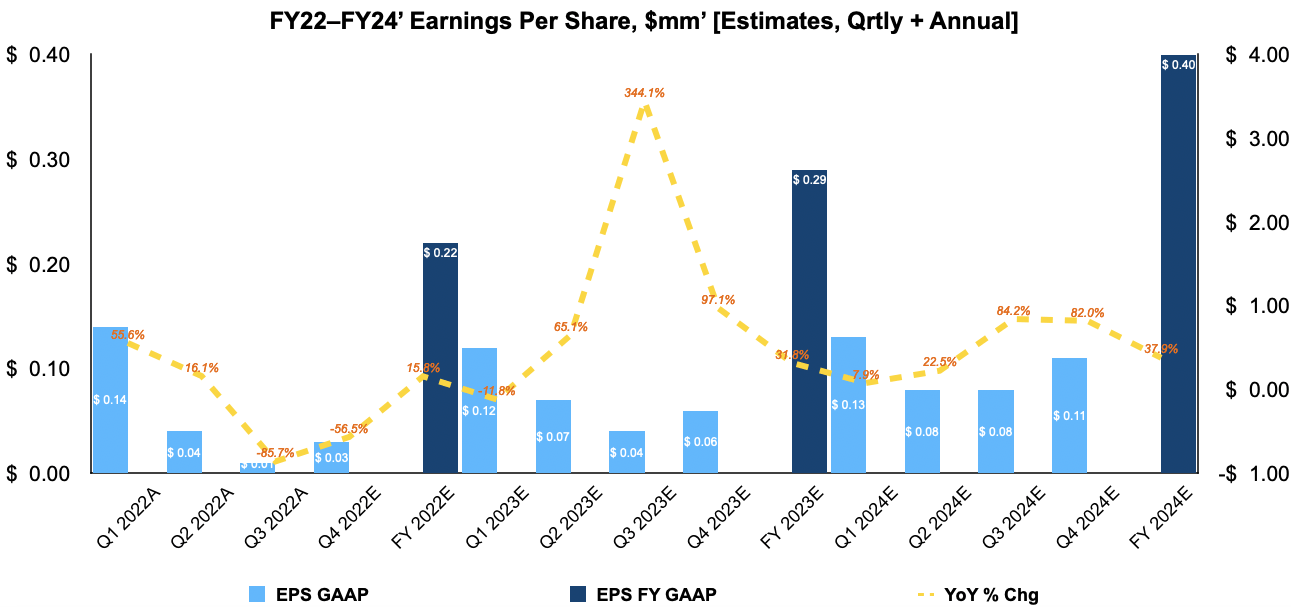
Data: HBI Estimates
Valuation and conclusion
We’ve been looking at market and fundamental data to guide price visibility in the broad healthcare domain in FY22.
Looking at the point and figure analysis below, you’ll see we have multiple downside targets yet to be activated, the latest being $10.40. However, there’s also targets as low as $6.30. With a lack of tangible upside, this confirms our neutral thesis.
Exhibit 4. Downside targets to $10.40, $6.30
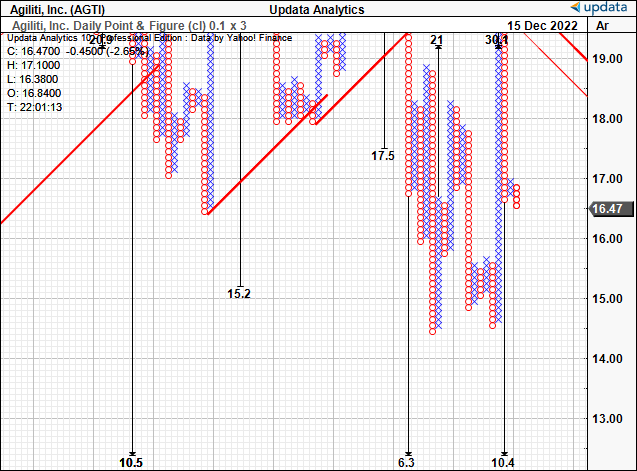
Data: Updata
In addition, rolling our FY22 EPS estimates forward, we see the stock priced fairly at a lofty ~63x forward earnings. However, the EPS downside forecasted for FY22 is a downside factor that can’t be ignored. Even at this high multiple, it would appear the stock is more than fairly valued at its current market price on a valuation of $13.95 [63.34 x $0.22].
Exhibit 5. FY22 price target estimate = $13.95.
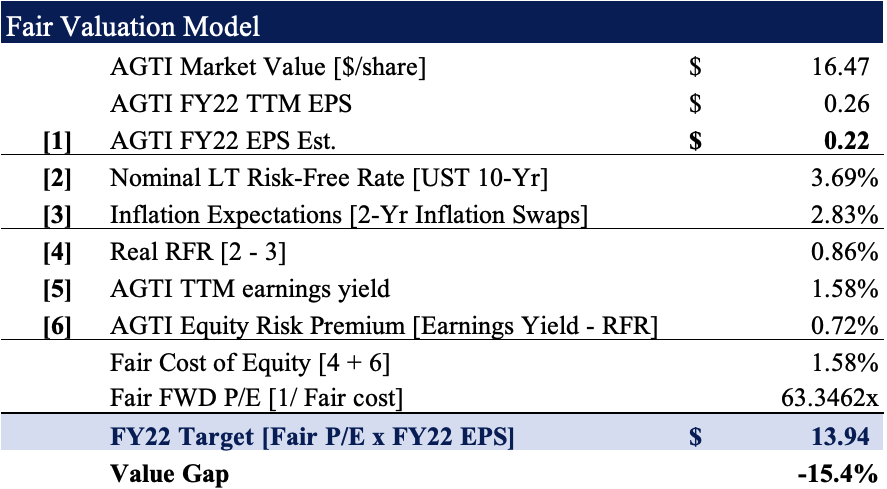
Note: Fair forward price-earnings multiple calculated as 1/fair cost of equity. This is known as the ‘steady state’ P/E. For more and literature see: [M. Mauboussin, D. Callahan, (2014): What Does a Price-Earnings Multiple Mean?; An Analytical Bridge between P/Es and Solid Economics, Credit Suisse Global Financial Strategies, January 29 2014]. (Data: HBI Estimates)
Net-net, we continue to see overhang for AGTI in unison with findings from our last publication. In other words, the market looks yet to have priced these in, and they remain a compressor to the AGTI share price looking ahead. We also see downside targets and believe there are more selective opportunities elsewhere at this point in time. Rate hold.
Be the first to comment