

Torsten Asmus/iStock via Getty Images
Thesis
We use the following dashboard to get a feeling of the pulse of the overall market. Details of the dashboard are in our earlier articles and feel free to export/download via the following link: Market Sector Dashboard. The key observation is that as the risk-free rates surge, equity valuation is under tremendous pressure. As you can see, all major market sectors now feature a negative yield Z-score against the 10-year treasury rates as of this writing. Traditional safe haven such as utility now actually is the most overvalued sector in terms of the yield spread.
At the same time, we see bond rates approaching their long-term targets and bonds becoming more attractive. And this article will detail our thoughts on two bond ETFs and illustrate our bond allocation strategy: one intermediate-term bond ETF and one long-term bond ETF, represented by the iShares Core U.S. Aggregate Bond ETF (NYSEARCA:AGG) and iShares 20+ Year Treasury Bond ETF (NASDAQ:TLT), respectively. The allocation of bonds is also a frequent Q&A topic in our Envision Early Retirement Marketplace. And AGG and TLT provide good case studies to elaborate on our selection and allocation methods across various bond categories (intermediate-term vs long-term, corporate vs treasury, et al).
Author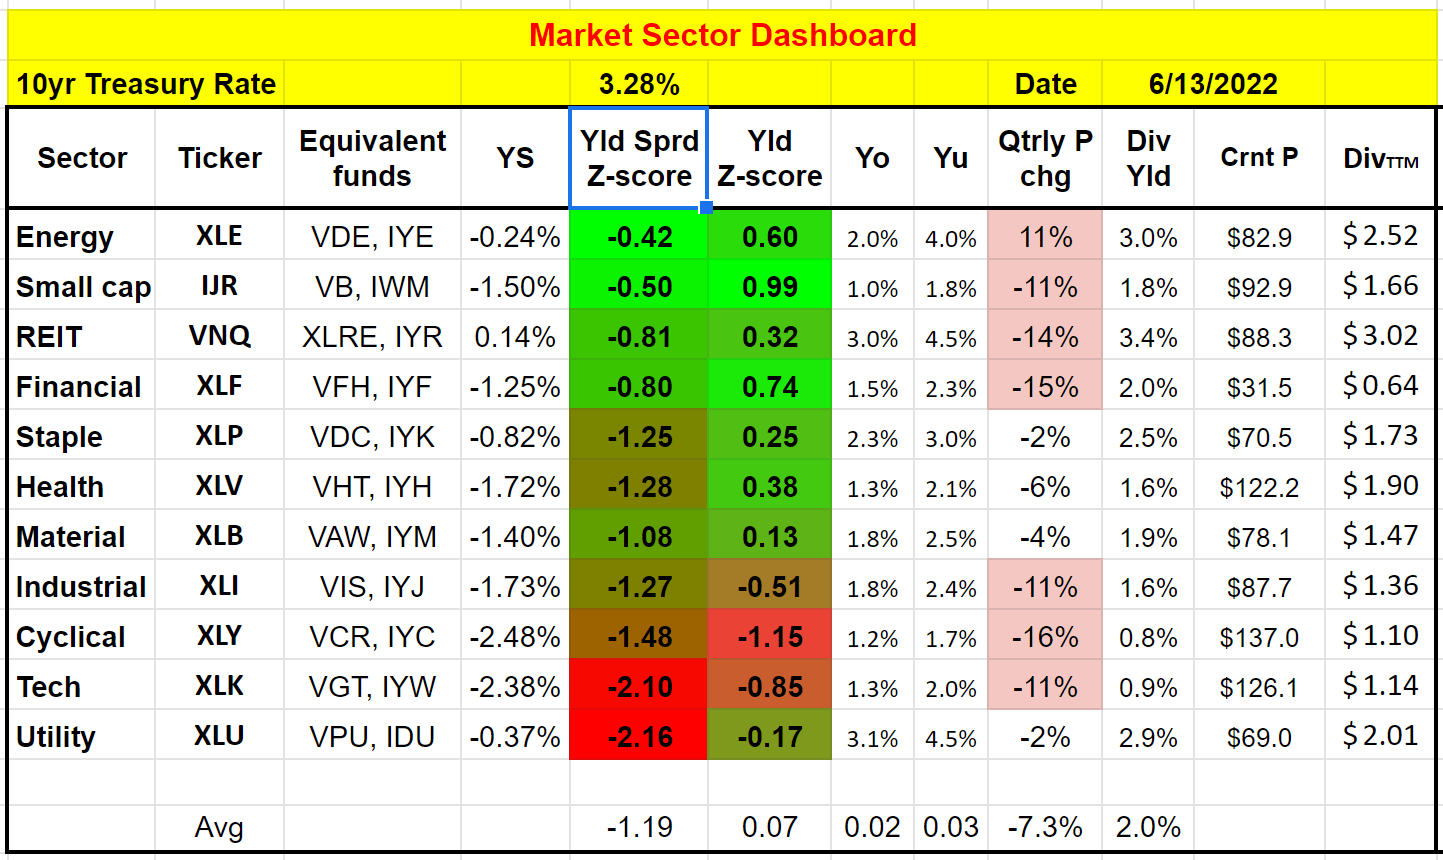
An overview of bonds
Before going into the details on AGG and TLT, let’s take a high-level overview of the bond market first. We use the following dashboard to monitor bonds (and again, feel free to export/download it via this link: YS and Market Sector Dashboard). Details are in this free blog article. A few highlights:
- All the yield spreads are benchmarked against the 10-year Treasury bond yield.
- The larger the yield spread Z-score (i.e., the greener the color), the more undervalued a bond is relative to the 10-year treasury bonds according to their long-term historical records, and vice versa.
And as you can see, currently, intermediate bonds (represented by VGIT) are the most attractive with a YS Z-score of 1.22. Hope this is intuitive. If I get paid about the same (around 3.3% under today’s conditions) for loaning money out for 10 years vs 5 to 7 years, I would prefer the latter. And this leads us to the discussion of AGG vs TLT next. Finally, even though the discussion here is made with AGG and TLT as specific examples, much of it applies to other equivalent ETFs too (such as BND, EDV, et al).
Author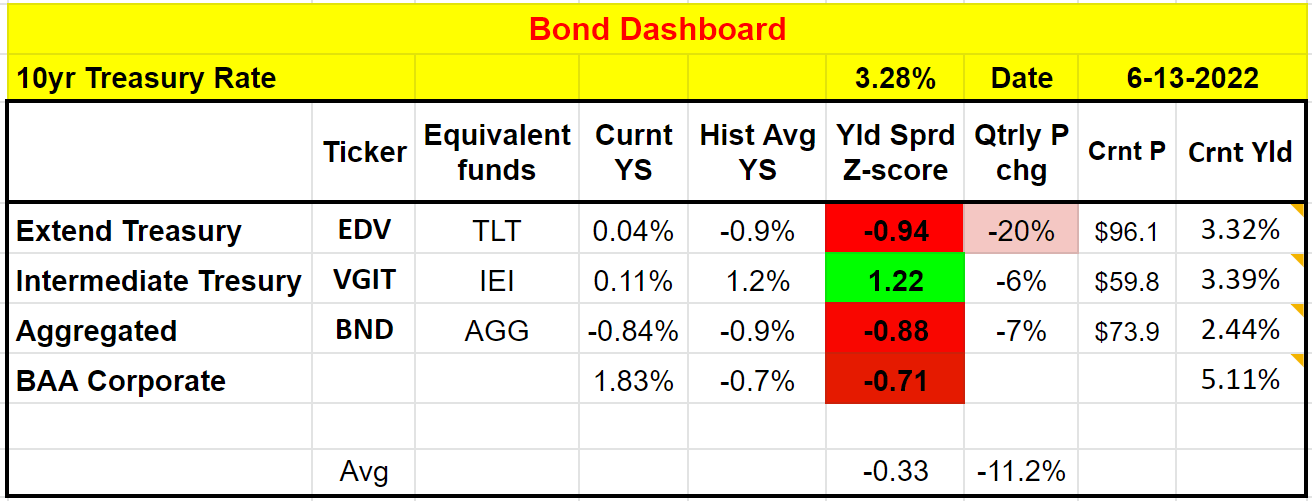
AGG and TLT: basic information
First, some basic information for readers who are not familiar with these two ETF funds yet. Both of them are popular funds in the bond space. AGG is a much larger and less expensive fund. It boasts an AUM of $82B and charges a 0.03% expense ratio. In comparison, TLT’s AUM is about $20B and charges a 0.15% expense ratio. Although, both trade with sufficiently large liquidity and narrow spread, AGG holds a large number of bonds (totaling 10,095 as of this writing), while TLT only holds 34. If you are wondering about diversification, the next section is for you.
Source:ETF.com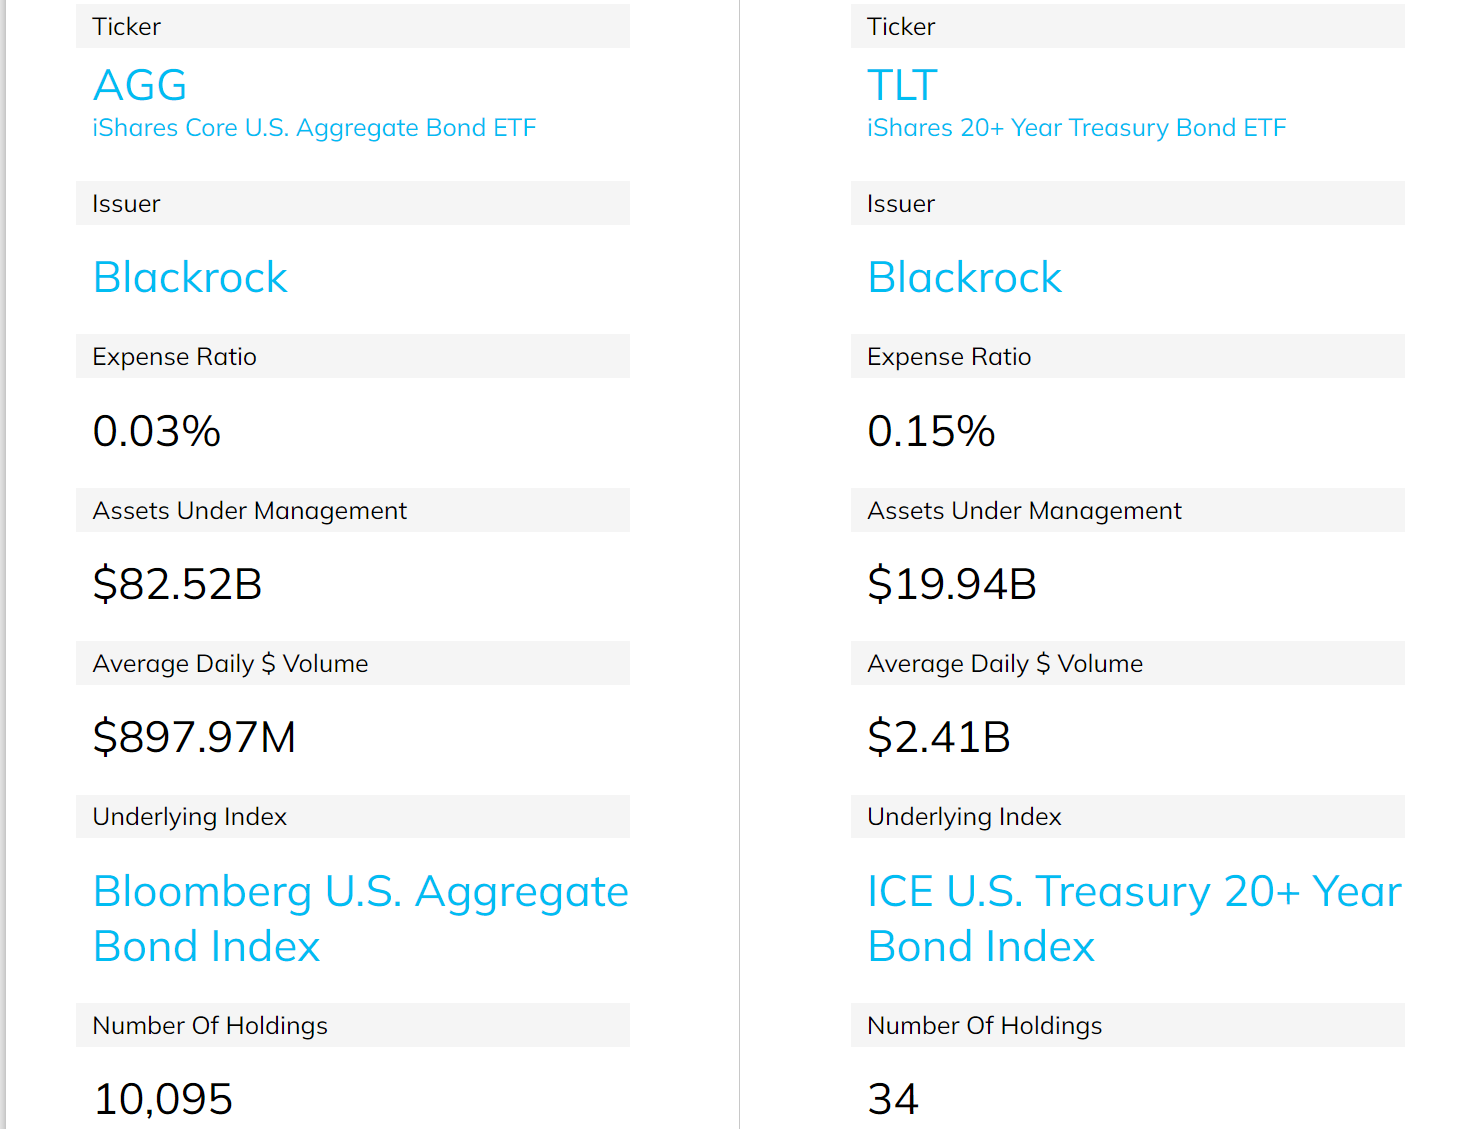
AGG and TLT: credit exposure
According to the fund descriptions (the emphases were added by me):
The iShares 20+ Year Treasury Bond ETF (TLT) seeks to track the investment results of an index composed of U.S. Treasury bonds with remaining maturities greater than twenty years.
The iShares Core U.S. Aggregate Bond ETF (AGG) seeks to track the investment results of an index composed of the total U.S. investment-grade bond market.
So, the reason that AGG holds a large number of bonds is that it invests in ALL the investment-grade bonds both in the U.S., both corporate and treasury. The large holdings help to diversify credit risk, which spans from AAA (i.e., treasury bonds) all the way to BBB.
In contrast, the TLT fund invests only in treasury bonds and there is really no need to diversify the credit risks (or put it differently, there is no way to diversify such risk). If one treasury bond defaults, it means that all treasury bonds default.
Source: iShares fund descriptions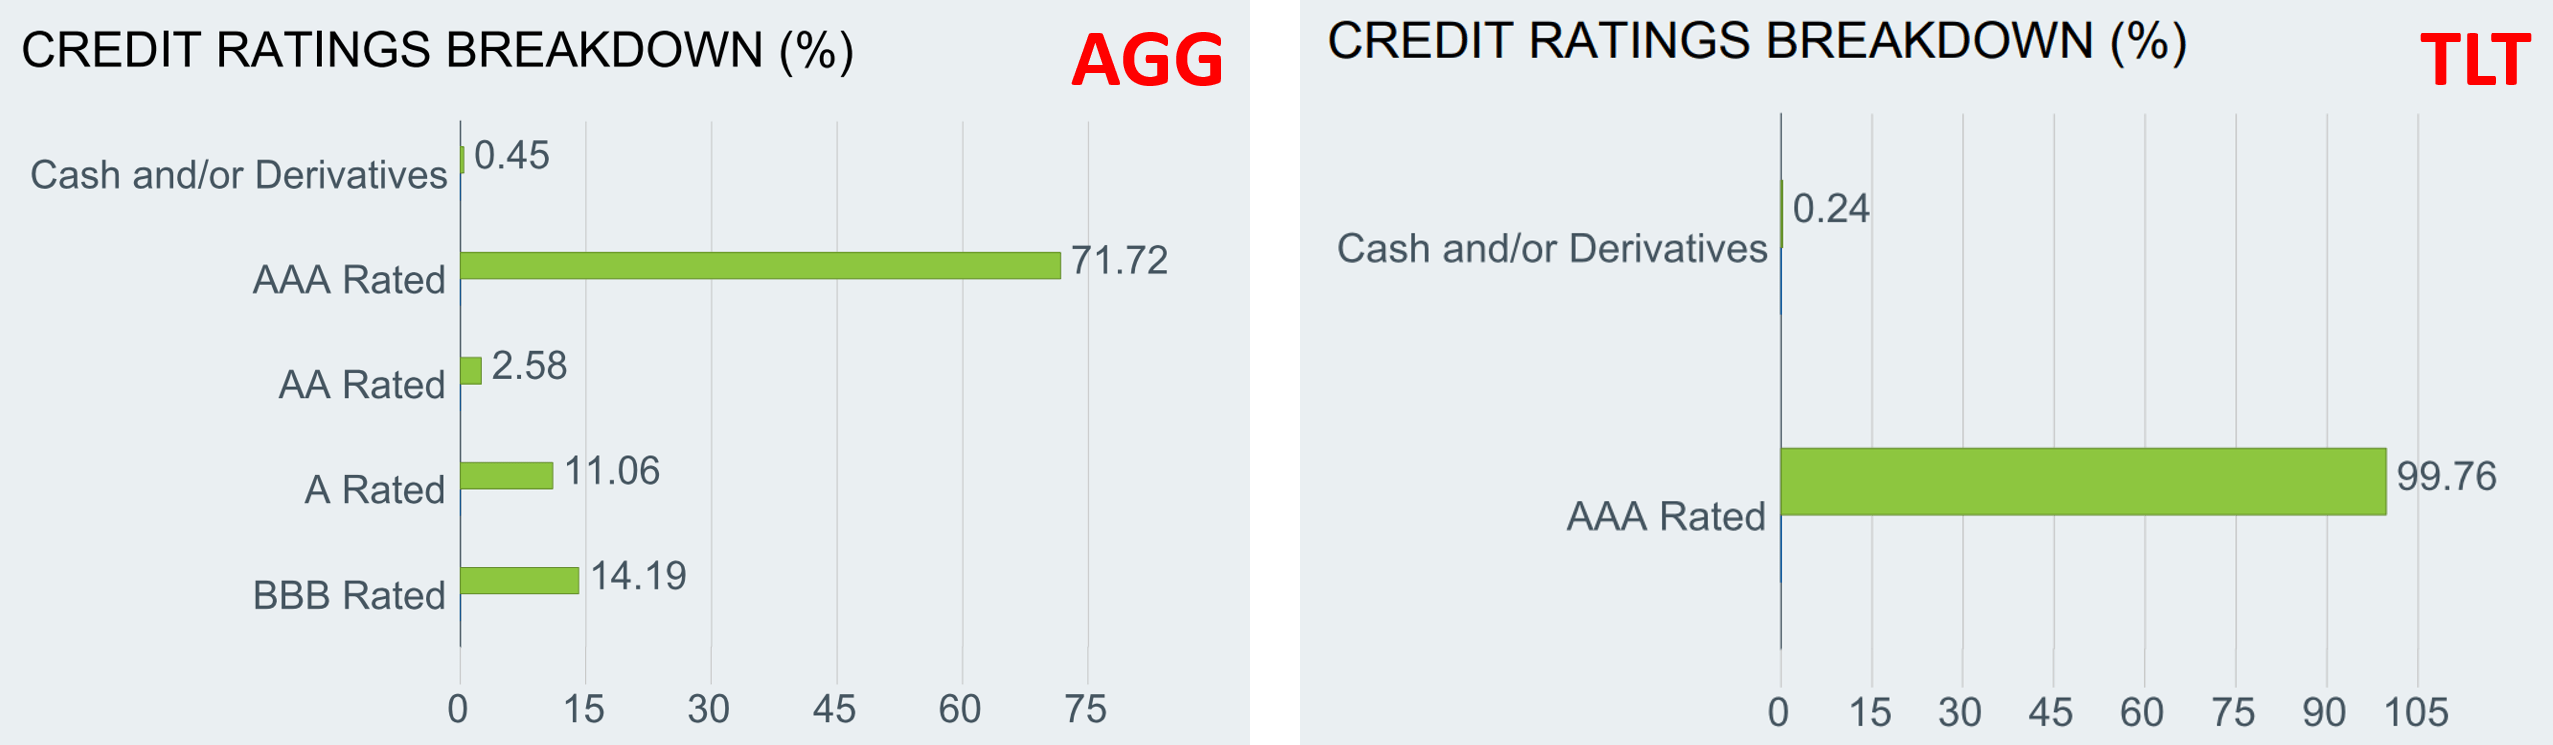
AGG and TLT: interest rate sensitivity
Another important aspect of bond allocation, besides credit exposure, is interest rate sensitivity. The price of a bond changes more sensitively with respect to yield change when its maturity is longer (with everything else being equal such as coupon rates). Note that the Fed controls the interest rates, but not bond yields. The market dynamics decide bond yields. The interest rates can drive changes in bond rates but are not identical to bond yields, a key point we will revisit later.
And maturity is a key variable to determine such sensitivity. And as you can see from the following chart, AGG holds a portfolio of bonds with vastly different maturities, ranging from below a year all the way to 20+ years. The average effective maturity of the AGG fund is about 8.76 years as of this writing. That is why we use it as an intermediate bond fund. In contrast, TLT holds almost exclusively bonds with 20+ plus years of maturity left. Its effective maturity is 25.9 years as of this writing, and that’s why we use it as a long-term bond fund.
Source: iShares fund descriptions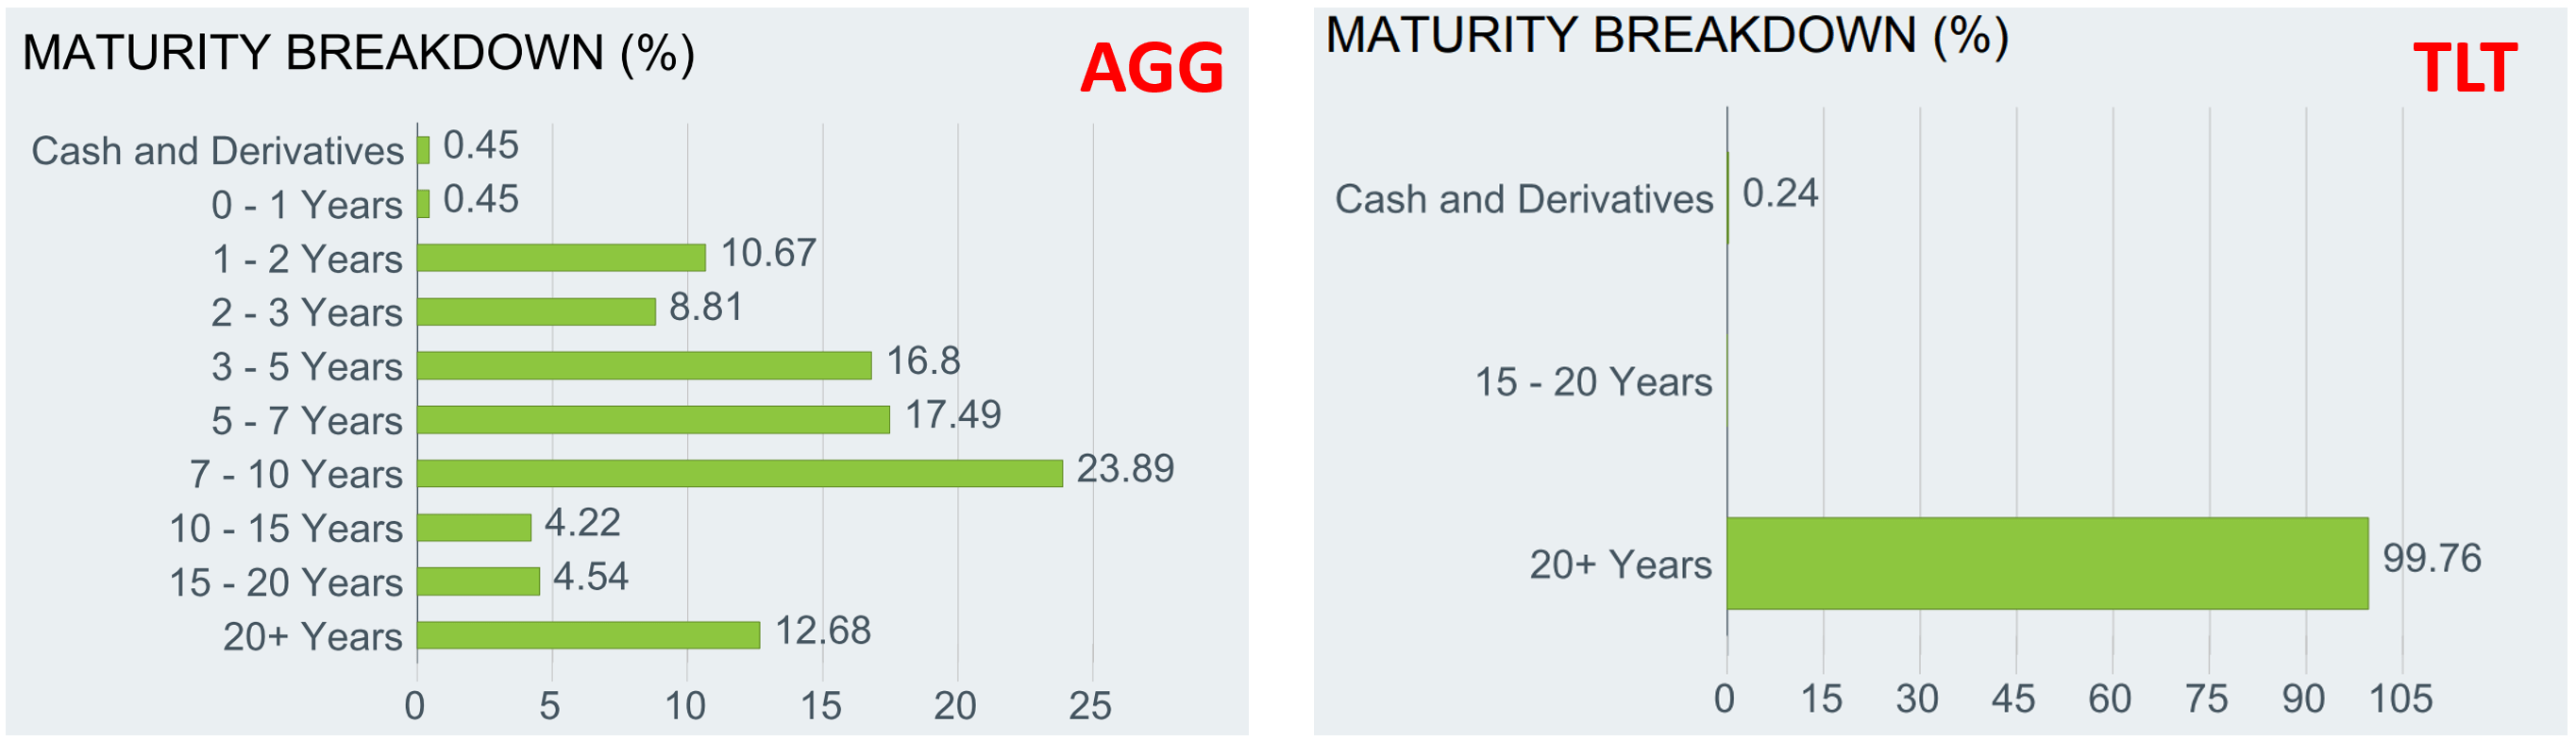
The next chart shows the price change of AGG from its current condition of about 3.3% yield. The chart was made using AGG’s effective maturity of 8.76 years and its weighted average coupon rates of 2.53%. As seen, the price will decrease if yield increases and vice versa. To wit, if the yields for 5~7 years bonds further increase to 3.75% from the current level, AGG would suffer a price decline of about 4%. And AGG investors would receive 2.53% per year to partially offset this price depreciation. On the other hand, if its yield drops back to 2.5% or below again, you would enjoy an equally large gain of around 5% (plus the coupons).
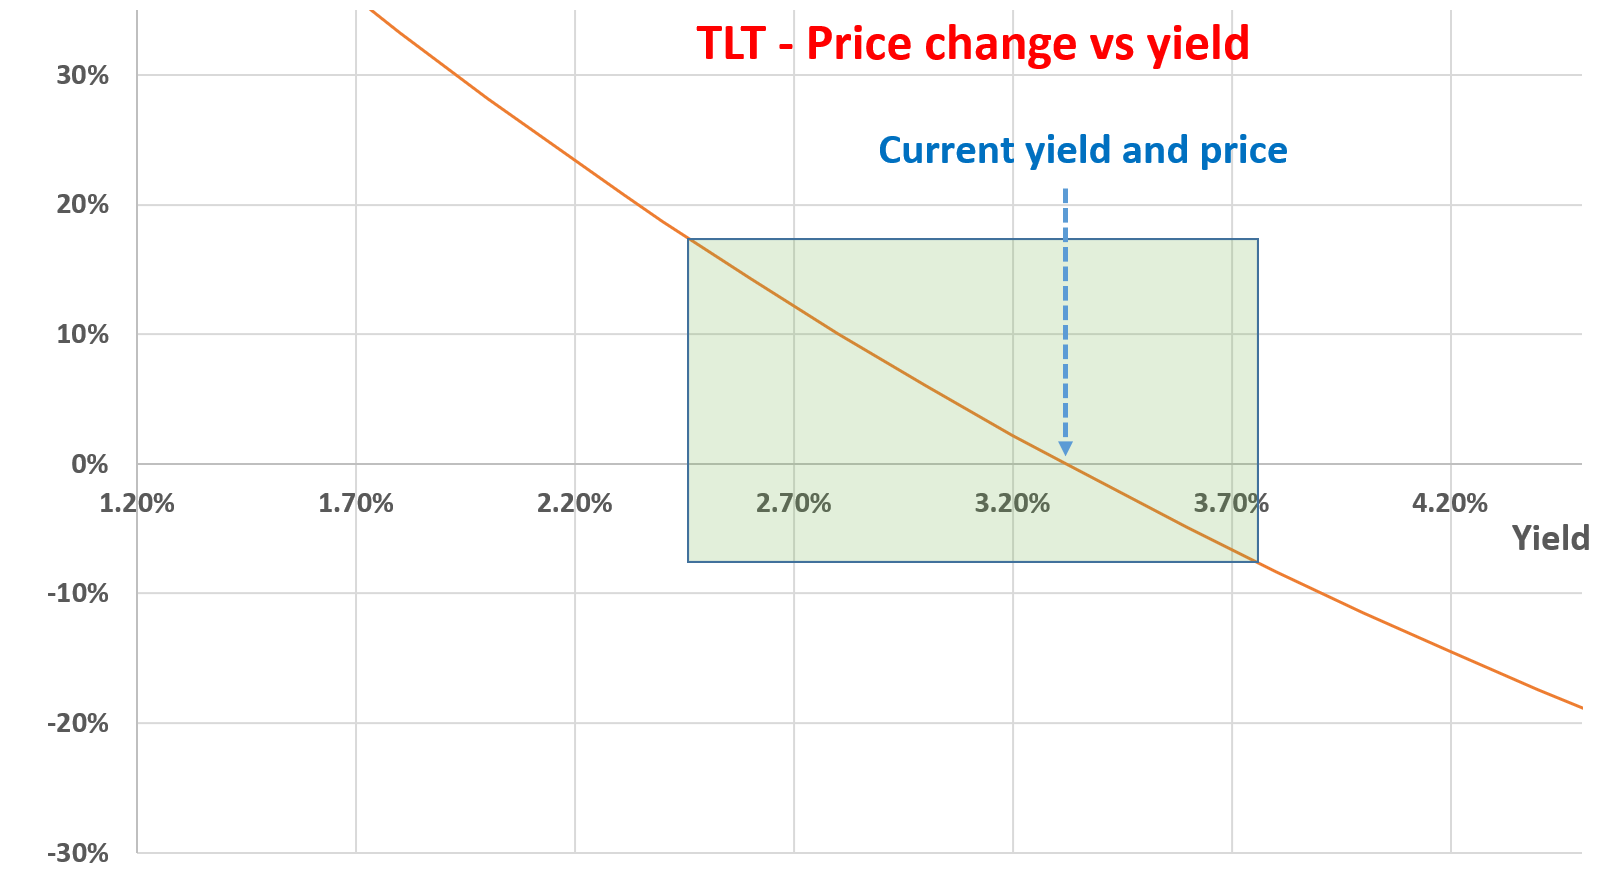
The next chart shows the price behavior of TLT with respect to yield changes. The trend is the same (i.e., price drops when yield climbs). But the changes are much more sensitive now because of its much longer maturity. For example, if the yield increases to the same 3.75% from the current level, it would suffer a price decline of almost 8%. And again, part of it (about 2.43% as of this writing) is compensated by the coupons. Again, if its yield drops back to say 2.5%, it would deliver a large price appreciation of around 18% (plus the coupons). To put things under perspective, the 30-year treasury yield dropped to as low as 0.8% shortly after the COVID pandemic broke out (because of the Fed’s hard-landing and also the market panic).
The above analysis is why we think the market dynamics have changed fundamentally now. We see the risk/return profile quite asymmetric now for bonds. As argued in our earlier article:
At a very fundamental level, in the long term, treasury bond rates cannot rise above long-term inflation or GDP growth. Our government has been relying on inflation and GDP expansion to inflate away and outgrowth its debt obligations for decades in the past. And it will (it will have to) continue doing so.
We see the current bond rates of 3.3% approaching such long-term targets already. And we see their future movements as asymmetric (as highlighted in the green boxes below).
Author Author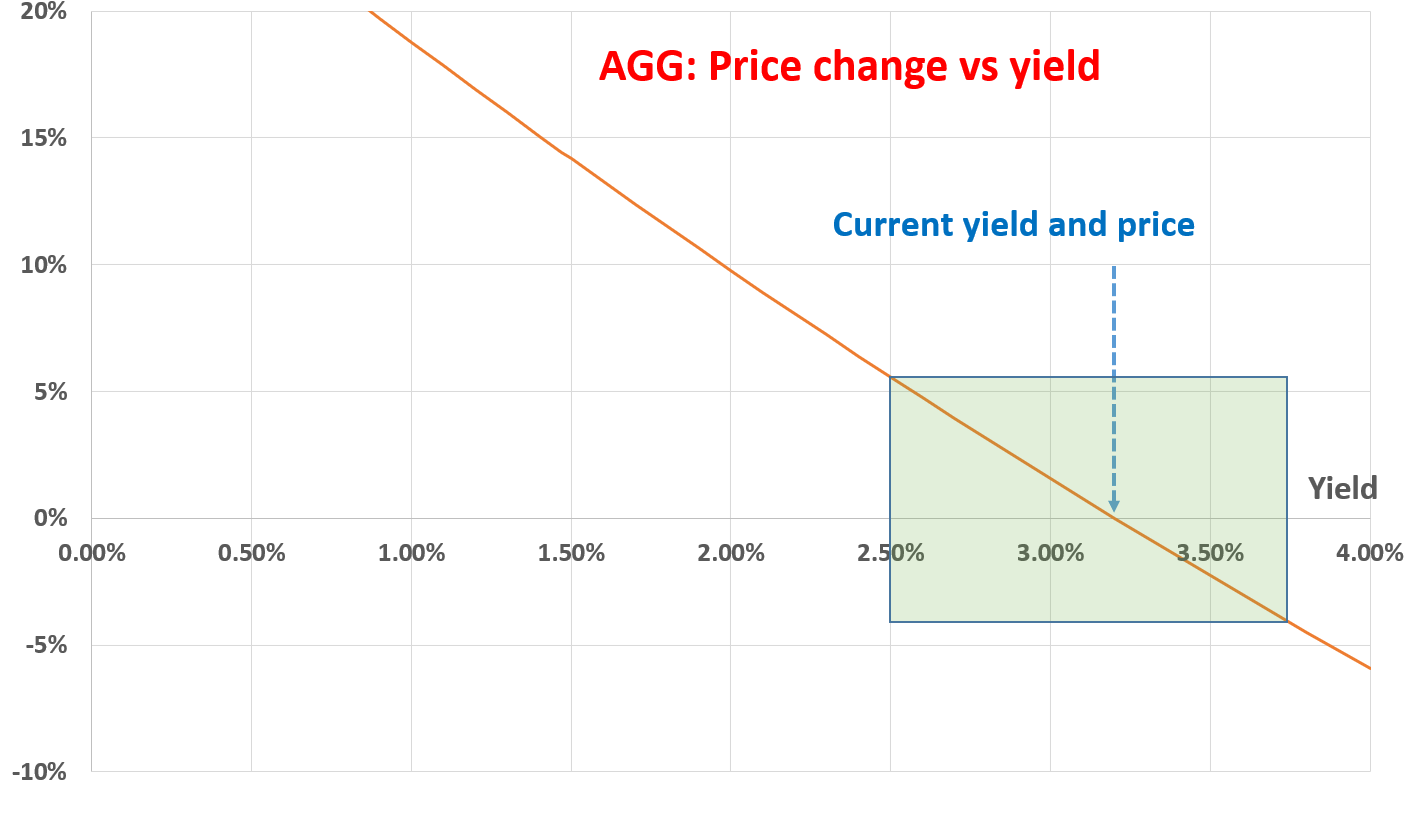
Summary and other risks
Here we use the AGG and TLT funds to illustrate our bond allocation strategies. We follow a simple, yet timeless, concept to decide the allocation of each bond subcategory (long-term vs intermediate-term, corporate vs treasury). Compared to the equity market, we see bonds overall provide asymmetric return/risk profiles now as their yields (around 3.3% now) approach the long-term limits. As a result, we are increasing bonds’ allocations in our own accounts. Particularly, among all the bond subcategories, we see intermediate treasury bonds (such as VGIT) as the most attractive subcategory given their large YS Z-score. AGG is attractive too, but we view it less so than a pure treasury bond fund because there is no clear advantage of owning corporate bonds now. If you recall from the bond dashboard at the beginning, BAA bonds currently feature a negative yield spread Z-score. To wit, we have increased our intermediate bond exposure from 12.7% in March to the current level of 13.4% in our growth portfolio. Our overall exposure to bonds has also increased from 26.8% to 28.8% over the past three months.
Finally, risks. Besides the interest rates and credit risks mentioned above, also note that Bond ETFs are different from bonds. Bond ETFs are NOT fixed income instruments because you have no guarantee to receive the principal back at maturity (or put in another way, bond ETFs do not ever mature). So, depending on your financial goals, you should choose either bonds or bond ETFs correspondingly.
Author’s Aggressive Growth Portfolio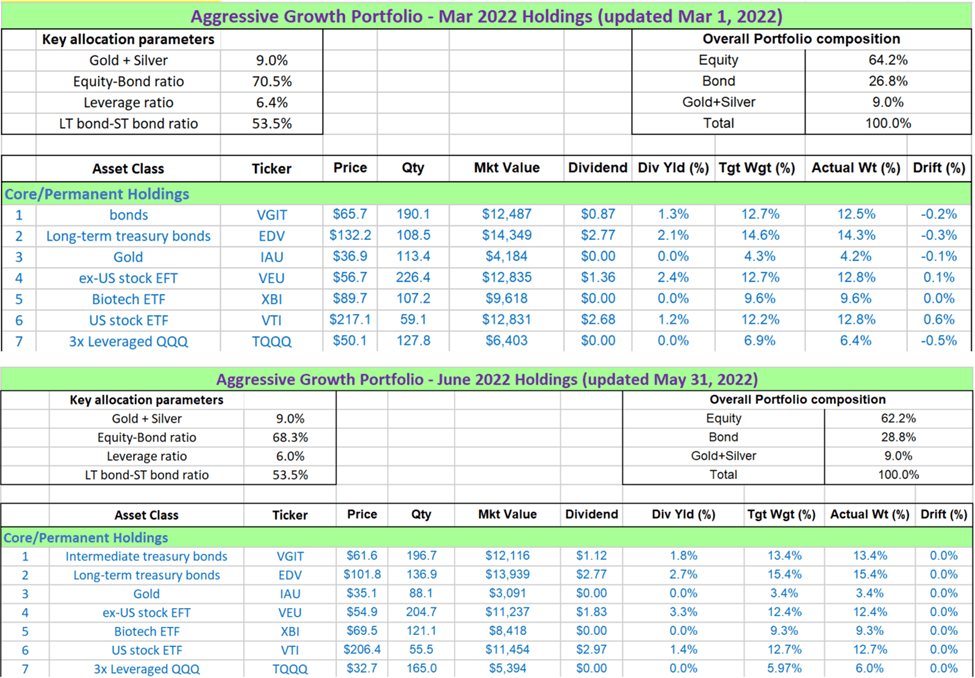
Be the first to comment