

tobiasjo
Thesis
As a dividend investor, the goal is to invest in firms that have a high likelihood of maintaining growing dividend payments throughout the investor’s lifespan. Aflac is a dividend Aristocrat and a large firm that is embedded into American businesses making it an ideal candidate for investment. All else being equal, analyzing the historical data of Aflac Incorporated (NYSE:AFL) shows strong dividend growth and a high probability of future success through quantitative analysis. This places Aflac at a “Buy” rating with a nice margin of safety for upside potential.
Introduction
Aflac has earned a coveted “Dividend Aristocrat” rating by providing a growing dividend for over 30 years to its shareholders. With the current market environment acting with such volatility, investors can turn to these long-term focused dividend income companies to provide much needed stability to their portfolios. Aflac has shown great resilience YTD (2.40% return) even as the S&P 500 has dropped over 20% (Figure 1).
Figure 1. Aflac YTD vs. S&P 500 (Seeking Alpha)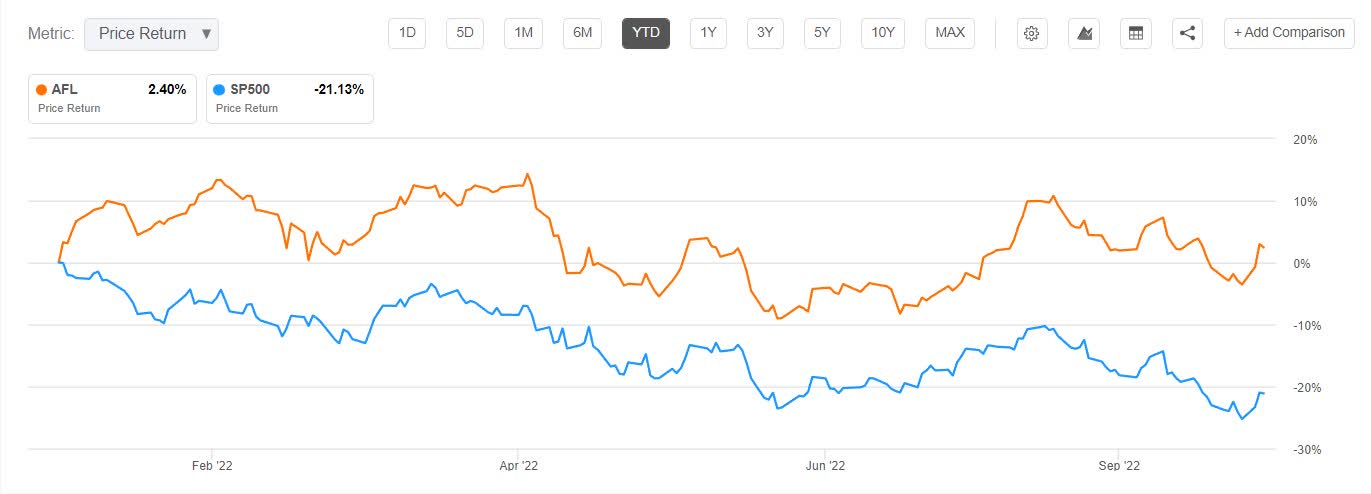
Gaining perspective from long-term returns, Aflac has performed extremely well vs the overall market proving the value of its business as reflected in the stock price returns (over 3177.37%) compared to the S&P 500 since 1992 (813.62%, Figure 2).
Figure 2. Aflac vs S&P 500 since 1992 (Seeking Alpha)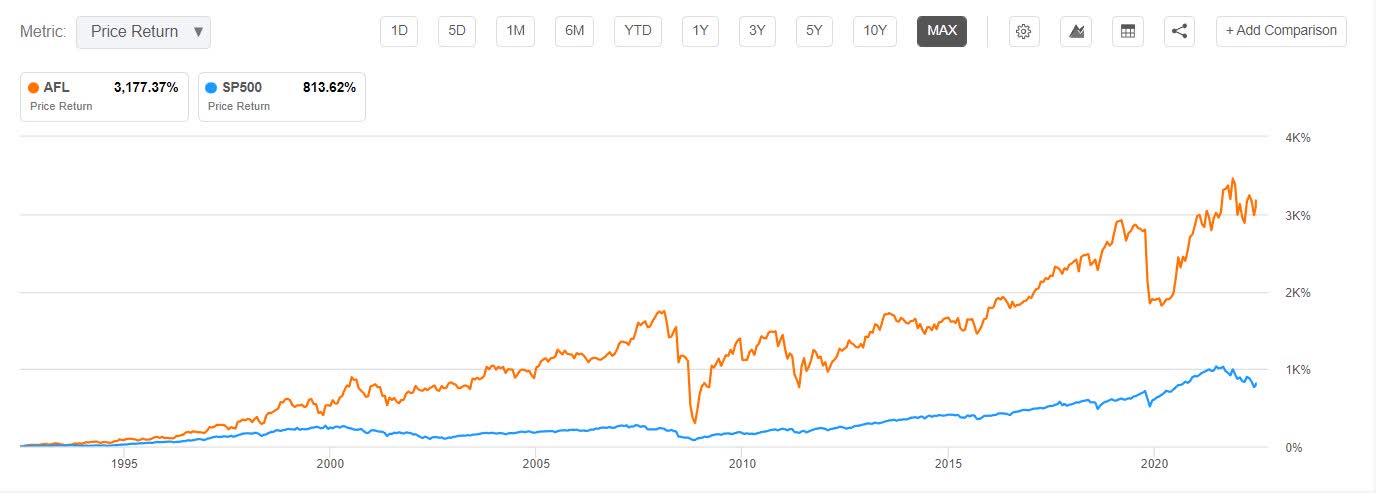
Intent
The intent of this article is to value Aflac for long-term dividend focused investors. Investors can utilize quantitative methods augmented by investor expectations to determine a purchase price.
The utilization of historical data helps investors understand how Aflac has performed over a longer period of time. Combining this with a Monte Carlo simulation allows for a virtual representation of future outcomes. The Monte Carlo simulation for this analysis is performed by creating a random sample of 5,000 data points based off historical inputs and predicting what a randomized future may look like for Aflac investors. When quantitative analysis is combined with individual investor analysis of Aflac’s competitive landscape, management, and other financial metrics, they can determine where they think the valuation lies for their expectations and factor in a margin of safety for their investment.
Focusing in on the Dividend
Aflac has a strong dividend history, and the Seeking Alpha Dividend Grades shows a strong rating for Dividend Safety, Dividend Growth, and Dividend Consistency primarily due to the consistent above average growth rates and well covered payout ratios. The Dividend Yield (FWD) is 2.67%, which is lower than the Financial Sector median of 3.20%. This strong historical performance signals that the company maintains a keen eye on shareholder returns.
Figure 3. Aflac dividend scorecard (Seeking Alpha)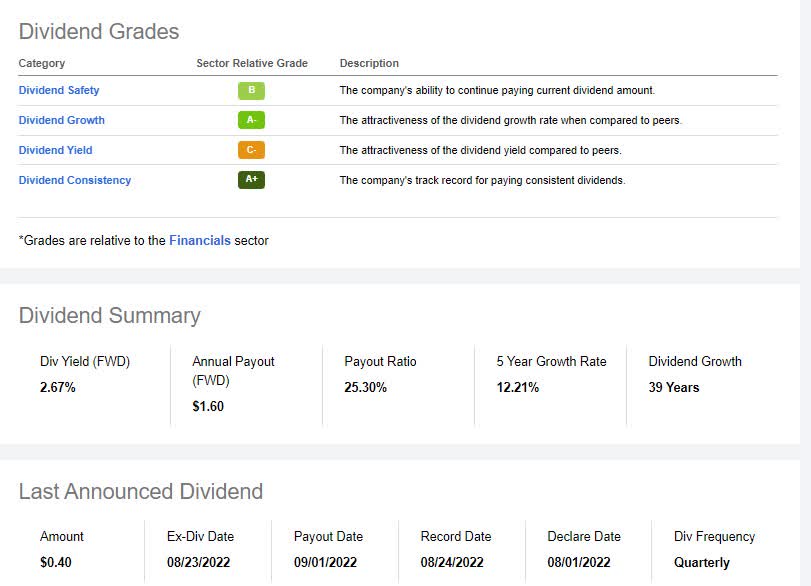
The Dividend Statistics
The first step in modeling the future dividend of Aflac is to analyze their historical performance (Figure 4). The dividend data in this analysis was sourced from the Aflac dividend history on the firms website. The historical dividend data is an important tool for analyzing future scenarios. The historical growth rate distribution shows a strong dividend rate over the past 30 years. The mean and median dividend growth rates are 14.3% and 13.99% respectively. The standard deviation is 9.29% with a 95% confidence interval between 17.77% and 10.93%. This means that 95% of the historical data should fall between those values and the standard deviation represents a range of outcomes as a measure of volatility.
Figure 4. Aflac dividend growth rate distribution (Author)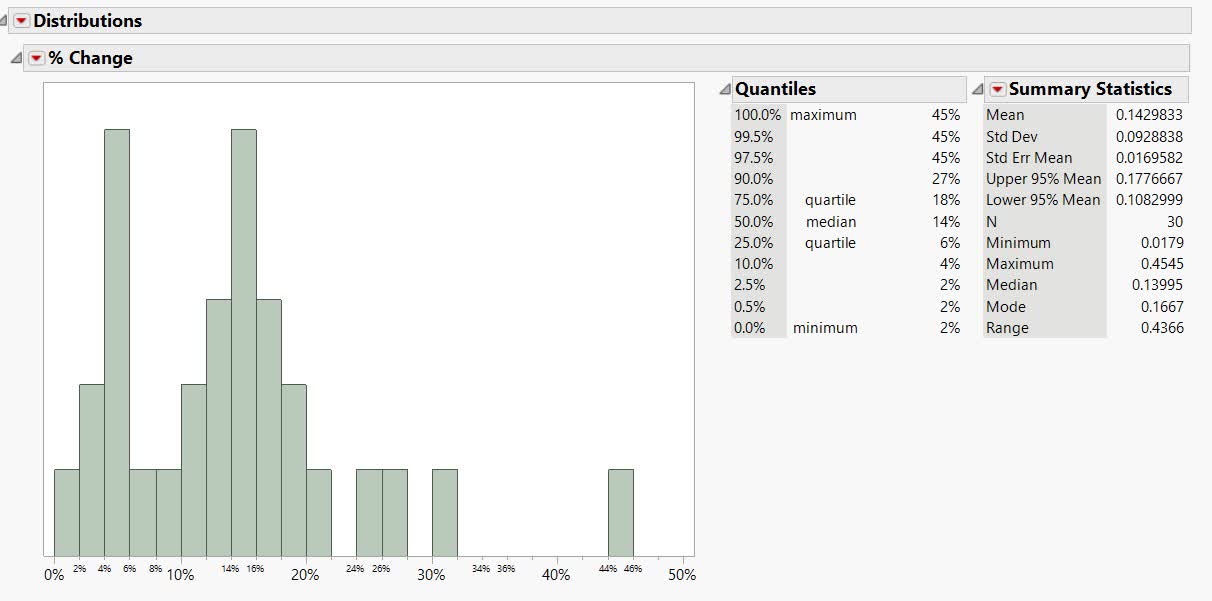
A line graph of the annual dividend (blue line), and the dividend growth rate (red line) since 1992 show what spectacular dividend growth rate changes Aflac has supplied to their shareholders (Figure 5). Observe how the greatest growth rate was prior to 2008 and Aflac has had much more modest (but still exceptional) dividend growth rates since then.
Figure 5. Aflac Dividend growth and percentage growth by year (Author)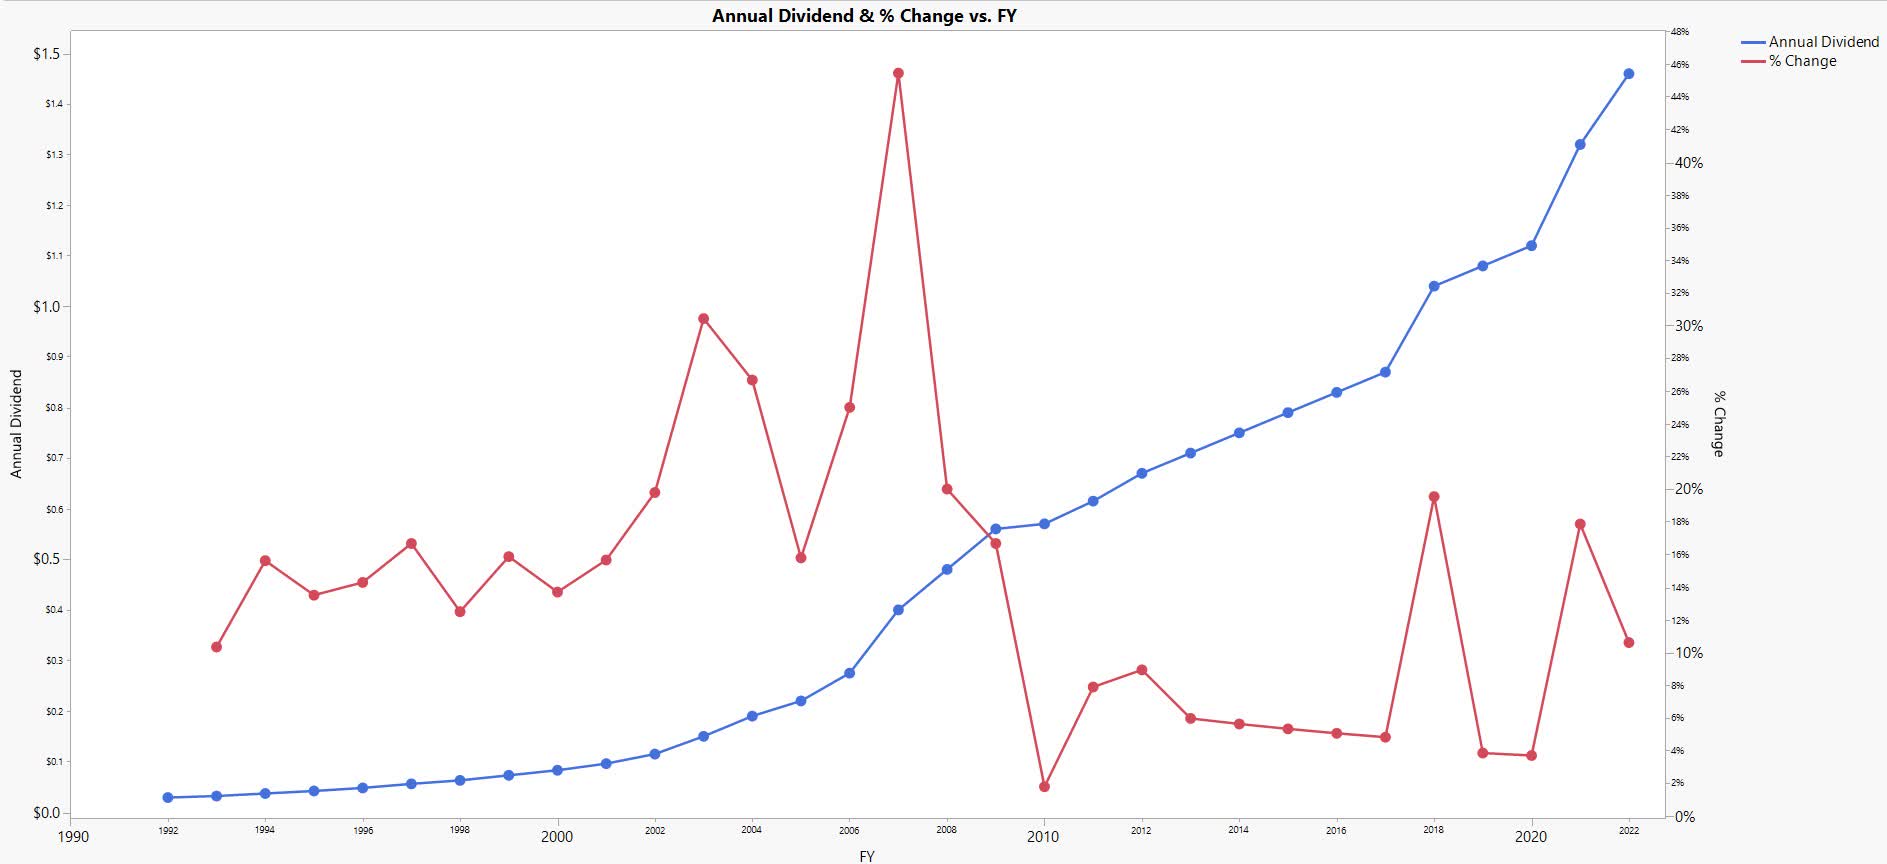
Monte Carlo Simulation
The Monte Carlo simulation attempts to create randomized future scenarios which can be used to predict future performance. The Monte Carlo simulation for Aflac inputs the median and standard deviation from the historical data. The median is chosen because in distributions with skew, the median is a better representation of the truer middle. The Monte Carlo simulation was run through 5,000 iterations and the results show that a forecasted median and mean (14.11% and 14.05%) dividend growth rate can be expected into the long-term future (Figure 6).
Figure 6. Aflac Monte Carlo simulation results summary (Author)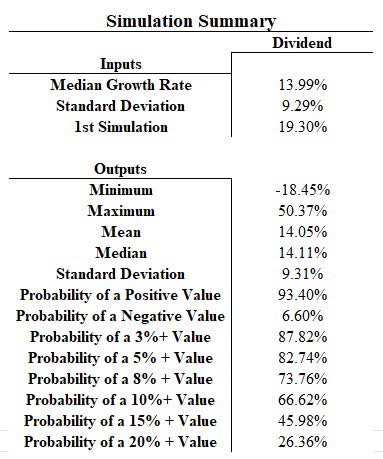
The simulation shows that during any independently given year, Aflac has a 93.4% probability of increasing their dividend by a positive value. It also shows that at any given independent year, Aflac has a 73.76% probability of increasing their dividend by at least 8%. What this means for investors is that using the inputs from the historical data and 5,000 randomized iterations, Aflac has a high probability per independent year of having a positive growth rate going into the future. Aflac also has a possibility of having an approximate 18% dividend cut and a 6.6% chance of having a dividend cut at any given year.
Growth Rate Summary
Figure 7 represents a summary of Aflac’s dividend growth rates that investors can use to form their inputs into their investments. It represents how utilizing different calculations, investors can determine different formulations for their cash flow perpetuity formulation. The Scenario median growth rate was calculated earlier using Monte Carlo simulations with a value of 14.11%.
Figure 7. Aflac dividend growth rate input options (Author)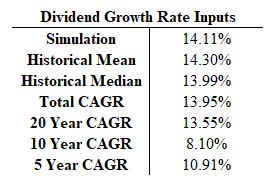
The Compounded Annual Growth Rate (CAGR) formula can also be utilized over different time periods to show potential trends (Figure 8). A CAGR formula considers the annual growth with a beginning and ending period and is a more accurate way of measuring returns. The summary above shows the results of a CAGR calculation since 1992, and the past 20, 10, and 5 years. This summary shows that Aflac has done a good job maintaining their dividend growth across multiple calculations and periods.
Figure 8. Compounded annual growth rate formula (Investopedia)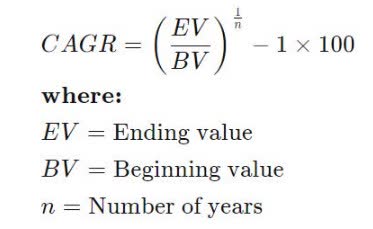
Sensitivity Analysis for Dividend Investors
The final step is to determine how investors can utilize this information for determining a purchase price based off their expectation of returns or their expectation for growth. A Gordon Growth Model can determine the intrinsic value of constantly growing payments (Figure 9). We can then utilize a Sensitivity Analysis combined with the Gordon Growth Model to determine purchase prices (Figure 10). It utilizes a constant cash flow (dividend), an expected growth rate (shown in the dividend growth rate summary, Figure 7), and the investors expected return to derive a purchase price for a position.
Figure 9. Gordon Growth Model formula (Investopedia)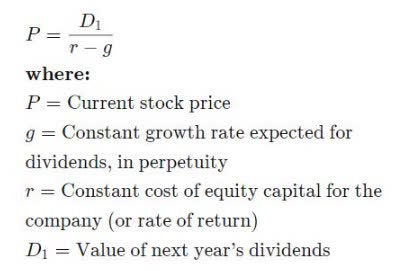
Orienting and understanding a Sensitivity Analysis is useful for investors to determine their ideal purchase price (Figure 10). The left column shows a scale of different Dividend Growth Rates ranging from 2% to 15% and the blue highlighted rates are representative of some of the different approximate rates represented in the Aflac Dividend Growth Rate Inputs Summary above (Figure 7). The Desired Return shows a scale of different investor return expectations ranging from a 5% to 17% return. The tabulated data shows the purchase price of Aflac stock needed given an expected dividend growth rate and the investors desired return. As of this writing, AFL is trading around the $59 price range and prices within 5% are highlighted in green.
Figure 10. Aflac sensitivity analysis (Author)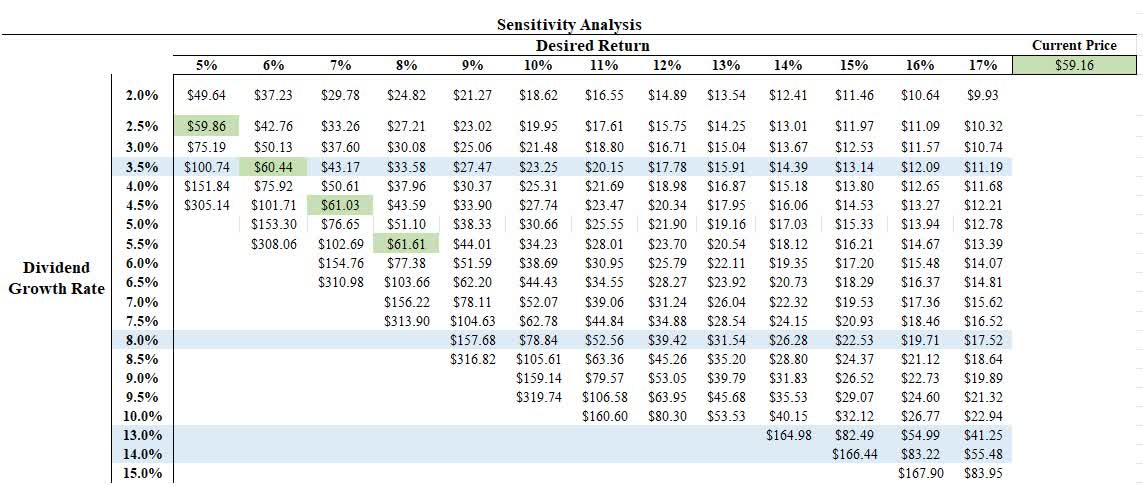
When an investor utilizes the sensitivity analysis and their assumption for dividend growth, they can determine their purchase price.
Example 1
If an investor utilizes the Monte Carlo simulation and expects a median growth rate of 14.11% (rounded down to 14%) at the current price, then that means the investor can expect a return of approximately 16% to 17%.
Example 2
If an investor utilizes the Aflac CAGR values of approximately 10% to 13% and the current price of Aflac, then that investor could expect a return ranging from 10% to 16%.
Example 3
If an investor thinks that a perpetual dividend growth rate of 8% is achievable and they expect a return of 15%, then their target purchase price is $22.53
Example 4
If an investor theorizes that it is unlikely that Aflac could grow their dividend as they have historically and forecasts a 3.5% dividend growth rate for perpetuity, then the current pricing of Aflac would create an approximate 6% return for perpetuity. This example is conceptually logical and creates a likely return of 6% as a base while creating opportunity for upside returns for any year that Aflac grows their dividend at a higher rate.
Sensitivity analysis allows for an investor to utilize their choice of the potential dividend growth outcomes and their expected return to determine their buying price and removes behavioral aspects encouraging better investment decisions.
Risk
There is currently large uncertainty and volatility in financial markets. Utilizing quantitative methods for investment decisions is intended to help mitigate risk. The Sensitivity Analysis shows that as the growth rate declines given a constant return expectation, the purchase price decreases for Aflac. In times of exceptional uncertainty and risk (present economic conditions), it is beneficial to increase the return expectation as a way of factoring in a margin of safety. As an example, an investor who normally expects a 6% return may expect a 7% return as a Margin of Safety and change their purchase price accordingly. Dividend investors can specifically focus on decreasing their risk by increasing their return expectation and estimating future dividend growth conservatively.
Aflac specifically has had a large dividend focused outperformance throughout its history. Utilizing the dividend data exclusively could create scenarios that are too optimistic and investors should consider multiple scenarios before making any decision (as demonstrated in Examples 1 through 4). Investors should also consider other financial metrics, management, and competitive landscape to determine whether Aflac can continue to grow its dividend at such a superb rate.
Summary
As a dividend investor, the goal is to invest in firms that have a high likelihood of maintaining growing dividend payments throughout the investors lifespan. Aflac is a dividend Aristocrat and a large firm that is embedded into American businesses making it an ideal candidate for long-term investors. Utilizing conservative expectations for a perpetual dividend growth of 3.5% combined with a long term dividend return expectation of 6% leads to rating AFL a “Buy” around their current trading range. The perpetual dividend growth rate in this assumption (3.5%) has a high likelihood of being outperformed according to the historical performance of Aflac and the Monte Carlo simulation performed. This means that investors can currently buy Aflac with a high probability expectation of a 6% return but have a high likelihood of a greater than 10% return until their dividend growth subsides.
Monitoring through the remainder of the year as a bearish market continues to pressure equities down may present opportunities to invest into Aflac, and the rating would change to a “Strong Buy” around the $40 range. These bearish markets provide ample opportunity for long-term focused investors and Aflac can be a nice addition to long-term focused portfolios.
Be the first to comment