

Liudmila Chernetska
Since the 4th bear market failed on August 16th, stocks have declined at a rather impressive rate.
YCharts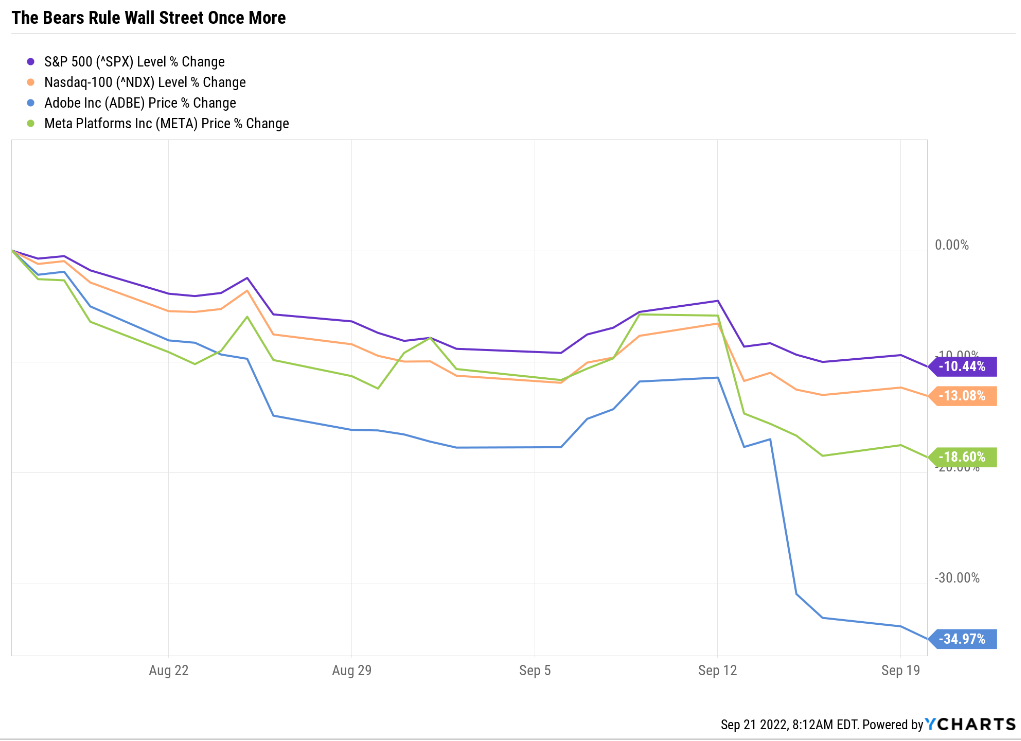
The S&P is down over 10% in just over a month, while the Nasdaq is down 13%. Tech giants like Meta (NASDAQ:META) and Adobe (NASDAQ:ADBE) are down an astonishing 19% and 35%, respectively.
Naturally, long-term investors want to know if this is a potentially attractive buying opportunity or if these price declines are a sign of deteriorating fundamentals.
Several Dividend Kings members have asked for an update on these two tech titans, so let me share with you why both could make you money, but one could potentially make you rich.
Adobe: A Potentially Bad Acquisition Creates An Amazing Buying Opportunity
Adobe was already suffering from the market decline caused by soaring bond yields. But the news of a $20 billion acquisition of Figma sent shares crashing 25% in a single day.
Adobe’s announcement that it was acquiring Figma for $20 billion drowned out the firm’s solid third-quarter results and mixed fourth-quarter outlook. The purchase price will be split evenly between stock and cash, with the deal expected to close in 2023 pending regulatory and shareholder approval. Shares were down sharply on the day, we assume, because of the rich multiple of approximately 50 times annualized recurring revenue, or ARR, wide-moat Adobe is paying, and the unusual timing of the deal.” – Morningstar (emphasis added)
When tech valuations have crashed in a world of higher for longer interest rates, it seems potentially unwise; some would even say reckless to pay 50X sales for anything. Fortunately, the deal isn’t completely insane, at least from a strategic point of view.
We view the acquisition as strategically excellent but are concerned about the timing and very high valuation. We lowered our forecast slightly and then massaged management’s guidance parameters surrounding the Figma acquisition into our model, which, combined, drive our fair value estimate to $450, from $500 previously. We view shares as attractive but see heightened uncertainty as the environment continues to deteriorate and the Figma acquisition muddies the financial picture further.” – Morningstar
Why is Adobe buying Figma now? One theory analysts have proposed is that it’s a defensive move to keep Microsoft (MSFT) from buying it.
Adobe’s reasons for doing the deal, even at such a rich price, are simple, analysts say: The move pulls Adobe into the cloud. In this area, it’s historically struggled to gain traction while reaching a new cohort of design software customers. Beyond just taking a potentially existential threat off the table, buying Figma also creates an opportunity to grow that business by integrating it into Adobe’s wider user base. To do that, Adobe will likely look more to the model of LinkedIn, which Microsoft acquired for $26 billion in 2016, and which Microsoft left running largely independently in years since under former CEO Jeff Weiner (incidentally, a mentor of Field’s).” – Forbes
Adobe is likely hoping that Figma turns into another LinkedIn, for which Microsoft paid $26 billion in 2019 and has turned into a runaway success.
Adobe is already the global leader in media creation cloud computing, and Figma is beloved by young programmers and content creators.
(Source: investor presentation)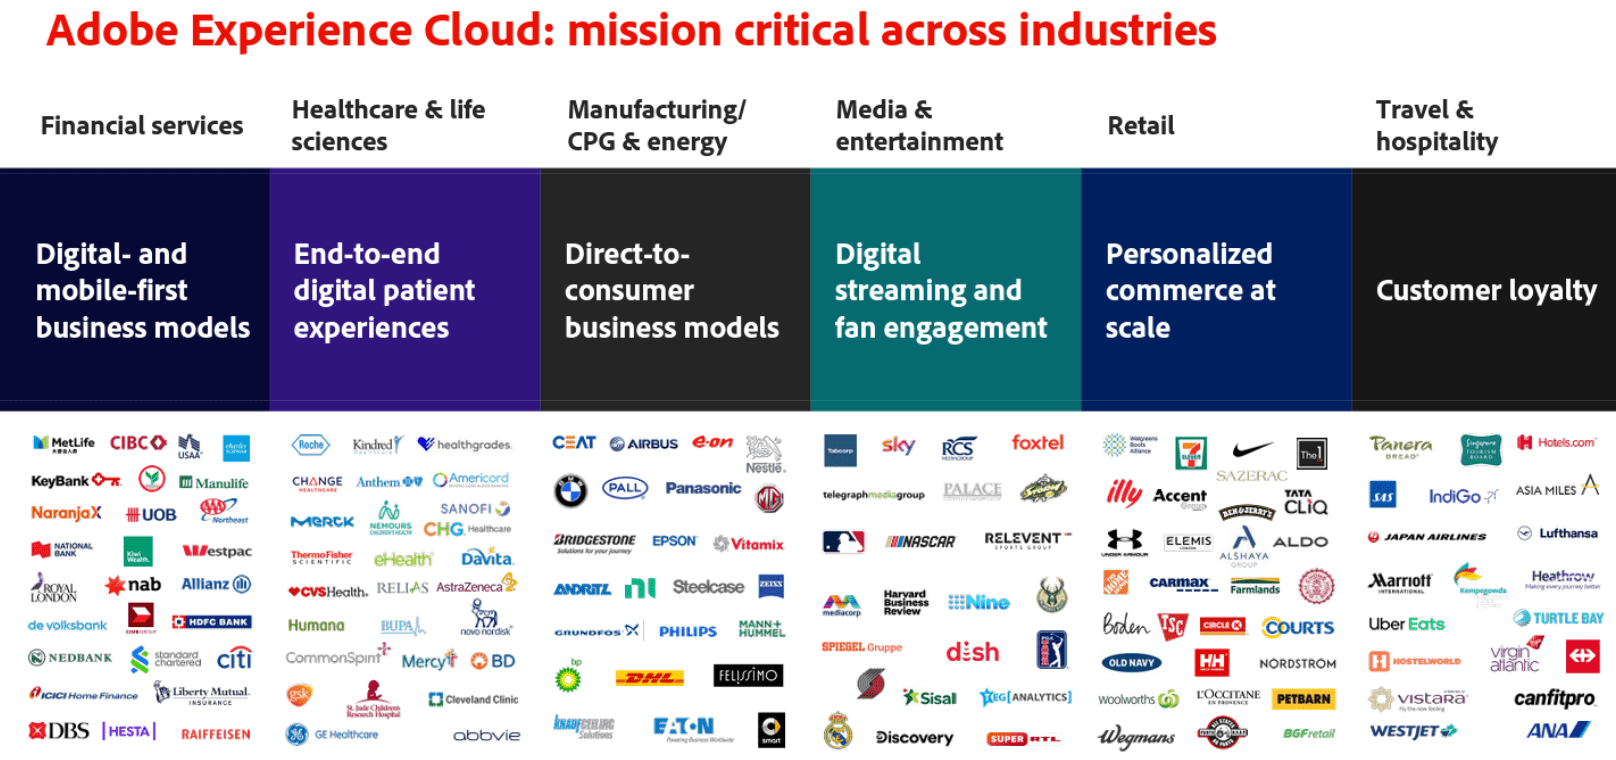
While $500 million in sales won’t move the needle for Adobe (whose sales last year were $16 billion), Adobe is paying an exorbitant amount for Figma’s management.
A big part of that is retaining Field and his top lieutenants, and Adobe is paying a premium to do so. Field, 30, has run Figma since 2012 and carries credibility with customers and the broader designer community, they say. (Recent tweets, perhaps, aside.) “Clearly they want him to stick around,” says Wolfe Research analyst Alex Zukin, who called the timing and price of the deal more surprising than its substance. “If not for him [as a future CEO option for Adobe], for the value of the asset that’s being brought with him.” – Forbes
Great tech management can be worth its weight in gold; just ask investors in Alphabet (GOOG) (GOOGL), Microsoft, and Apple (AAPL).
Wall Street might be a bit concerned about share dilution, which totals 8.5% increased shares if you factor in the stock options Figma’s management is getting (worth $1.7 billion on top of the $20 billion buyout price).
So does that mean that Adobe’s growth thesis is broken? How badly will those extra shares hurt the company’s growth prospects in the short-term? How about the long-term?
Adobe Short-Term Growth Consensus Forecast
| Metric | 2021 Growth Consensus | 2022 Growth Consensus | 2023 Growth Consensus |
2024 Growth Consensus |
| Sales | 24% | 15% | 13% | 13% |
| EPS | 24% | 9% | 15% | 13% |
| Operating Cash Flow | 27% | 11% | 15% | 14% |
| Free Cash Flow | 31% | 9% | 15% | 14% |
| EBITDA | 35% | 36% | 11% | 12% |
| EBIT (operating income) | 39% | 40% | 12% | 14% |
(Source: FAST Graphs, FactSet)
If you add back the 9% growth that’s being diluted away, you can see that 2022’s growth would have been exceptional.
With the Figma deal, Adobe’s growth in the next few years is expected to be very good, bordering on hyper-growth but far below the incredible growth rates it achieved in the last few years.
FAST Graphs, FactSet
ADBE achieved such incredible growth thanks to growing sales at over 20% and expanding its margins.
Analysts don’t think it will be able to keep doing that in the future. But fortunately, Adobe is expected to maintain its industry-leading profitability.
Adobe Profit Margin Consensus Forecast
| Year | FCF Margin | EBITDA Margin | EBIT (Operating) Margin | Net Margin | Return On Capital Expansion |
Return On Capital Forecast |
| 2021 | 43.7% | 51.0% | 46.0% | 38.0% | 1.02 | |
| 2022 | 41.7% | 49.1% | 45.0% | 36.4% | TTM ROC | 280.36% |
| 2023 | 41.8% | 48.7% | 44.9% | 36.7% | Latest ROC | 264.29% |
| 2024 | 42.0% | 48.3% | 45.4% | 37.0% | 2025 ROC | 285.32% |
| 2025 | 42.3% | NA | 46.8% | NA | 2025 ROC | 268.96% |
| 2026 | NA | NA | NA | NA | Average | 277.14% |
| 2027 | NA | NA | NA | NA | Industry Median | 10.27% |
| 2028 | NA | NA | NA | NA | ADBE/Industry Median | 26.99 |
| Annualized Growth 2022-2027 | -1.28% | -1.80% | -0.46% | -0.94% | Vs. S&P | 18.98 |
(Source: FactSet Research Terminal)
ADBE’s free cash flow margins of 42% are expected to be maintained through 2025, and its net margins are likely to remain steady at about 37%.
- Adobe’s free cash flow margins are in the top 5% of all global companies
- 2X that of Apple
It’s returns on capital are expected to remain stable as well, at nearly 300%.
- $2.77 in annual pre-tax profit for each $1 it takes to run the business
Return on capital is Joel Greenblatt’s gold standard for quality and moatiness, and Adobe’s is 27X greater than the industry median and 19X higher than the S&P 500’s.
Adobe Short-Term Growth Consensus Forecast
| Year | Sales | Free Cash Flow | EBITDA | EBIT (Operating Income) | Net Income |
| 2021 | $15,785 | $6,893 | $8,047 | $7,259 | $6,003 |
| 2022 | $17,636 | $7,353 | $8,663 | $7,930 | $6,412 |
| 2023 | $19,941 | $8,338 | $9,710 | $8,956 | $7,314 |
| 2024 | $22,696 | $9,535 | $10,956 | $10,295 | $8,391 |
| 2025 | $25,485 | $10,787 | NA | $11,927 | NA |
| Annualized Growth 2021-2024 | 12.87% | 11.42% | 10.83% | 12.35% | 11.81% |
| Cumulative 2022-2024 | $60,273 | $25,226 | $29,329 | $27,181 | $22,117 |
(Source: FactSet Research Terminal)
Adobe’s growth is expected to slow compared to the torrid pace of the last few years, but it’s expected to still remain solidly double-digit.
(Source: FactSet Research Terminal)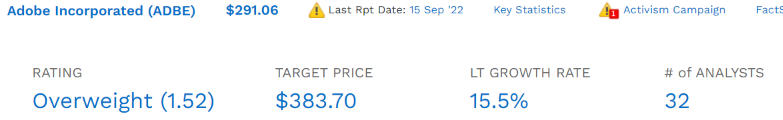
Long-term analysts now expect Adobe to grow at 15.5% CAGR, down from 16.5% before the deal was announced.
- likely due to higher interest costs and 8.5% share dilution
That’s a faster growth rate than MSFT, AAPL, and GOOG.
Maybe Wall Street is worried about ADBE potentially taking on as much as $10 billion in new debt? Adobe investors shouldn’t be excessively worried about that.
Adobe Credit Ratings
| Rating Agency | Credit Rating | 30-Year Default/Bankruptcy Risk | Chance of Losing 100% Of Your Investment 1 In |
| S&P | A+ stable | 0.60% | 166.7 |
| Moody’s | A2 (A equivalent) stable | 0.66% | 151.5 |
| Consensus | A+ stable | 0.63% | 158.7 |
(Source: S&P, Moody’s)
Adobe has a very strong A-credit rating and neither Moody’s or S&P has indicated it’s changing its outlook on news of this deal.
Adobe Leverage Consensus Forecast (Including Figma Acquisition)
| Year | Debt/EBITDA | Net Debt/EBITDA (3 Or Less Safe According To Credit Rating Agencies) |
Interest Coverage (8+ Safe) |
| 2021 | 0.51 | -0.05 | 64.24 |
| 2022 | 0.48 | -0.08 | 72.09 |
| 2023 | 1.45 | 0.68 | 25.59 |
| 2024 | 1.29 | 0.04 | 29.08 |
| Annualized Change | 36.04% | NA | -23.22% |
(Source: FactSet Research Terminal)
Adobe’s net cash balance sheet will temporarily have more debt than cash, but it’s leverage and interest coverage ratios are going to remain well above credit rating agency safety standards.
Adobe Balance Sheet Consensus Forecast
| Year | Total Debt (Millions) | Cash | Net Debt (Millions) | Interest Cost (Millions) | EBITDA (Millions) | Operating Income (Millions) |
| 2021 | $4,123 | $3,844 | -$423 | $113 | $8,047 | $7,259 |
| 2022 | $4,127 | $5,745 | -$727 | $110 | $8,663 | $7,930 |
| 2023 | $14,128 | $11,438 | $6,595 | $350 | $9,710 | $8,956 |
| 2024 | $14,132 | $15,137 | $402 | $354 | $10,956 | $10,295 |
| 2025 | NA | NA | NA | NA | NA | $11,927 |
| Annualized Growth | 50.78% | 57.91% | NA | 46.32% | 10.83% | 13.22% |
(Source: FactSet Research Terminal)
Assuming Adobe funds the cash portion of the deal with pure debt, by 2025 it should be back to having a net cash balance sheet and its growing cash flow at a solid double-digit rate.
Maybe the market is upset that management might spend less on buybacks, which can be a great use of cash in a bear market?
Adobe Buyback Potential Consensus Forecast
| Year | FCF/Share Consensus | Retained (Post-Dividend) Free Cash Flow | Buyback Potential | Debt Repayment Potential |
| 2022 | $15.47 | $7,843 | 5.76% | 190.2% |
| 2023 | $17.65 | $8,949 | 6.57% | 216.8% |
| 2024 | $19.46 | $9,866 | 7.24% | 239.1% |
| Total 2022 Through 2024 | $52.58 | $26,658.06 | 19.57% | 188.64% |
| Annualized Rate | 7.9% | 7.9% | 7.9% | 7.9% |
(Source: FactSet Research Terminal)
Actually, Adobe’s buyback potential is now better than ever, potentially up to $27 billion over the next three years. That’s enough to repurchase 20% of shares at current valuations.
- compared to 8.5% share dilution
- which is already included in this consensus table
Adobe’s retained free cash flow of almost $27 billion could also pay off all its debt, both current and new, by almost 3X over if management wanted.
Adobe Buyback Potential Consensus Forecast
| Year | Consensus Buybacks ($ Millions) | % Of Shares (At Current Valuations) | Market Cap |
| 2022 | $6,203 | 4.6% | $135,767 |
| 2023 | $2,732 | 2.0% | $135,767 |
| 2024 | $3,400 | 2.5% | $135,767 |
| Total 2022 through 2024 | $12,335 | 9.1% | $135,767 |
| Annualized Rate | 3.1% | Average Annual Buybacks | $4,112 |
| 1% Buyback Tax | $123 | Average Annual Buyback Tax | $41 |
(Source: FactSet Research Terminal)
Analysts currently expect Adobe to buyback $12 billion in stock over the next three years, potential 3% of shares each year.
That’s among the highest of any tech giant, and so I conclude that the market’s recent crash in Adobe is more sentiment driven than any problem with its fundamentals.
Meta: The King Of Social Media’s Growth Outlook Has Dimmed Considerably
Meta is experiencing the worst bear market in its history, down 62% off its highs.
YCharts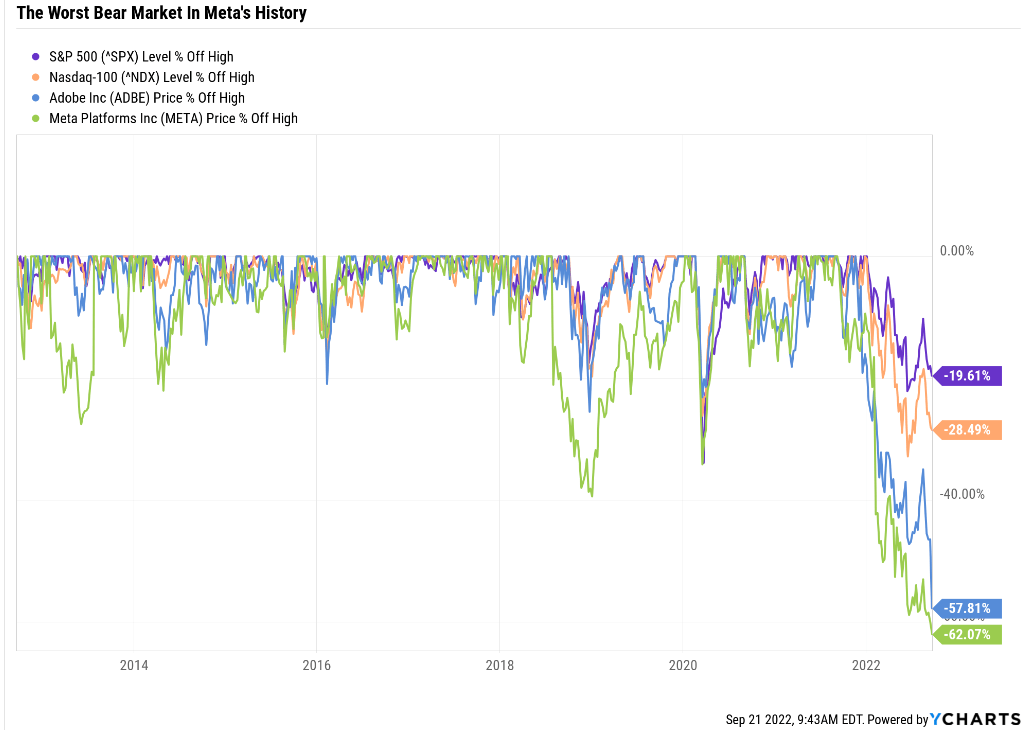
Does that make it a screaming buy? Not necessarily.
The key to social media platforms is network effects. The more people use a platform the more likely other people are to join as well. The more people are on a platform and providing content, the more data Meta has to optimize its advertising algorithms and the more effective its ads are.
Meta’s troubles today are potentially serious, and stem from two major factors.
Daily Shot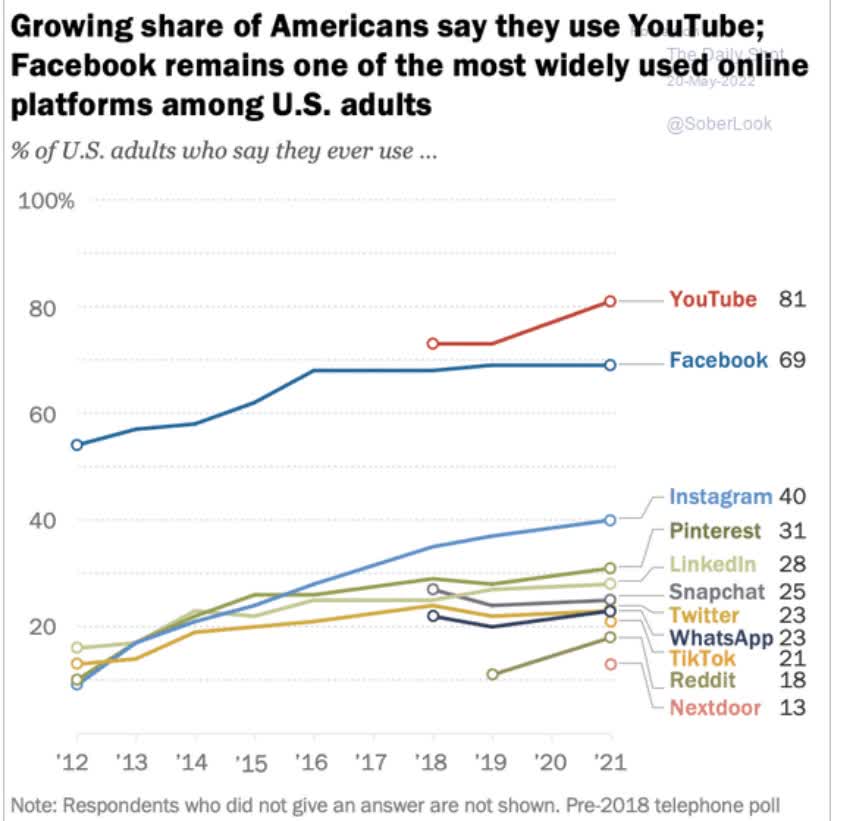
Facebook remains the 2nd most popular social media platform among Americans, behind YouTube.
But Meta’s 1st problem comes from a lack of growth in that network. It’s market share has been flat since 2016.
Daily Shot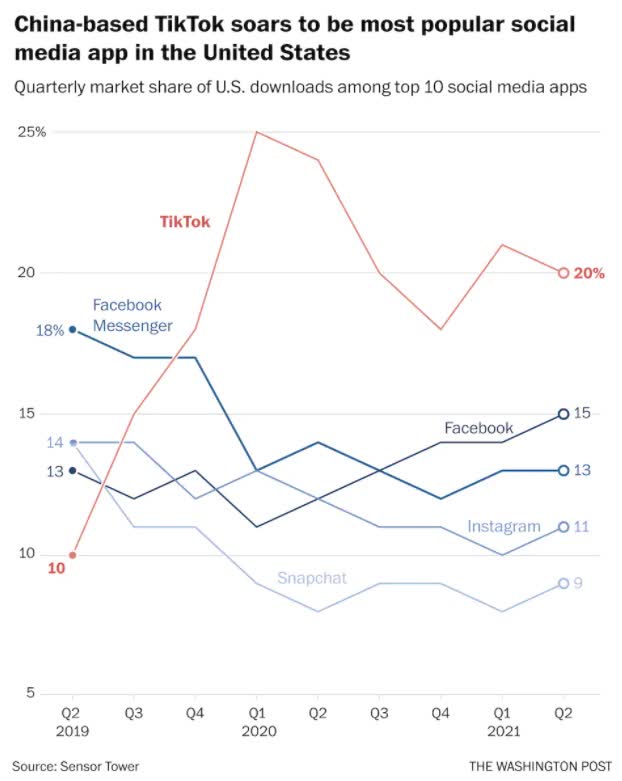
And recently TikTok has overtaken Facebook as the #1 social media platform in America, though if you combine its platforms Meta remains #1.
Daily Shot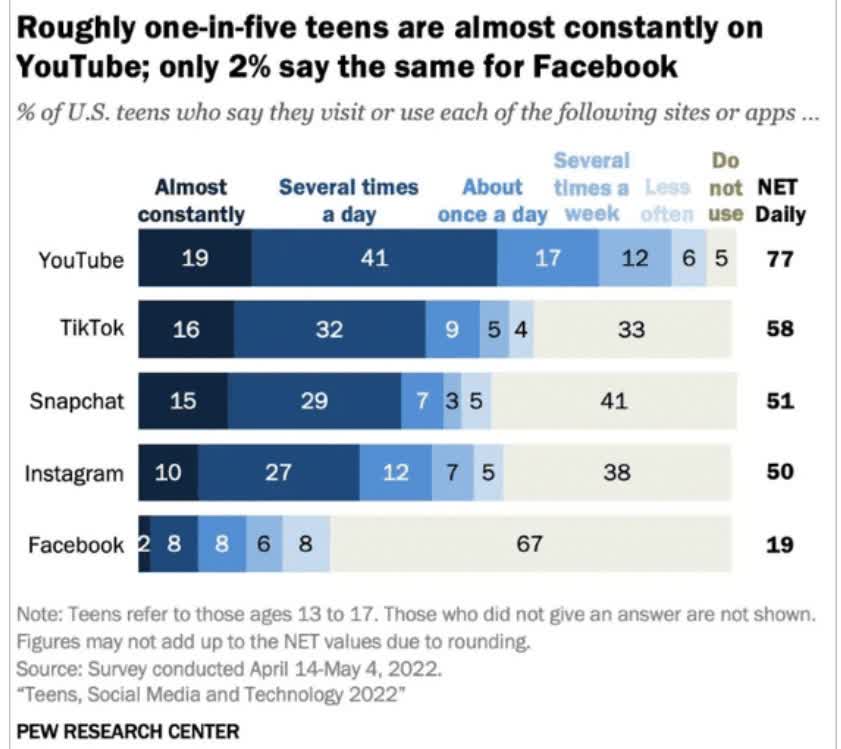
The bad news is that Facebook hasn’t been cool among young people for a long time. Today 67% of teens say they don’t use it at all, twice as many as those who don’t use TikTok.
Daily Shot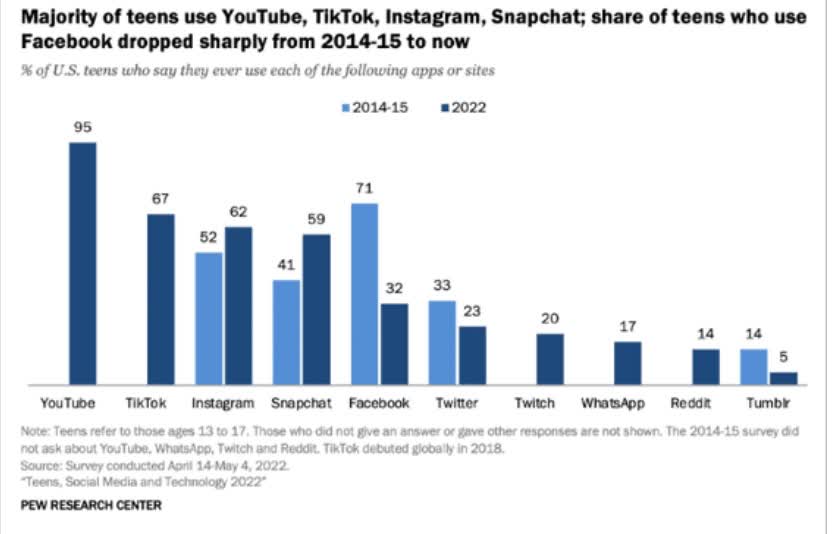
Since 2014 the number of teens that use Facebook has been cut in half, to just 32%. That’s behind Snapchat (SNAP), TikTok and YouTube, which is used by 95% of US teens.
(Source: earnings presentation)
Meta’s total user growth has stalled at just under 3 billion and now it has to contend with two other problems, one potentially existential, and the other cyclical.
- note Meta includes people signing into apps using Facebook credentials as daily users
- so these numbers aren’t nearly as impressive as they appear
Apple’s changing of the iOS privacy settings means that its phone users need to opt into tracking which has been the #1 source of data for Meta’s machine learning algorithms.
Before tracking was active by default, and now every iOS user who is tracked must choose to do so. What % of iOS users are opting into tracking and thus sharing data with Meta?
It seems that in the United States, at least, app developers and advertisers who rely on targeted mobile advertising for revenue are seeing their worst fears realized: Analytics data published this week suggests that US users choose to opt-out of tracking 96 percent of the time in the wake of iOS 14.5.” – ArsTechnica
Meta is essentially getting no more data from iOS members who make up over 50% of US smartphone users.
Or to put it another way, Meta has lost access to tracking data on half of America, its most lucrative market by far.
This puts the conversion rates and effectiveness of Facebook ads in question.
Facebook’s cost per acquisition was already rising before Apple changed its privacy policy, up 33% from 2021 to 2022.
Wordstream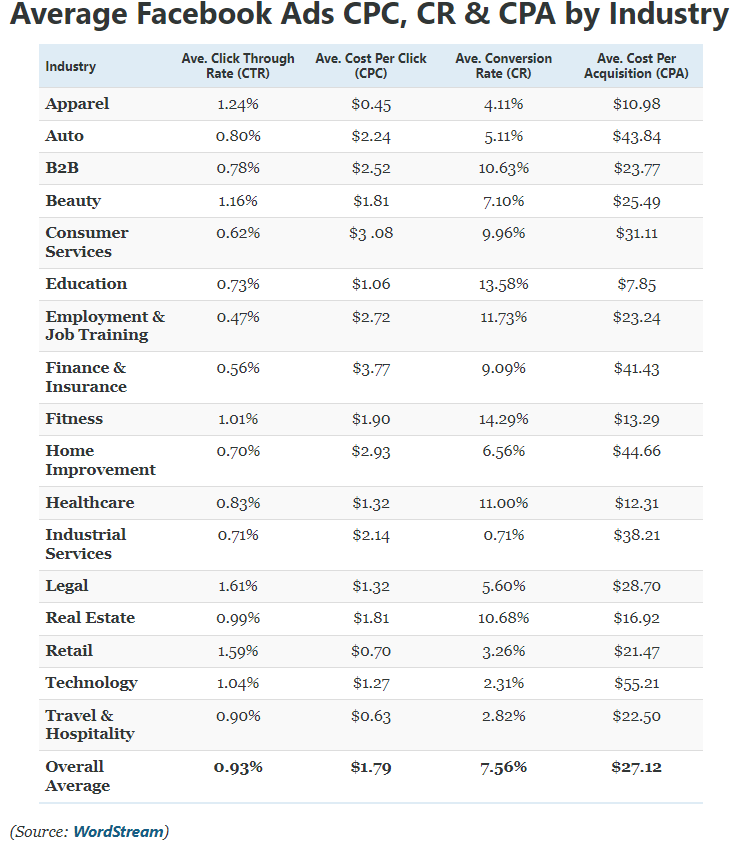
Now it’s $27.12 in the US and as high as $45 for home improvement companies.
Combined with a slowing economy and a likely recession, it’s no surprise that Meta’s average revenue per user has stalled.
earnings presentation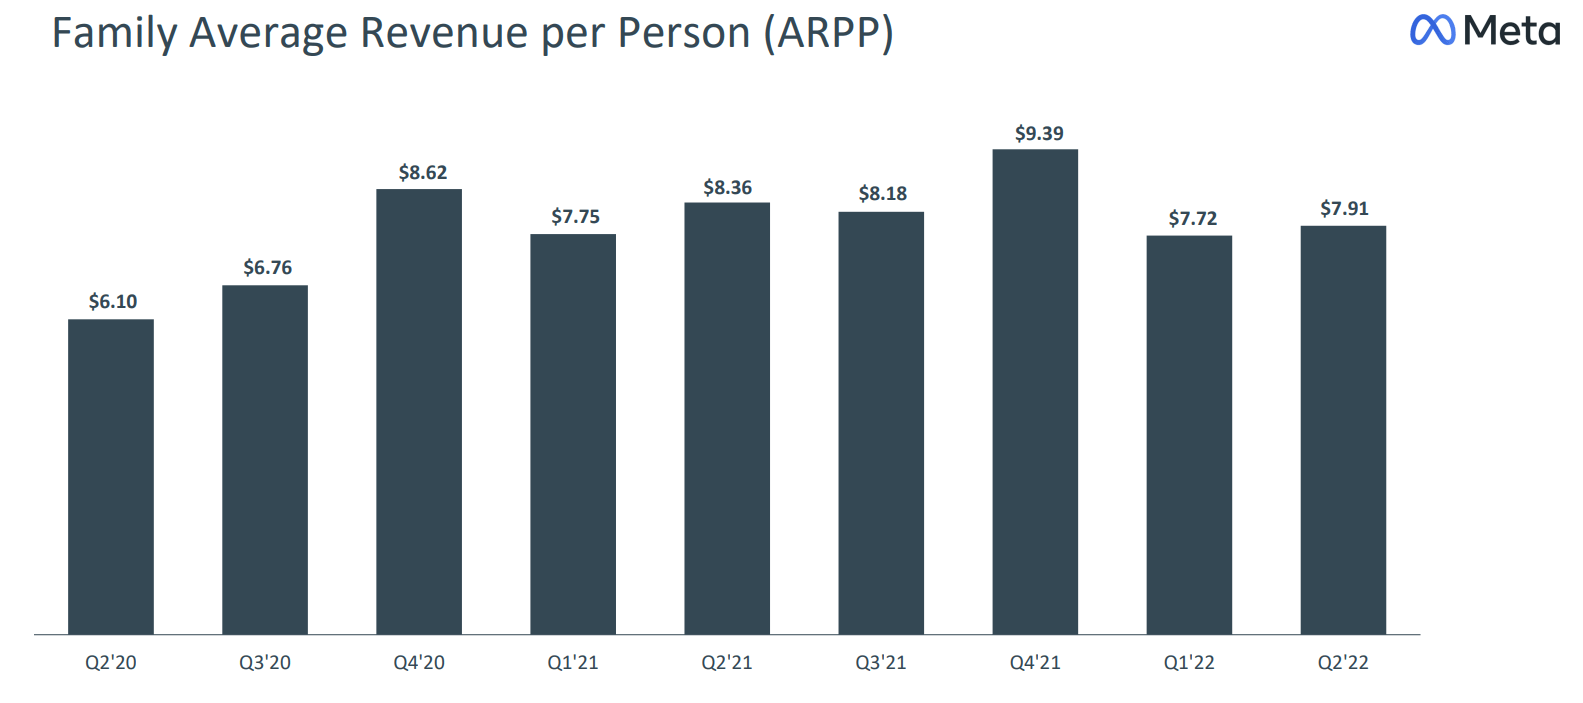
How can Meta grow its sales if users aren’t growing and revenue per user isn’t growing? Recently, it hasn’t been.
The good news? Analysts do expect ARPU to recover eventually.
(Source: FactSet Research Terminal)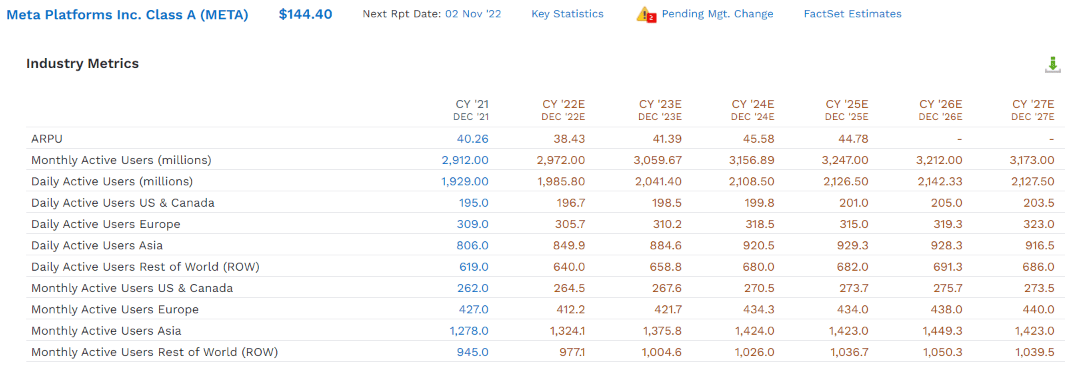
They expect users to grow from current levels, but not by much.
- 9% from 2021 levels by 2027
ARPU is expected to grow at 2.2% CAGR through 2025, basically the rate of inflation (we hope).
earnings presentation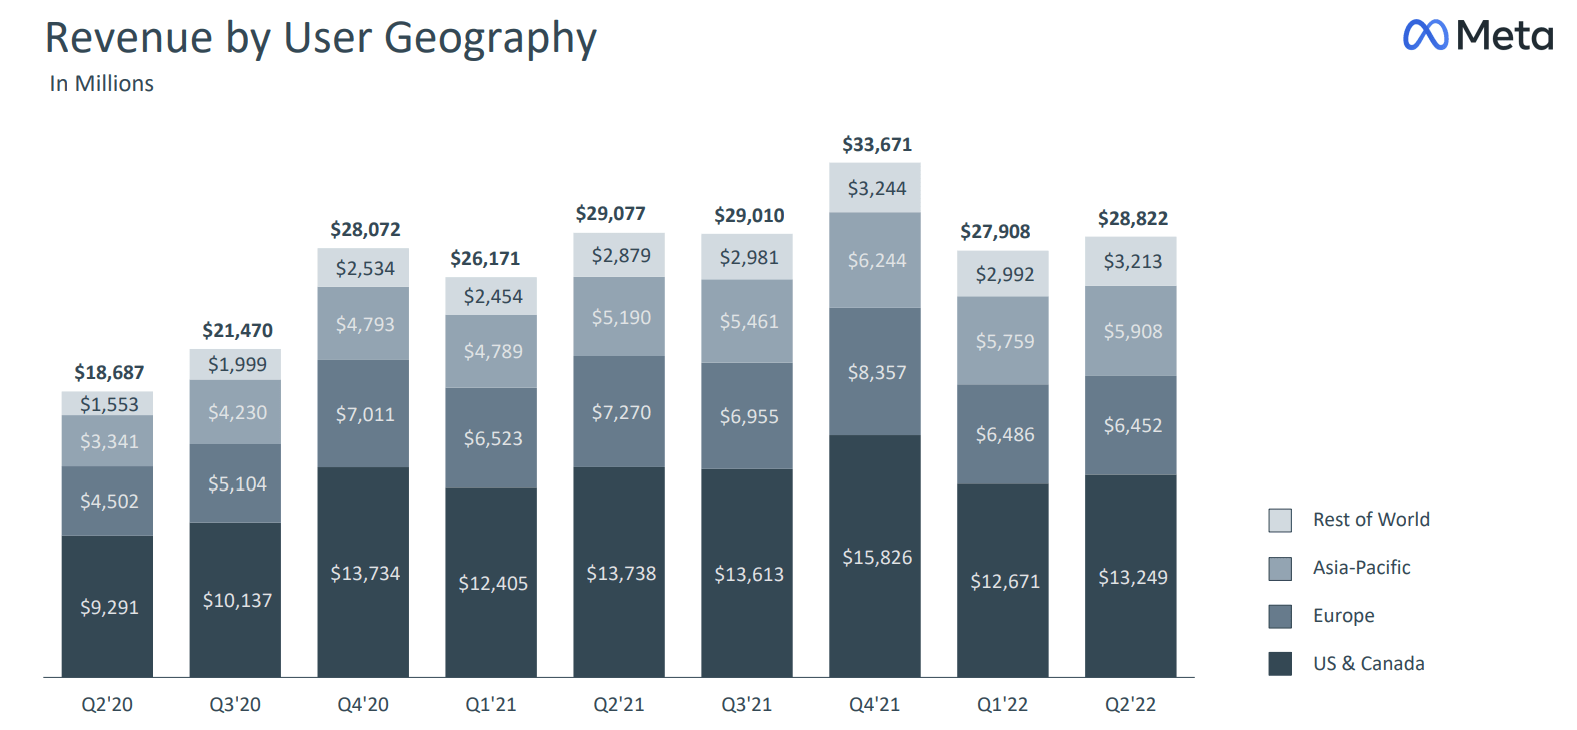
Sales growth has flatlined, but that doesn’t necessarily mean disaster for Meta.
After all, a company with flat but stable sales can still cut costs and buy back shares to drive growth.
earnings presentation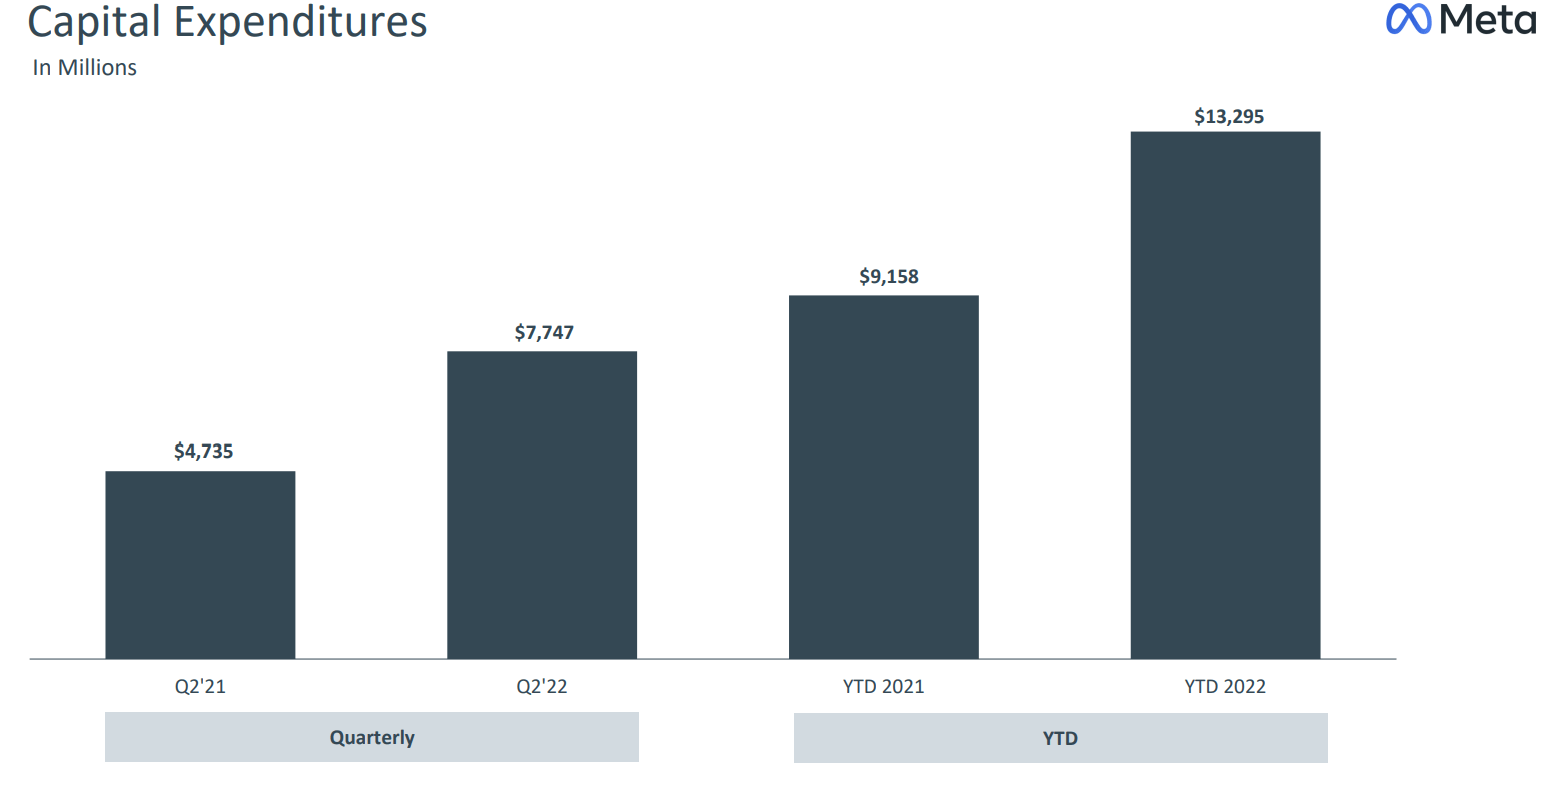
Mark Zuckerberg’s dream of a Ready Player One style Metaverse is interesting; I’ll give him that. I’d even try it out though I doubt that I would hang out with friends online that much.
The issue for Meta is that Zuckerberg is all in on his version of the Metaverse, which, thus far, few people seem actually to want. He not only changed the name of the company but also said he plans to spend a fortune (over $10 billion per year) investing in his version of the metaverse. Over $100 billion in R&D spending for a decade before the company believes it might start to see a profit from the metaverse.
Even for a thriving company like Alphabet, which is firing on all cylinders and minimally affected by Apple’s privacy policy change, $100 billion on a single bet would be a lot.
For a stagnating company whose core business model is now in question, it could prove downright reckless or even insane.
Meta Consensus Growth Spending Forecast
| Year | SG&A (Selling, General, Administrative) | R&D | Capex | Total Growth Spending | Sales | Growth Spending/Sales |
| 2021 | $23,872 | $24,655 | $18,567 | $67,094 | $117,929 | 56.89% |
| 2022 | $27,056 | $31,314 | $30,232 | $88,602 | $118,380 | 74.85% |
| 2023 | $29,804 | $34,983 | $29,910 | $94,697 | $130,940 | 72.32% |
| 2024 | $33,602 | $39,073 | $30,993 | $103,668 | $149,011 | 69.57% |
| 2025 | $36,355 | $41,988 | $31,691 | $110,034 | $167,403 | 65.73% |
| 2026 | $39,666 | $50,159 | $30,719 | $120,544 | $185,628 | 64.94% |
| 2027 | $43,570 | $55,497 | $33,279 | $132,346 | $202,390 | 65.39% |
| Annualized Growth | 10.55% | 14.48% | 10.21% | 11.99% | 9.42% | 2.35% |
| Total Spending 2022-2028 | $182,997 | $221,700 | $156,592 | $561,289 | $835,372 | NA |
(Source: FactSet Research Terminal)
Meta is expected to ramp up growth spending at 12% per year from $67 billion in 201 to $132 billion by 2027.
Meta Consensus Profit Margin Forecast
| Year | FCF Margin | EBITDA Margin | EBIT (Operating) Margin | Net Margin | Return On Capital Expansion |
Return On Capital Forecast |
| 2021 | 33.2% | 54.2% | 39.6% | 33.4% | 0.74 | |
| 2022 | 16.2% | 43.7% | 27.7% | 23.2% | TTM ROC | 56.16% |
| 2023 | 17.6% | 43.7% | 28.1% | 23.3% | Latest ROC | 42.99% |
| 2024 | 17.5% | 43.8% | 28.1% | 23.4% | 2025 ROC | 41.54% |
| 2025 | 21.2% | 46.9% | 30.1% | 24.3% | 2025 ROC | 31.80% |
| 2026 | 30.1% | 48.6% | 30.2% | 24.7% | Average | 36.67% |
| 2027 | 32.2% | 50.5% | 29.3% | 23.6% | Industry Median | 12.05% |
| 2028 | NA | NA | NA | NA | Meta/Industry Median | 3.04 |
| Annualized Growth 2022-2027 | -0.47% | -1.18% | -4.90% | -5.62% | Vs. S&P | 2.51 |
(Source: FactSet Research Terminal)
Meta’s FCF margins are expected to remain stable, though operating and net margins are expected to slide from 33% to 24%, thanks to high metaverse spending.
Its returns on capital are expected to fall 26% as a result, to a good, though hardly exceptional, 37%, 3X the industry norm.
Meta Consensus Medium-Term Growth Forecast
| Year | Sales | Free Cash Flow | EBITDA | EBIT (Operating Income) | Net Income |
| 2021 | $117,929 | $39,116 | $63,882 | $46,753 | $39,370 |
| 2022 | $118,380 | $19,142 | $51,743 | $32,837 | $27,422 |
| 2023 | $130,940 | $23,052 | $57,249 | $36,852 | $30,559 |
| 2024 | $149,011 | $26,088 | $65,222 | $41,918 | $34,907 |
| 2025 | $167,403 | $35,414 | $78,535 | $50,330 | $40,678 |
| 2026 | $185,628 | $55,833 | $90,246 | $56,052 | $45,807 |
| 2027 | $202,390 | $65,253 | $102,109 | $59,350 | $47,754 |
| Annualized Growth 2021-2027 | 9.42% | 8.90% | 8.13% | 4.06% | 3.27% |
| Cumulative 2022-2027 | $953,752 | $224,782 | $445,104 | $277,339 | $227,127 |
(Source: FactSet Research Terminal)
At the moment, Meta is a growth stock without the growth. Sure the numbers are massive in absolute terms but hardly exciting.
The one thing I can’t fault the company for is its balance sheet.
Meta Consensus Leverage Forecast
| Year | Debt/EBITDA | Net Debt/EBITDA (3 Or Less Safe According To Credit Rating Agencies) |
Interest Coverage (8+ Safe) |
| 2021 | 0.00 | -0.75 | NA |
| 2022 | 0.08 | -0.84 | 51.63 |
| 2023 | 0.07 | -0.96 | 75.67 |
| 2024 | 0.06 | -0.94 | NA |
| 2025 | 0.05 | -0.35 | NA |
| 2026 | 0.05 | -0.48 | NA |
| 2027 | 0.04 | -0.45 | NA |
| Annualized Change | NA | -8.15% | NA |
(Source: FactSet Research Terminal)
Meta has a fortress balance sheet and an AA- stable credit rating from S&P.
- 0.55% 30-year bankruptcy risk
- a 1 in 182 chance of losing all your money buying Meta today
Meta Consensus Balance Sheet Forecast
| Year | Total Debt (Millions) | Cash | Net Debt (Millions) | Interest Cost (Millions) | EBITDA (Millions) | Operating Income (Millions) |
| 2021 | $0 | $16,601 | -$47,998 | $0 | $63,882 | $46,753 |
| 2022 | $4,126 | $12,190 | -$43,607 | $636 | $51,743 | $32,837 |
| 2023 | $4,126 | $29,211 | -$54,837 | $487 | $57,249 | $36,852 |
| 2024 | $4,126 | $48,192 | -$61,309 | NA | $65,222 | $41,918 |
| 2025 | $4,126 | $41,497 | -$27,408 | NA | $78,535 | $50,330 |
| 2026 | $4,126 | $71,906 | -$42,944 | NA | $90,246 | $56,052 |
| 2027 | $4,126 | $117,317 | -$46,052 | NA | $102,109 | $59,350 |
| Annualized Growth | NA | 38.53% | -0.69% | NA | 8.13% | 4.06% |
(Source: FactSet Research Terminal)
Meta can afford to make a lot of mistakes without risking the company’s future survival.
That’s the good news. The bad news is that thanks to much higher growth spending, which is rather speculative at the moment, Meta’s operating profits are expected to grow at an anemic rate of 4% in the coming years.
What about buybacks? Can’t that help boost growth?
Meta Consensus Buyback Potential Forecast
| Year | FCF/Share Consensus | Retained (Post-Dividend) Free Cash Flow | Buyback Potential | Debt Repayment Potential |
| 2022 | $6.19 | $16,694 | 4.31% | NA |
| 2023 | $7.99 | $21,549 | 5.56% | 522.3% |
| 2024 | $10.69 | $28,831 | 7.44% | 698.8% |
| 2025 | $13.74 | $37,057 | 9.56% | 898.1% |
| 2026 | $21.43 | $57,797 | 14.91% | 1400.8% |
| 2027 | $25.14 | $67,803 | 17.49% | 1643.3% |
| Total 2022 Through 2024 | $85.18 | $229,730.46 | 59.27% | 5567.87% |
| Annualized Rate | 26.3% | 26.3% | 26.3% | NA |
(Source: FactSet Research Terminal)
Meta is expected to generate $230 billion in free cash flow through 2027 that could theoretically buy back up to 60% of shares at current valuations.
Meta Consensus Buyback Forecast
| Year | Consensus Buybacks ($ Millions) | % Of Shares (At Current Valuations) | Market Cap |
| 2022 | $24,408 | 6.3% | $387,571 |
| 2023 | $19,904 | 5.1% | $387,571 |
| 2024 | $21,845 | 5.6% | $387,571 |
| 2025 | $32,014 | 8.3% | $387,571 |
| 2026 | $39,083 | 10.1% | $387,571 |
| 2027 | $45,677 | 11.8% | $387,571 |
| Total 2022 through 2024 | $182,931 | 47.2% | $387,571 |
| Annualized Rate | 8.4% | Average Annual Buybacks | $30,489 |
| 1% Buyback Tax | $1,829 | Average Annual Buyback Tax | $305 |
(Source: FactSet Research Terminal)
Analysts expect Meta to buy back $182 billion in shares over the next six years, averaging $30 billion annually. At today’s valuations, that could repurchase 8% of its shares each year.
What about long-term growth? What do the 56 analysts covering Meta think it can grow in the long-term, including its big bet on the metaverse and epic buybacks?
(Source: FactSet Research Terminal)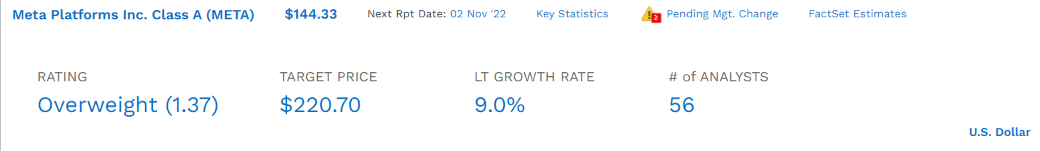
$561 billion in growth spending, 20% of which is expected to be on the unproven metaverse, $182 billion in buybacks, and this 3 billion user social media platform is expected to grow at 9% over time.
I don’t know about you, but no dividend and single-digit consensus return potential doesn’t make me overly excited as a Meta shareholder.
Why Meta Can Make You Money, While Adobe Can Potentially Make You Rich
The good news for potential and current investors in both Adobe and Meta, is that they are very attractively priced.
Adobe Valuation Matrix
| Metric | Historical Fair Value Multiples (all-Years) | 2021 | 2022 | 2023 | 2024 |
12-Month Forward Fair Value |
| Earnings | 33.02 | $415.39 | $456.67 | $526.67 | $607.24 | $509.17 |
| Average | $415.39 | $456.67 | $526.67 | $607.24 | $509.17 | |
| Current Price | $293.69 | |||||
|
Discount To Fair Value |
29.30% | 35.69% | 44.24% | 51.64% | 42.32% | |
| Upside To Fair Value | 41.44% | 55.49% | 79.33% | 106.76% | 73.37% | |
| 2022 PE | 2023 PE | 2021 Weighted EPS | 2022 Weighted EPS | 12-Month Forward PE | 12-Month Average Fair Value Forward PE |
Current Forward PE |
| $13.83 | $15.95 | $3.46 | $11.96 | $15.42 | 33.0 | 19.0 |
(Source: DK Research Terminal, FAST Graphs)
Adobe is historically worth 33X earnings, and today trades at just 19X.
- 14.6X cash-adjusted earnings
- PEG of 0.94 = growth at a reasonable price
Adobe is historically 42% undervalued and a 73% total return within a year would be justified by fundamentals.
|
Analyst Median 12-Month Price Target |
Morningstar Fair Value Estimate |
| $383.70 (24.1 P/E) | $450 (29.2 P/E) |
|
Discount To Price Target (Not A Fair Value Estimate) |
Discount To Fair Value |
| 23.46% | 34.74% |
|
Upside To Price Target (Not Including Dividend) |
Upside To Fair Value (Not Including Dividend) |
| 30.65% | 53.22% |
(Source: FactSet Research Terminal, Morningstar)
Analysts think that ADBE will deliver 31% total returns in the next year alone, and Morningstar estimates its 35% undervalued.
| Rating | Margin Of Safety For Very Low Risk 13/13 Quality Ultra SWANs | 2022 Fair Value Price | 2023 Fair Value Price |
12-Month Forward Fair Value |
| Potentially Reasonable Buy | 0% | $456.67 | $526.67 | $509.17 |
| Potentially Good Buy | 5% | $433.84 | $500.34 | $483.71 |
| Potentially Strong Buy | 15% | $388.17 | $447.67 | $432.79 |
| Potentially Very Strong Buy | 25% | $325.38 | $395.00 | $381.88 |
| Potentially Ultra-Value Buy | 35% | $296.84 | $342.33 | $330.96 |
| Currently | $293.90 | 35.64% | 44.20% | 42.28% |
| Upside To Fair Value (Not Including Dividends) | 55.38% | 79.20% | 73.25% |
(Source: DK Research Terminal, FAST Graphs)
For anyone comfortable with its risk profile, Adobe is a potential Ultra Value buy.
- a table-pounding, Buffett-style fat pitch
Meta Valuation Matrix
| Metric | Historical Fair Value Multiples (6-Years) | 2021 | 2022 | 2023 | 2024 | 2025 |
12-Month Forward Fair Value |
| Earnings | 25.18 | $346.73 | $252.05 | $282.77 | $331.62 | $424.03 | |
| Average | $346.73 | $252.05 | $282.77 | $331.62 | $424.03 | $275.09 | |
| Current Price | $144.31 | ||||||
|
Discount To Fair Value |
58.38% | 42.75% | 48.97% | 56.48% | 65.97% | 47.54% | |
| Upside To Fair Value | 140.27% | 74.66% | 95.95% | 129.80% | 193.83% | 90.63% | |
| 2022 EPS | 2023 EPS | 2022 Weighted EPS | 2023 Weighted EPS | 12-Month Forward EPS | 12-Month Average Fair Value Forward PE |
Current Forward P/E |
|
| $10.01 | $11.23 | $2.50 | $8.42 | $10.93 | 25.2 | 13.2 |
(Source: DK Research Terminal, FAST Graphs)
- Meta is historically 48% undervalued (for periods of 9% growth)
- 13.2X earnings
- 6.4X cash-adjusted earnings = anti-bubble valuation
|
Analyst Median 12-Month Price Target |
Morningstar Fair Value Estimate |
| $220.70 (20.2 P/E) | $346.00 (31.7 P/E) |
|
Discount To Price Target (Not A Fair Value Estimate) |
Discount To Fair Value |
| 34.44% | 58.18% |
|
Upside To Price Target |
Upside To Fair Value |
| 52.53% | 139.13% |
(Source: DK Research Terminal, FactSet, Morningstar)
There is no disagreement that Meta is dirt cheap. In fact, it’s an anti-bubble blue-chip trading at 6.4X cash-adjusted earnings.
- pricing in -4.2% CAGR growth
As long as Meta grows faster than 0% it’s almost mathematically impossible for long-term investors to lose money.
| Rating | Margin Of Safety For Medium Risk Speculative 11/13 Quality SWANs | 2022 Fair Value Price | 2023 Fair Value Price |
12-Month Forward Fair Value |
| Potentially Reasonable Buy | 0% | $252.05 | $282.77 | $275.09 |
| Potentially Good Buy | 20% | $201.64 | $226.22 | $220.07 |
| Potentially Strong Buy | 30% | $176.44 | $197.94 | $192.56 |
| Potentially Very Strong Buy | 40% | $120.98 | $169.66 | $165.05 |
| Potentially Ultra-Value Buy | 50% | $126.03 | $141.39 | $137.55 |
| Currently | $144.57 | 42.64% | 48.87% | 47.45% |
| Upside To Fair Value (Not Including Dividends) | 74.35% | 95.59% | 90.28% |
(Source: DK Research Terminal, FAST Graphs)
For anyone comfortable with its risk profile, Meta is a potential very strong speculative buy.
Adobe 2024 Consensus Return Potential
(Source: FAST Graphs, FactSet)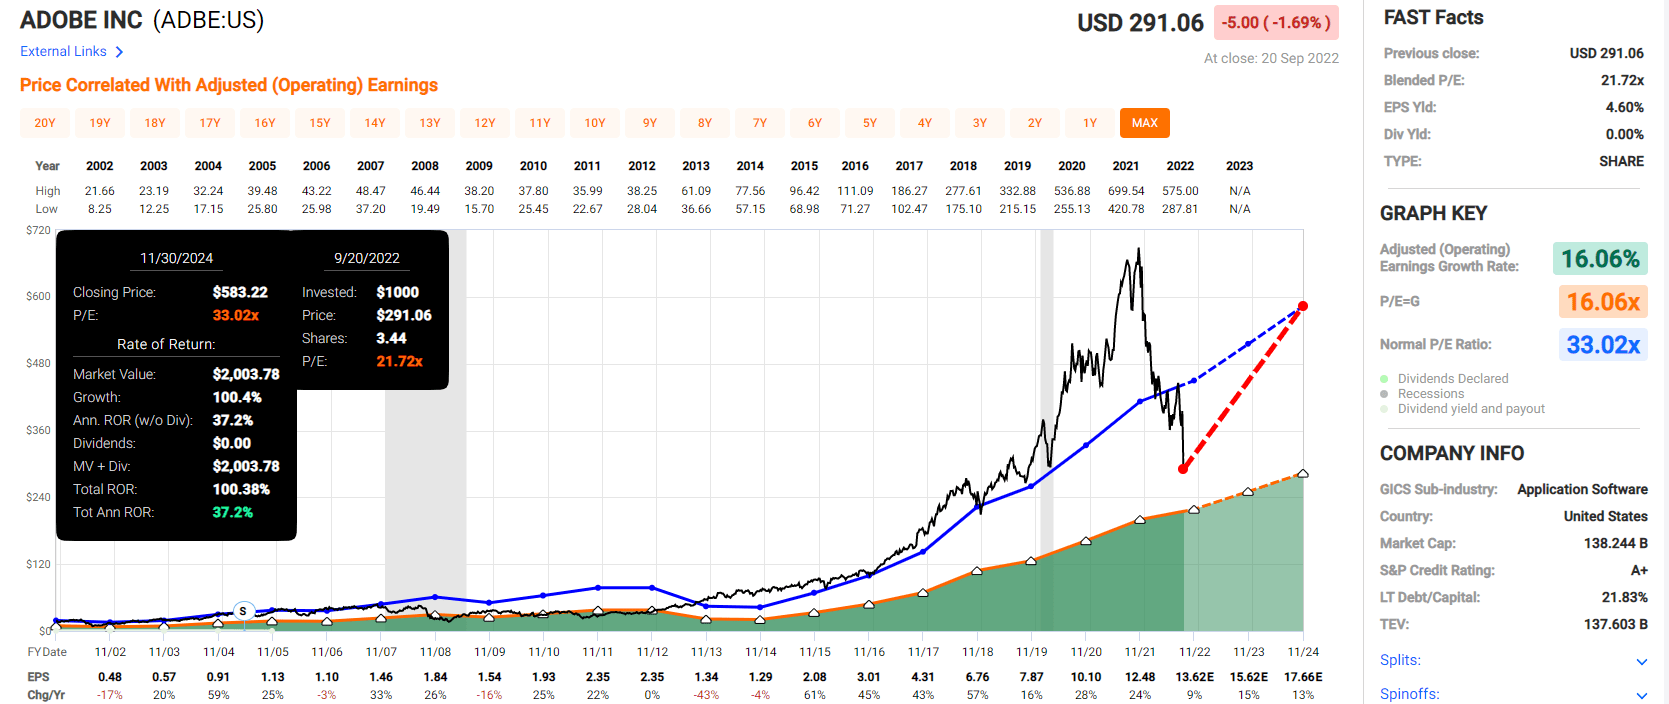
Adobe 2027 Consensus Return Potential
(Source: FAST Graphs, FactSet)
If Adobe grows as expected and returns to historical fair value, then it could double by 2024 and triple by 2027.
- Buffett-like return 26% CAGR return potential through 2027
Meta 2024 Consensus Return Potential
(Source: FAST Graphs, FactSet)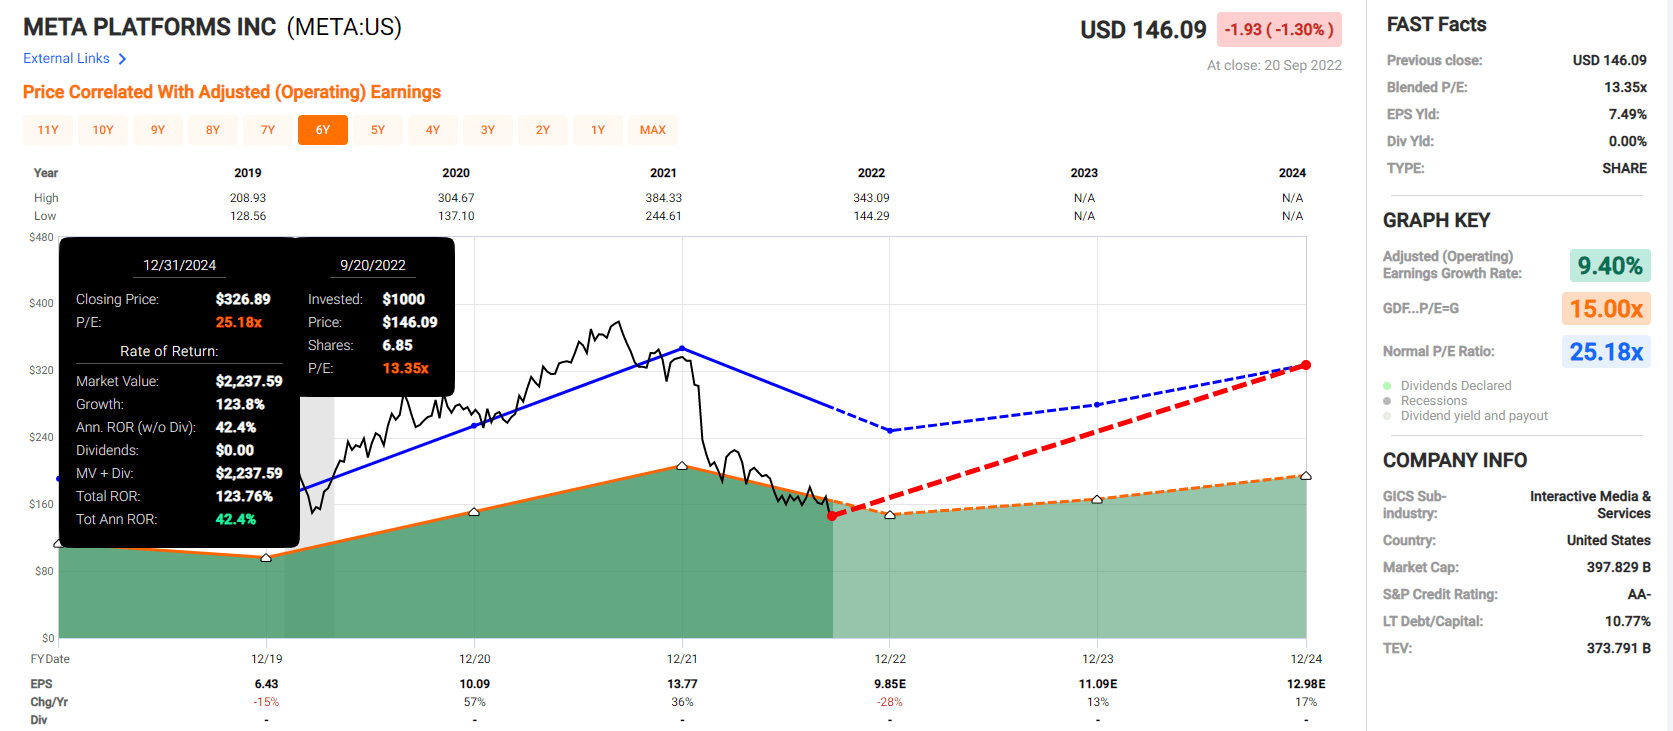
Meta 2027 Consensus Return Potential
(Source: FAST Graphs, FactSet)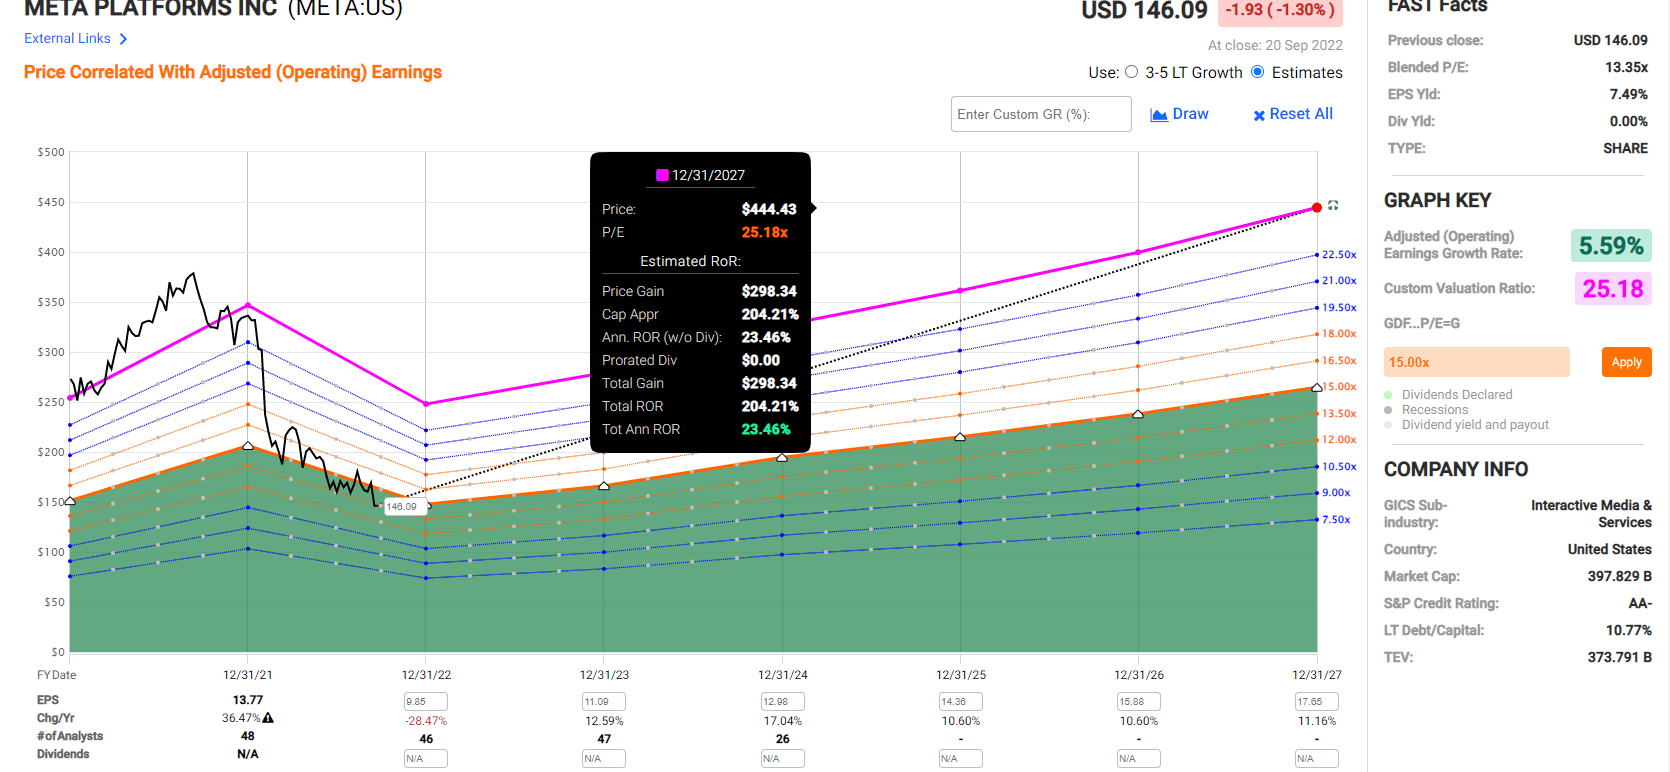
If Meta grows as expected and returns to historical fair value for periods of 9% growth, it could triple in five years, delivering Buffett-like 24% annual returns.
Now let’s compare these incredible return potentials to the S&P 500.
S&P 500 2024 Consensus Return Potential
(Source: FAST Graphs, FactSet)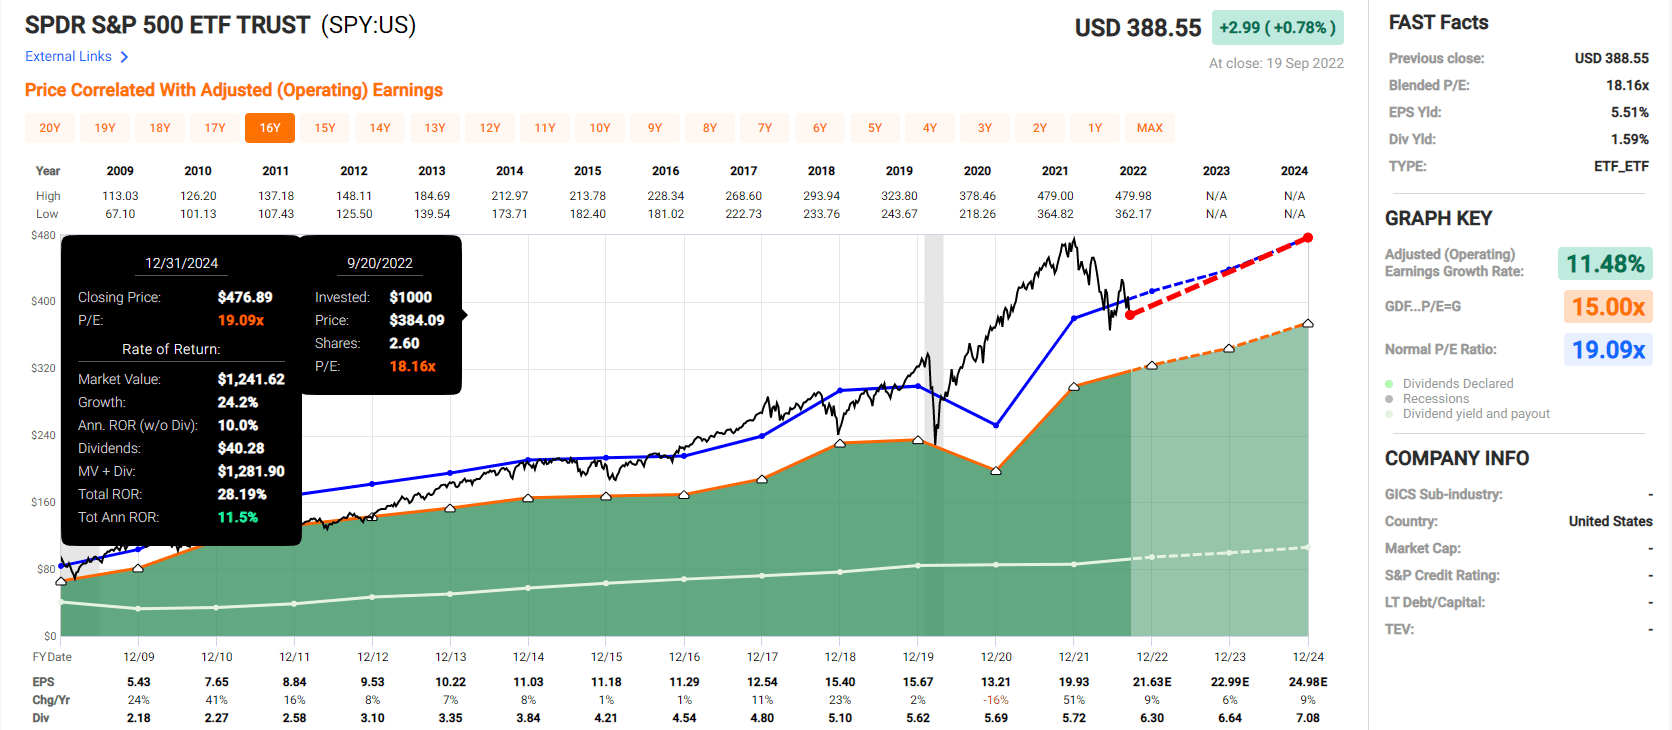
Analysts expect 12% annual returns from the S&P 500 through 2024.
S&P 500 2027 Consensus Total Return Potential
| Year | Upside Potential By End of That Year | Consensus CAGR Return Potential By End of That Year | Probability-Weighted Return (Annualized) |
Inflation And Risk-Adjusted Expected Returns |
| 2027 | 56.61% | 9.39% | 7.04% | 4.71% |
(Source: DK S&P 500 Valuation & Total Return Tool)
They expect 57% returns over the next five years.
- Adobe has 5X the return potential of the S&P 500
- Meta has 4X the return potential of the S&P 500
What about long-term returns?
| Investment Strategy | Yield | LT Consensus Growth | LT Consensus Total Return Potential | Long-Term Risk-Adjusted Expected Return | Long-Term Inflation And Risk-Adjusted Expected Returns | Years To Double Your Inflation & Risk-Adjusted Wealth |
10-Year Inflation And Risk-Adjusted Expected Return |
| Adobe | 0.0% | 15.5% | 15.5% | 10.9% | 10.9% | 6.6 | 2.80 |
| Meta | 0.0% | 9.0% | 9.0% | 6.3% | 6.3% | 11.4 | 1.84 |
| High-Yield (SCHD) | 3.4% | 8.7% | 12.1% | 8.5% | 6.2% | 11.7 | 1.82 |
| Dividend Aristocrats | 2.4% | 8.6% | 11.0% | 7.7% | 5.4% | 13.4 | 1.69 |
| S&P 500 | 1.7% | 8.5% | 10.2% | 7.1% | 4.9% | 14.8 | 1.61 |
| Nasdaq | 0.9% | 11.8% | 12.7% | 8.9% | 6.6% | 10.9 | 1.89 |
(Source: DK Research Terminal, Morningstar, FactSet, YCharts)
Adobe is expected to keep delivering its historically Nasdaq, Aristocrats, and S&P smashing returns.
Meta is expected to underperform the market, aristocrats, SCHD, and REITs (9.2% return potential).
Inflation-Adjusted Consensus Return Potential: $1,000 Initial Investment
| Time Frame (Years) | 7.9% CAGR Inflation-Adjusted S&P 500 Consensus | 6.7% Inflation-Adjusted Meta Consensus | 13.2% CAGR Inflation-Adjusted Adobe Consensus | Difference Between Inflation-Adjusted Adobe Consensus And Meta Consensus |
| 5 | $1,461.18 | $1,383.65 | $1,859.62 | $475.97 |
| 10 | $2,135.06 | $1,914.48 | $3,458.18 | $1,543.70 |
| 15 | $3,119.71 | $2,648.97 | $6,430.90 | $3,781.93 |
| 20 | $4,558.47 | $3,665.24 | $11,959.03 | $8,293.79 |
| 25 | $6,660.75 | $5,071.40 | $22,239.23 | $17,167.83 |
| 30 | $9,732.58 | $7,017.03 | $41,356.49 | $34,339.46 |
(Source: DK Research Terminal, FactSet)
If you ignore valuation entirely (it cancels out over 30+ years), then Adobe’s 2X better inflation-adjusted return potential could deliver far superior wealth compared to Meta.
| Time Frame (Years) | Ratio Adobe Consensus/Meta Consensus |
| 5 | 1.34 |
| 10 | 1.81 |
| 15 | 2.43 |
| 20 | 3.26 |
| 25 | 4.39 |
| 30 | 5.89 |
(Source: DK Research Terminal, FactSet)
In fact, Adobe could potentially double Meta’s returns over the next decade and beat it by 6X over the next three decades.
Bottom Line: Meta Offers Growth At A Reasonable Price, But Adobe Is The Superior Choice For Growth Investors Today
I understand why both Adobe and Meta have their ardent supporters.
Historical Returns Since June 2012
Portfolio Visualizer Premium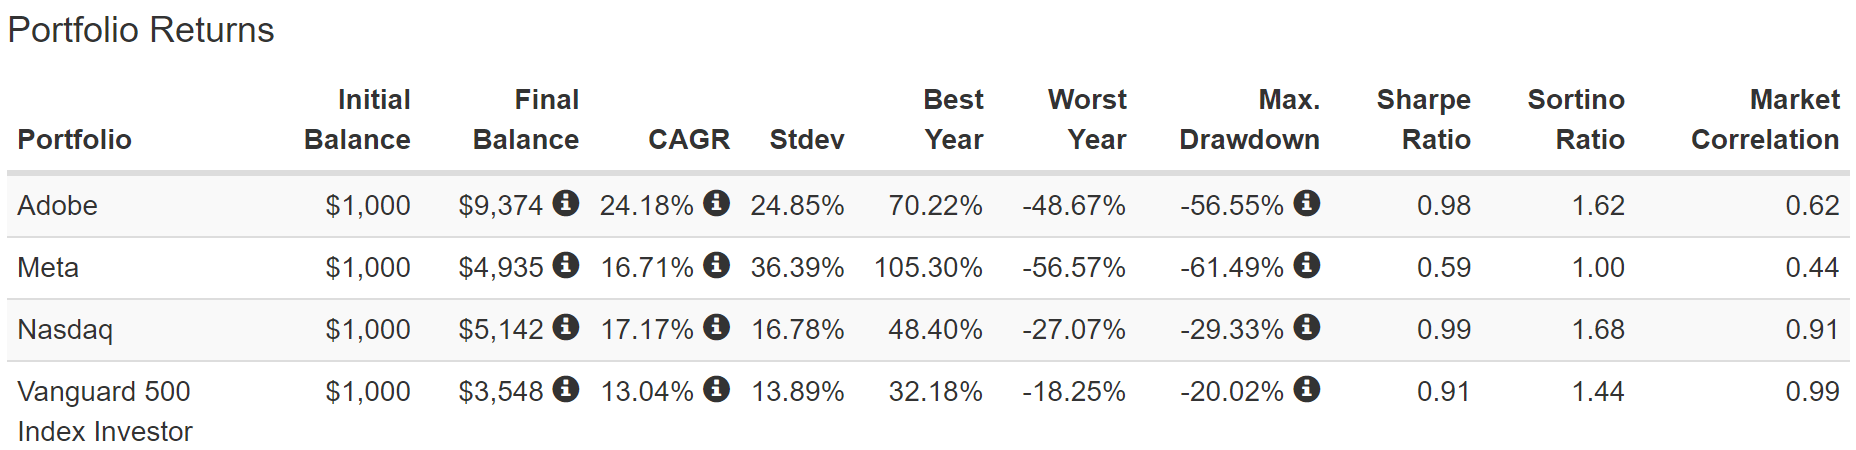
Even with both companies in severe bear markets, long-term investors have been handsomely rewarded for buying and holding both.
And with both tech titans offering a potential triple over the next five years, I can’t fault anyone who wants to buy either of them.
Adobe Investment Decision Score
DK (Source: Dividend Kings Automated Investment Decision Tool)
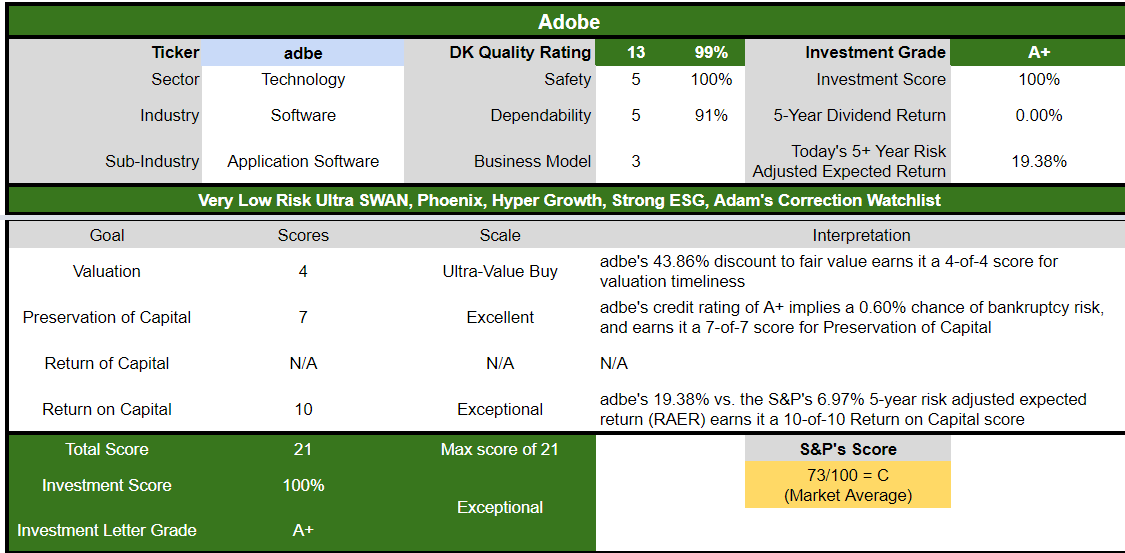
(Source: Dividend Kings Automated Investment Decision Tool)
Adobe is as close to a perfect hyper-growth Ultra SWAN investment opportunity for anyone comfortable with its risk profile.
- 44% discount vs. 3% market discount = 41% better valuation
- 50% better long-term annual return potential
- 3X better risk-adjusted expected return over the next five years
Meta Investment Decision Score
(Source: Dividend Kings Automated Investment Decision Tool)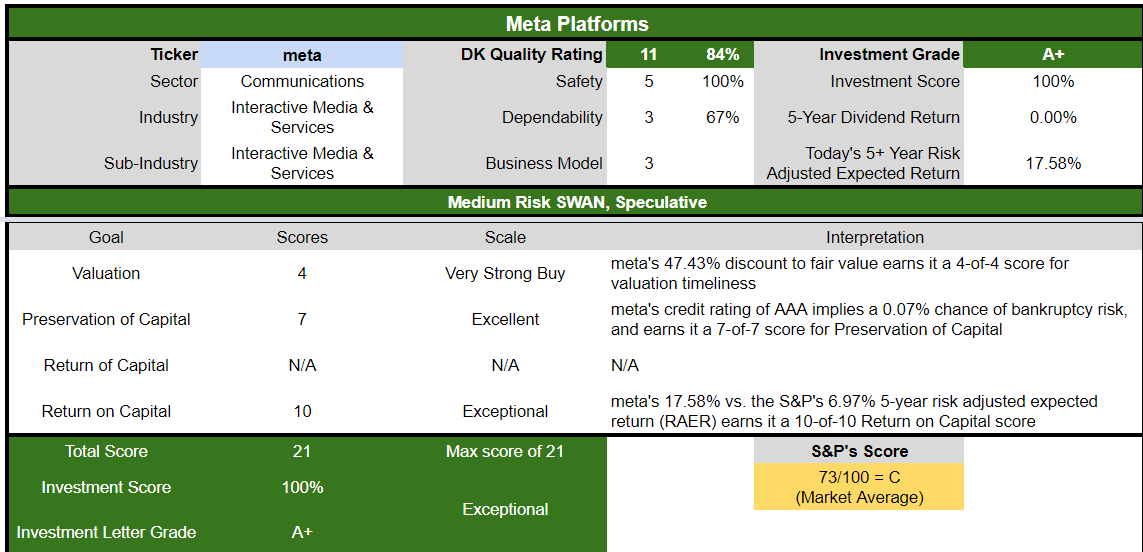
(Source: Dividend Kings Automated Investment Decision Tool)
Meta is as close to a perfect speculative anti-bubble turnaround story as you can find if you’re comfortable with its risk profile.
- 47% discount vs. 3% market discount = 44% better valuation
- 3X better risk-adjusted expected return over the next five years
However, today I think it’s clear that Adobe is the better company for all but deep value investors who love anti-bubble blue chips.
Adobe has superior:
- quality
- management
- is a thriving business, while Meta is a speculative turnaround story
- growth potential
- long-term return potential (15.5% vs. 9%)
- short-term return potential (25% CAGR vs 24% CAGR)
If you want to own a hyper-growth tech stock to help boost income over time (through rebalancing), then you need a company that’s growing quickly.
At the moment, that’s not Meta, and analysts are skeptical of its big pivot into the metaverse.
With Adobe, you can question the $20 billion they are paying for Figma, but it’s hard to argue that it’s not a superior quality company growing much faster.
Based on the best available evidence, if you’re looking to deep value bargain hunt in this bear market, I currently recommend Adobe over Meta.
Because based on the best available data we have, I can say with some confidence that, while both Meta and Adobe can make you a lot of money in the coming years, it’s Adobe that could potentially make you rich.
Be the first to comment