


simon2579/E+ via Getty Images
Introduction
We revisit our Admiral Group PLC (OTCPK:AMIGY) investment case after shares fell to their lowest level since March 2020.
Admiral’s share price has now fallen by 43.3% since their peak in August 2021. Compared to October 2020, when we upgraded our rating to Buy, shares have lost 10.5% (in GBP and after dividends).
|
Admiral Share Price (Last 5 Years) 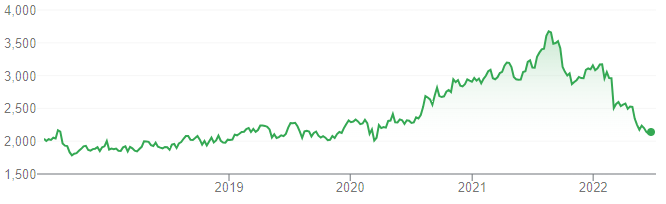 Source: Google Finance (22-Jun-22). |
We believe sector developments have been positive since our last update in March. The pricing cycle in U.K. motor insurance has started to turn, albeit unevenly and with price increases lagging claim cost inflation. We expect price increases to accelerate later in the year, which should benefit Admiral. Its main competitors have flat or declining market share. We expect Admiral earnings to be resilient against recessions and inflation.
Relative to pre-COVID 2019 financials, Admiral shares are trading at a 14.1x P/E and a 6.7% Dividend Yield. Our forecasts indicate a total return of 91% (23.0% annualized) by December 2025. Buy.
Admiral Buy Case Recap
Admiral is a U.K. insurer with a market capitalization of £6.3bn ($7.7bn). It generates most of its Profit Before Tax (“PBT”) in U.K. Motor insurance, where it is the market leader. It also offers household insurance, travel insurance and personal loans, and has small presences in Italy, France, Spain and the U.S.:
|
Admiral PBT By Business (2014-21) 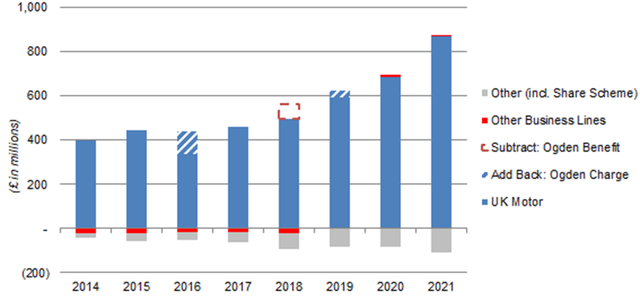 Source: Admiral company filings. |
Our investment case centres around the U.K. Motor business, where:
- The sector has continued to grow structurally, with the number of vehicles historically increasing at 1-2% annually, and premiums rising over time due to growing claim costs for both vehicles and medical treatment
- Admiral has continued to gain market share and generate solid profits because its lower Expense Ratio (from scale and efficiency) enables it to offer insurance at lower prices than competitors but achieve higher profits
- Admiral’s growth differs during different parts of the insurance cycle, but we believe it can achieve a high-single-digit EPS CAGR. During 2015-19, which we believe represent an entire cycle, U.K. Motor had CAGRs of 6.8% in vehicles and 8.2% in both total premiums and profits
- 2022 regulatory reforms requiring insurers to offer the same prices to new and existing customers will lead to higher pricing on new business, improve sector profitability and entrench leaders like Admiral
Admiral’s other businesses are small and generated just £5.2m in Pre-Tax Profit (“PBT”) in aggregate in 2021; some are loss-making. They can potentially create significant value in the long term, but this is not in our investment case.
COVID-19 boosted profitability for the whole motor insurance sector, because less driving meant fewer accidents, more than offsetting lower premiums and higher cost inflation. Admiral’s group PBT grew 52% between 2019 and 2021, primarily driven by higher profits in U.K. Motor. However, since 2021, driving frequency has begun to normalize while claim cost inflation has become even more elevated, creating pressure on industry profits.
Developments in U.K. motor insurance in the past few months have been consistent with our investment case.
U.K. Motor Insurance Pricing Recovery
Multiple datapoints indicate that pricing in U.K. motor insurance has started to recover.
U.K. Consumer Price Index (“CPI”) data released by the Office for National Statistics today (June 22) shows that U.K. Motor Vehicle Insurance pricing was up by 8.8% year-on-year in May, accelerating from 8.1% in April, and compared to a decline of 13.4% in May 2021:
|
U.K. CPI Year-on-Year – Motor Vehicle Insurance 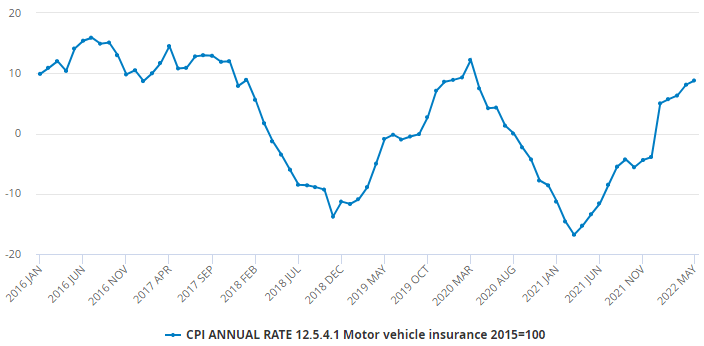 Source: Office for National Statistics (22-Jun-22). |
Other datapoints are less up-to-date, but still show the start of a pricing recovery in Q1 2022.
The Willis Towers Watson Confused Car Insurance Price Index, which tracks prices quoted for new policies only, showed that the average premium has increased 2.2% year-on-year and 4.0% sequentially in Q1 2022:
|
Willis Towers Watson Confused Car Insurance Price Index (Since Q2 2018) 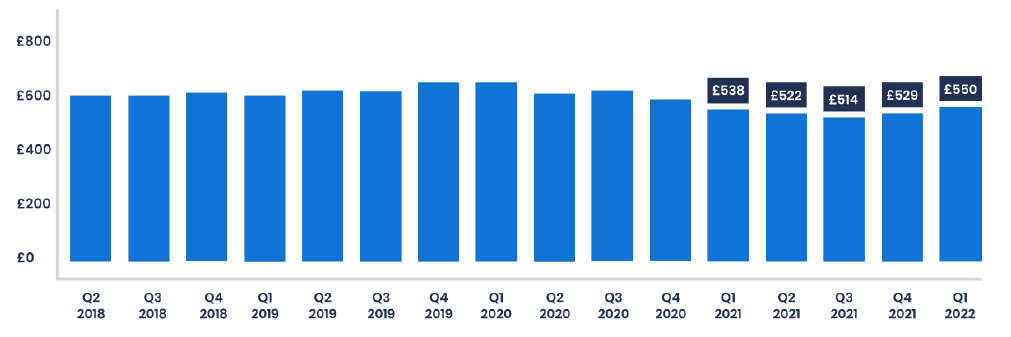 Source: Willis Towers Watson (05-May-22). |
Data released by the Association of British Insurers (“ABI”) showed that the average premium for a new motor policy rose 7.6% year-on-year (by £34 to £480) in Q1 2022. The average premium for a renewed motor policy, however, fell 17% year-on-year (by £55 to £375), which means the overall average premium fell 5% year-on-year (to £416). (Overall average premium was £440 in Q4 2021 and £429 in Q3 2021.) The divergence between new and renewed policies is likely due to government reforms that require insurers to offer the same prices to new and renewing customers since January.
Direct Line (OTCPK:DIISY), Admiral’s largest competitor in U.K. Motor, reported in May that new business pricing in U.K. motor insurance “increased by mid-single-digits early in January and were flat through the rest of the quarter”, before “two or three big players put through a couple of points (of further pricing increases) in April”.
Increases in U.K. motor insurance pricing have certainly started. While they are uneven and still lag claim costs inflation (estimated to be at approx. 10%), we believe it is only a matter of time before they accelerate sufficiently to catch up.
Competitors’ Flat or Declining Market Shares
Admiral has historically been a market share gainer in U.K. motor insurance. This is likely to have continued in 2022 so far.
|
U.K. Motor Insurance Policy Numbers by Provider (2012-21) 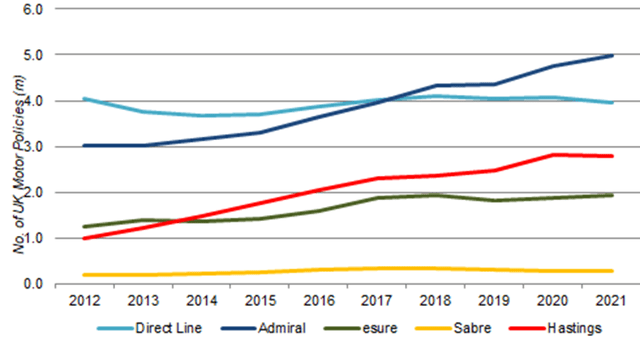 Source: Company filings. NB. Hastings and Sabre figures include estimates. |
Direct Line’s total policy count fell 1.4% year-on-year in Q1 2022, continuing its long-term market share decline:
|
Direct Line U.K. Motor Policy Count & Premiums (Q1 2022 vs. Prior Years) 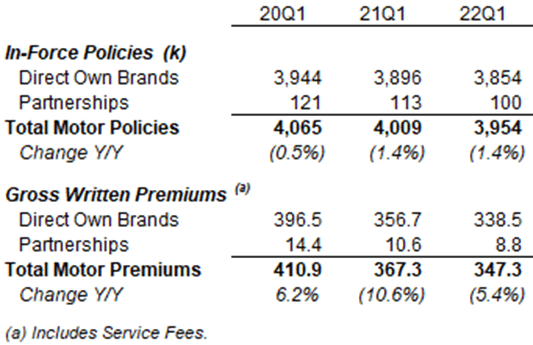 Source: Direct Line company filings. |
Hastings, now part of Sampo (OTCPK:SAXPY), reported a Q1 2022 market share in U.K. Motor that was flat year-on-year (at 8.3%) and down slightly from 8.4% at Q4 2021.
Sabre Insurance (OTC:SBIGY) had good growth in Q1, but it is not a direct competitor to Admiral, being smaller and specialising in “non-standard” insurance. Sabre reported a year-on-year gain in policy count of 51k (18%), but most (45k) of these were in motorcycle policies, which are not a core market for Admiral.
Most of Admiral’s other competitors do not disclose their financials in sufficient detail, being either privately-owned (including esure) or small subsidiaries of large public companies.
Pricing To Accelerate & Benefit Admiral
We expect price increases to further accelerate later in the year, which should benefit Admiral.
We have seen it in the last “up” cycle in 2015-17 how price increases in U.K. motor insurance can start at a relatively small level and then accelerate to double-digits, with the “up” cycle lasting as much as two years:
|
U.K. Motor Insurance Premiums Year-on-Year Change (2014-19) 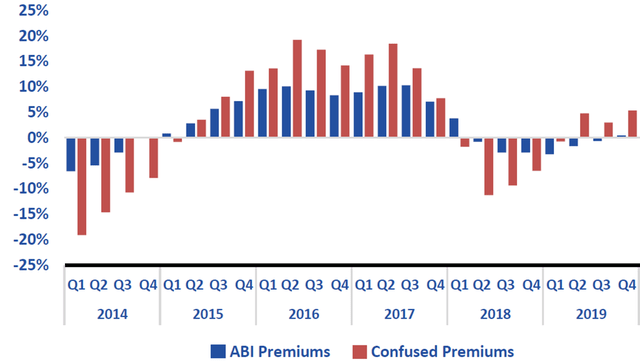 Source: Admiral results presentation (H1 2020). |
Admiral has been a key beneficiary of such “up” cycles, as it can gain significant market share by increasing prices less quickly than competitors, though this also means a delay before its earnings also expand significantly.
In the last “up” cycle, Admiral grew its U.K. Motor vehicle count by close to 10% for 3 years in 2016-18, though the business’ PBT was initially flat in 2016 and up only 4.2% in 2017, before expanding 21.7% in 2018:
|
Admiral UK Motor Growth Rates (2015-19) 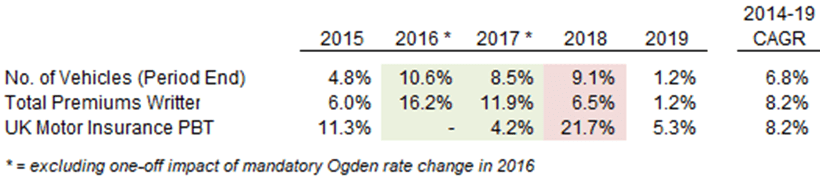 Source: Admiral company filings. |
We expect to see a similar acceleration in Admiral’s growth in U.K. motor in the next few years.
Resilience Against Recessions & Inflation
Admiral earnings should be resilient against recessions and inflation.
This was demonstrated by the Global Financial Crisis, when Admiral continued growing its vehicle count, premiums and PBT in U.K. motor every year through 2008-10:
|
Admiral UK Motor Key Performance Indicators (2004-11) 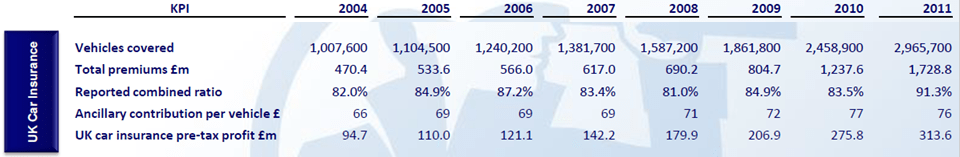 Source: Admiral results presentation (2011). |
Admiral’s U.K. motor business is now more than three times as large as it was before 2008, so we do not expect the same level of growth at the next downturn. However, we expect volumes to still be resilient – people may drive less or trade down to cheaper vehicles in a recession, but they are legally required to buy car insurance as long as they have a vehicle, and Admiral can offer the most attractive prices because of its cost advantage.
Admiral is also better-placed than its competitors in dealing with inflation, thanks to its consistently lower Expense Ratio and economies of scale, which gives it greater bargaining power against suppliers.
Admiral Benefits From Higher Interest Rates
Higher interest rates should generate a small benefit for Admiral through its Investment Income.
Admiral’s investment portfolio is predominantly in fixed income instruments, with 50% having maturities of less than one year and another 10% having maturities of 1-2 years:
|
Admiral Financial Investments (2021) 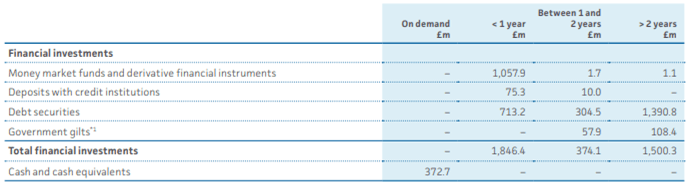 Source: Admiral annual report (2021) Source: Admiral annual report (2021). |
These can be reinvested relatively quickly into instruments of higher rates. The rate of return on Admiral’s investment portfolio has fallen from 1.4% in 2016 to 1.1% in 2021, and should now start to recover. Yields on short-dated U.K. Gilts have risen by approx. 2 ppt in the past year, and is now at 2% even for 1-year Gilts:
|
U.K. Gilt Yield Curve (Current vs. Prior Year) 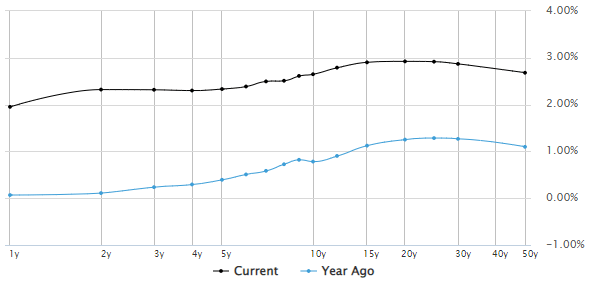 Source: Marketwatch (22-Jun-22). |
However, the benefit to Investment Income will be small relative to the group, as Investment Income was just £42.6m in 2021 (compared to group PBT of £713.5m).
Higher interest rates should also benefit Admiral’s Instalment Income, the excess that customers pay to have their premiums being charged monthly instead of annually. Instalment Income totaled £105.4m for the group in 2021, so any increase could be meaningful, but this would be felt more acutely by customers and is thus less certain to happen.
Valuation: Admiral’s 6.7% Dividend Yield
With shares at 2,103p, relative to 2019 financials (continuing operations), Admiral is trading at a 14.1x P/E and a 6.7% Dividend Yield:
|
Admiral Earnings & Valuation (2019-21) 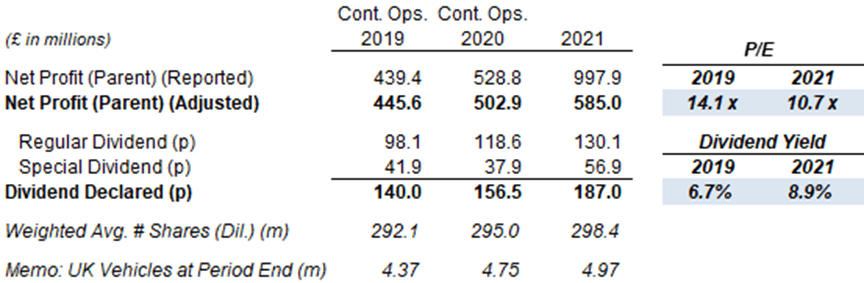 Source: Admiral company filings. |
We believe 2019 financials are more representative than 2021 ones, as the latter’s Net Profit benefited from COVID-19 and its dividend was partly funded by proceeds from the Price Comparison Website (“PCW”) disposal. However, Admiral’s U.K. Motor business has grown 12% (by the number of vehicles) since 2019.
Admiral targets paying out 65% of its EPS as regular dividends, and has also paid special dividends every year. Including special dividends, the Payout Ratio has been near 90% in recent years. 2022 will also see the final of three 46.0p additional special dividends that were funded by the PCW disposal.
Illustrative Return Forecasts
We keep the assumptions in our forecasts unchanged:.
We reduce our 2022 forecasts to reflect lower U.K. Motor premium prices and lower results in non-U.K. insurance. We now assume:
- 2022 Net Profit of £437m, 26% lower year-on-year and 2% lower than 2019
- From 2023, Net Profit to grow at 8% annually
- Share count to grow at 1% annually
- Dividends to generally be 90% of EPS
- For 2022, the third 46p dividend from the PCW sale will also be paid
- Exit P/E of 20.0x, implying a 4.5% Dividend Yield
Our 2025 EPS forecast is unchanged at 177.2p:
|
Illustrative Admiral Return Forecasts  Source: Librarian Capital estimates. |
With shares at 2,103p, we expect an exit price of 3,544p and a total return of 97% (23.0% annualised) by 2025 year-end.
Conclusion
Admiral shares have fallen 43% from their peak to their lowest since March 2020, with a 14.1x P/E and a 6.7% Dividend Yield.
The pricing cycle in U.K. motor insurance has started to turn, albeit unevenly and with price increases lagging claim cost inflation.
We expect price increases to accelerate and benefit Admiral. In the meantime, competitors have flat or declining market shares.
Earnings should be resilient against recessions and inflation, and higher interest rates will benefit Admiral’s Investment Income.
With shares at 2,103p, we expect an exit price of 3,544p and a total return of 97% (23.0% annualised) by 2025 year-end.
We reiterate our Buy rating on Admiral Group PLC stock.
Be the first to comment