

Artur Plawgo
Investment Summary
Despite the broad-market selloff in FY22′ there was a pocketful of names that continued to offer outsized return for equity investors. Case in point is ADMA Biologics, Inc. (NASDAQ:ADMA), that caught a strong bid across the entire 2022 period, in spite of the turbulence in the broad indices. You can see below that from its October 2021 low, ADMA has rallied off a $1.00 base to its current mark, more than 240% upside during that time [Exhibit 1]. The question now turns to whether the rally can extend further, or not. The immediate answer to this lies in the companies upcoming FY22′ earnings, to be presented in early March. In lieu of then, we’ve identified that investors are still bullish on the stock, and this gives good credence to further upside in the meantime. Net-net, we rate ADMA a buy.
Exhibit 1. ADMA 24-month price evolution, rallying off October 2021 lows to current mark.
Data: Updata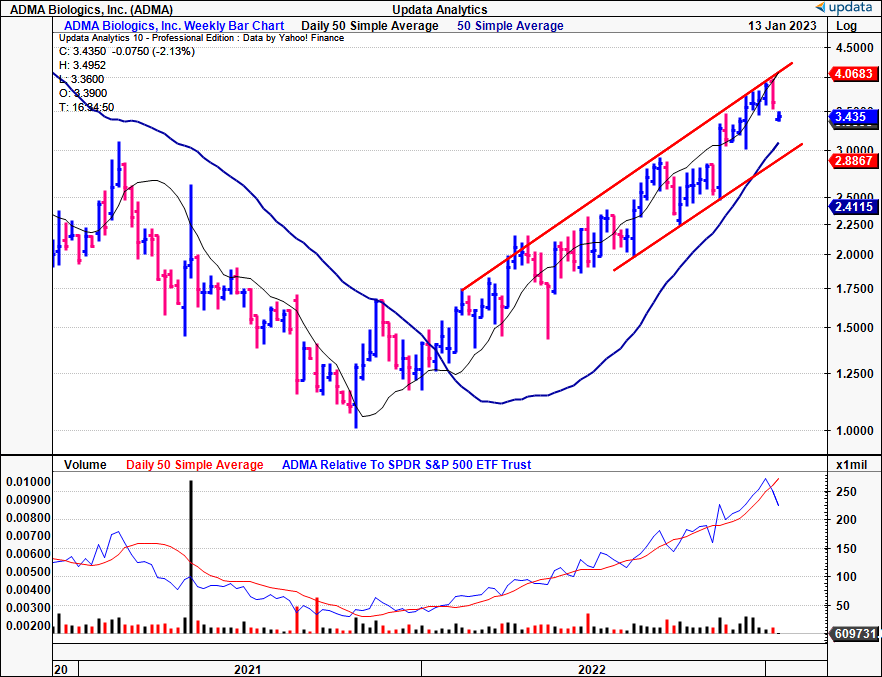
ADMA fundamentals overview
ADMA reported revenues of $41.1 million in Q3 FY22′, a YoY growth schedule of 99% on core EBITDA of negative $7.5mm. The growth was underscored by upsides in the company’s intravenous immune globulin (“IVIG”) portfolio, consisting of BIVIGAM and ASCENIV. As a reminder, ASCENIV, is an immune globulin liquid for intravenous injection, and is indicated for treating primary humoral immunodeficiency (“PI”) in adults, and adolescents aged 12-17. BIVIGAM – also an immune globulin liquid for intravenous injection – is indicated for the treatment of PI as well.
The market for PI diseases is expected to reach $10.2Bn by FY29′, growing at CAGR 6.5% into that period. Contrary evidence points to a 7.73% CAGR into FY26′, after being valued at $3.3Bn in FY21′. As to major players, ADMA is up against some fairly hefty competition, the likes of Baxter (BAX), Takeda Pharmaceuticals (TAK), and Australian biotech giant CSL Ltd (OTCPK:CSLLY). With respect to the distribution of growth, research suggests the highest growth is expected in the APAC and ME regions, followed by Europe and the U.S.
I’d also suggest it’s fairly important to have a background on PI to understand the true investment opportunity here. PI encompasses a heterogeneous group of disorders characterized by intrinsic defects in the production of one or more classes of immunoglobulins. This sequence results in recurrent infections and other immune-related complications. Basically, these patients have a compromised immune system. The pathogenesis of PI is primarily the result of impaired antibody production, due to mutations in genes that control the development and function of B-cells and T-cells. The resulting defects in B-cell development and function lead to a deficiency in one or more classes of immunoglobulins, including IgA, IgG, IgM, and IgE.
The pathophysiology of PI is characterized by recurrent infections caused by the inability to produce sufficient levels of antibodies to fight off invading microorganisms. Further downstream, recurrent infections can lead to more serious long-term complications such as bronchiectasis, chronic otitis media, and sinusitis. Most seriously, however, is that PI can also lead to other autoimmune problems and an increased risk of neoplasm [cancer]. As such, PI also dovetails across numerous conditions such as congenital and X-linked agammaglobulinemia, common variable immunodeficiency (“CVID”), Wiskott-Aldrich syndrome (“WAS”) and severe combined immunodeficiencies (“SCID”).
Switching back to ADMA’s numbers, and looking at the marginal analysis, the first point we’d make is that ASCENIV contributes a gross margin of ~80%-85% as a function of turnover. At the same time, it’s worth noting that the bolus of BIVIGAM revenue during the third quarter was generated from previous 2,200 litre scale production. This scale level, while still profitable, generates a lower contribution margin in comparison to the 4,400 litre scale process [the latter was approved by the FDA in April FY21′ after ADMA had begun producing at the 2,200 litre scale]. However, since the latter half of FY21′, ADMA has been producing BIVIGAM using the 4,400 litre scale.
Here we’d note, that, as a potential tailwind, as ADMA disposes of the remaining lower margin BIVIGAM inventory [that which is produced at the 2,200 litre scale, which have a manufacturing timeline of ~6-12 months], gross margins are expected to improve to the 20%-30% range when shifting to the 4,400 batch production scale. We’d look to this number as a benchmark of performance for the company, seeing the $9.7mm in gross profit in Q3 at a 23.6% margin.
It brought this down to a net loss of ~$15mm, an improvement from negative $17.7mm the year prior. Despite the fact that management raised FY22′ revenue guidance to $145mm [the 2nd upgrade for the year], ADMA still raised an additional $60mm in equity capital after issuing ~21mm new shares outstanding at $2.86 each in December. This hasn’t changed the consensus view looking ahead, with a steep revenue ramp projected into FY24′, as seen below. For reference, it had $35mm in cash at the exit of Q3 FY22′, and this obviously wasn’t sufficient runway to fulfil its growth initiatives. According to the announcement, ADMA intends “to use the net proceeds from this offering to accelerate commercialization and production activities, complete plasma center buildout and obtain FDA approvals, to conclude post FDA marketing approval research and development projects, and for working capital, capital expenditures and for general corporate purposes.”
ADMA consensus estimates project steep revenue ramp into FY24′.
Data: Seeking Alpha, ADMA, see: “Revenue”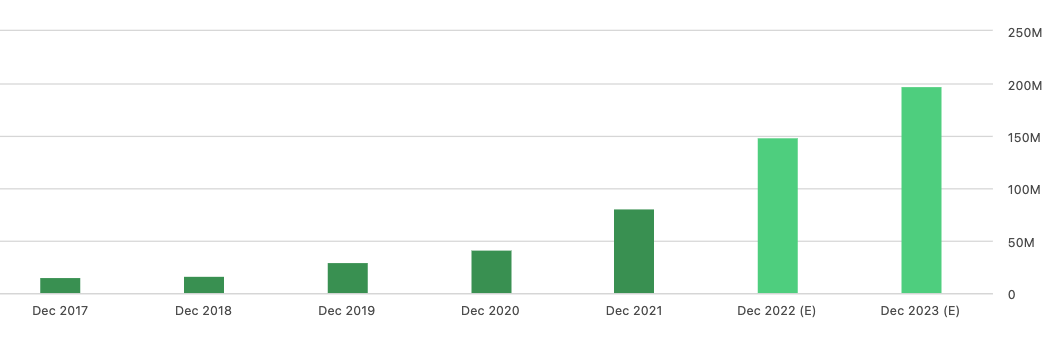
ADMA market data to guide price visibility
We wanted to gauge a little more on the next phases of ADMA’s price evolution. Without the profitability or earnings growth to go by, having insight into how the market is positioning in the stock is integral to understanding this.
You’ll see in Exhibit 2 that money flows into ADMA equity has been tremendously high over the past 12-months to date. In fact, the brief periods of net outflows have been terrific entry or reallocation points, as shown.
After a short stint of net outflows over the past week or so, we’d note this could be another point of entry, or to potentially reallocate on the weakness if already long.
Exhibit 2. Daily inflows/outflows into ADMA equity, demonstrating adequate buying points with each period of outflow/share price weakness along the testing period.
Data: Updata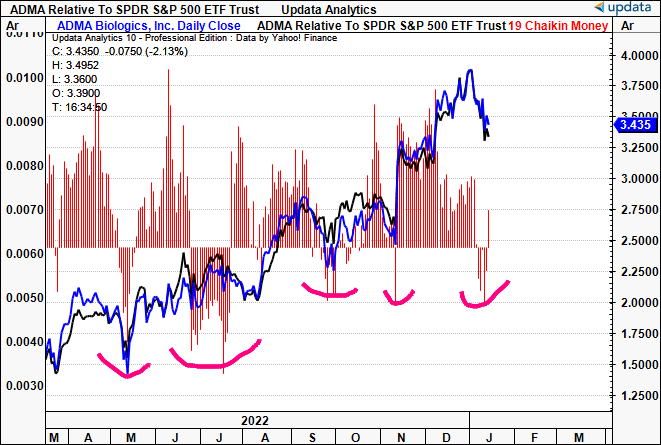
Presuming the stock did bottom in October 2021, then it’s been a tremendous 12-18 months for ADMA. On this, we feel it’s prudent to trace the Fibonacci channel down from its September 2019 highs, where ADMA has a real chance of breaking at its current pace. Tracing the fibs down from this level to the 2021 lows, we see that ADMA has reclaimed exactly 78% of the downside, riding the 50DMA all the way to its current mark. From this, the next target is $5.45, or 100% of the down-leg, and then $15.50 [not shown], or a 168% recovery.
Exhibit 3. Reclaiming 78% of September 2019 – October 2021 drawdown, next target $5.45
Data: Updata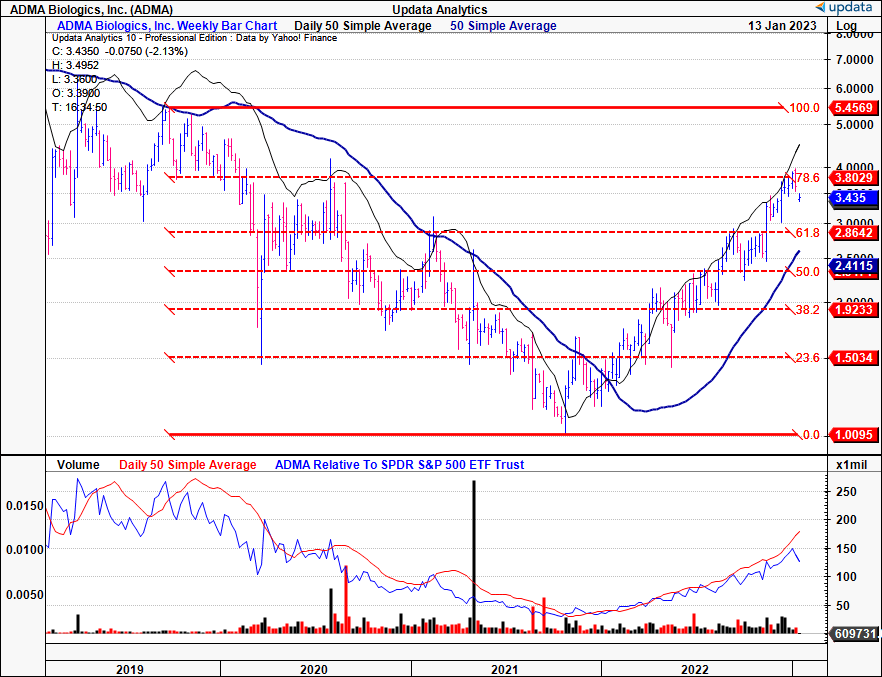
With that, we have the next upside targets to $4.52 then $4.95, although a downside target of $2.82 should also be factored in. This tells us that another pullback could be warranted, potentially opening up another entry point. Based on these market studies, we are seeking price objectives of $4.25, $4.95, and then $5.45 looking ahead. Should it break these levels, we’d be looking at the stock rallying towards its all-time highs of ~$15.
Exhibit 4. Upside targets to $4.25, $4.95
Data: Updata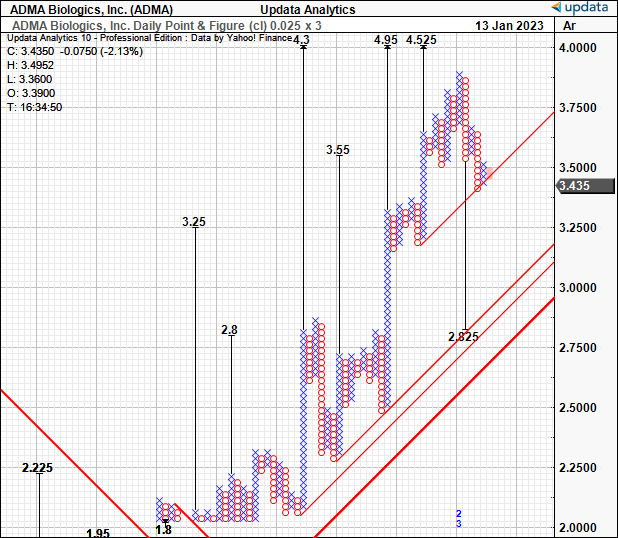
In short
Based on the available evidence, there’s scope for ADMA to re-rate further to the upside in our estimation. Investor positioning remains bullish, and the company’s most recent numbers demonstrate a decent revenue ramp looking ahead. On this, ADMA’s full-year numbers are an essential piece to the puzzle here. The company needs to hit its targets in order to catch a further bid, and so, come March, when the company reports, we’d advise investors to be carefully watching this. In that respect, should the company miss its numbers, this presents as a major downside risk in the near-term. We are also looking at its gross margin into FY22′ earnings, following its new scaling at the 4,400 litre level for BIVIGAM. Net-net, we rate ADMA a buy, looking for price objectives of $4.25, $4.95, and then $5.45.
Editor’s Note: This article discusses one or more securities that do not trade on a major U.S. exchange. Please be aware of the risks associated with these stocks.
Be the first to comment