

JHVEPhoto
Accenture plc (NYSE:ACN) is a powerhouse in helping other businesses improve efficiencies and profitability. They primarily operate through IT consulting and outsourcing by offering their suites of IT solutions that make other businesses better.
Accenture has an impressive track record of continuing to provide solutions for their clients as evidenced by 98 of their top 100 clients having a relationship greater than 10 years.
Their client relationships are forged and strengthened during tough times for the customer businesses. As a go-to solutions provider of consulting, strategy, and IT solutions Accenture is poised to benefit as more companies look to “digitize” and look for opportunities to be more efficient in their own operations.
ACN Investor Conference Slides Apr 2022 Market Share (ACN Investor Conference Slides Apr 2022)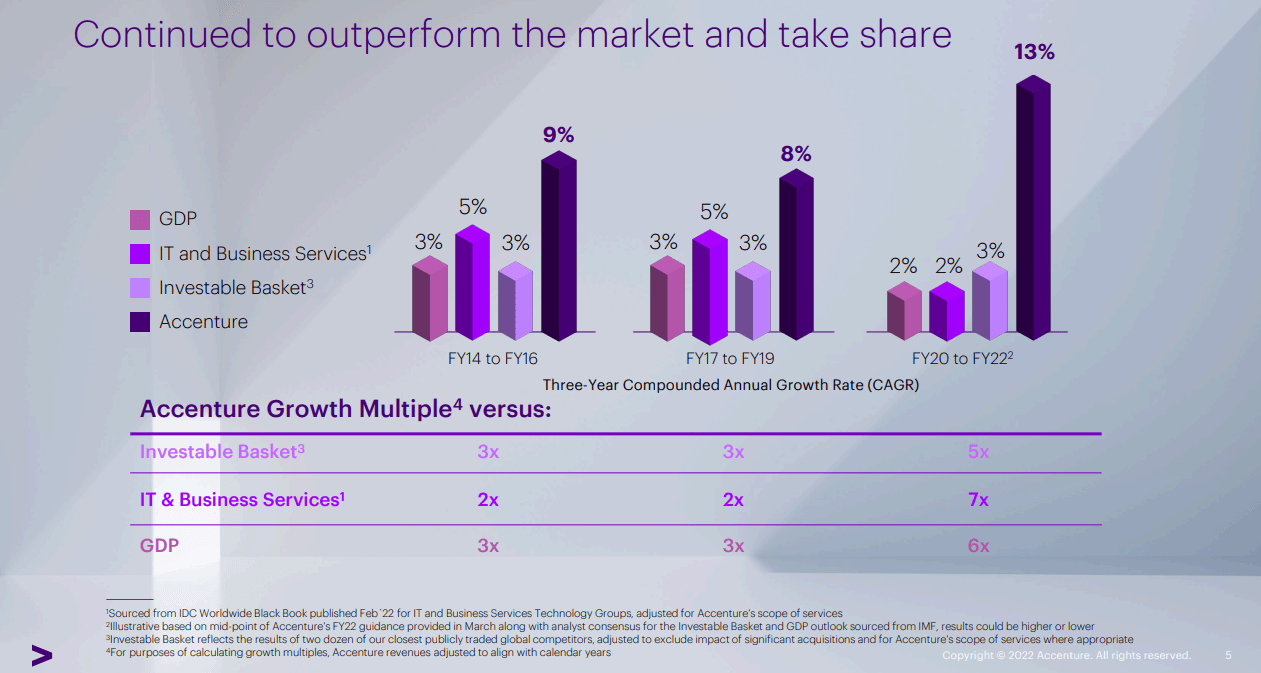
According to Accenture’s investor conference slides from April, Accenture has continued to show strong growth compared to GDP, the IT and Business Services group, as well as an Investable basket consisting of two dozen of their publicly traded peers.
Accenture’s solutions spread into just about every sector of the economy from utilities, life sciences, industrials, insurance, healthcare, banking and capital markets, consumer goods, and much more.
Accenture does run a very acquisition-heavy business model with 34 completed in FY 2020, 46 in FY 2021, and 21 through the first half of FY 2022. That introduces its own risk primarily through integration issues; however, Accenture is more of a solutions acquirer that consolidates offerings that clients would need and in turn provides better services and improves the relationships. As a one-stop shop for consulting or IT, it’s much easier and attractive for clients, and potential clients, to choose Accenture as they don’t have to additionally deal with integration issues between the services of two different companies.
Dividend History
There’s nothing quite like a rising dividend to give investors the confidence that a business and management team is continuing to execute. That’s why the dividend growth strategy is the one that I gravitated toward when I first began investing in individual companies.
Accenture Dividend History (Accenture Investor Relations)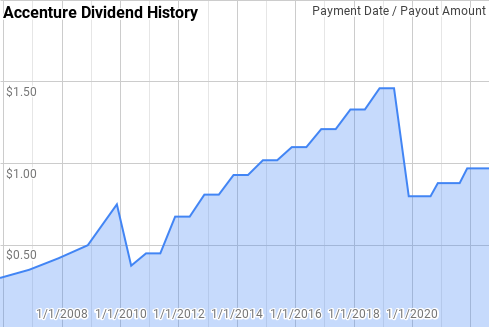
While Accenture appears to have dividend cuts in its recent past that’s really just changes from annual payments, to semi-annual payments, and then eventually to quarterly payments. Accenture is now a Dividend Contender with 17 consecutive years of dividend growth.
Since 2006 Accenture’s year-over-year dividend growth has ranged from 7.8% to 50.0% with an average of 18.0% and a median of 12.5%.
There’s been 12 rolling 5-year periods over that time with annualized dividend growth spanning 9.4% to 31.0% with an average of 18.3% and a median of 16.0%.
During that same period there’s been 7 rolling 10-year periods with Accenture’s annualized dividend growth coming in between 11.1% and 22.0% with an average of 17.8% and a median of 19.3%.
The rolling 1-, 3-, 5-, and 10-year annualized dividend growth rates from Accenture since 2006 can be found in the following table.
| FY | Annual Dividend | 1 Year | 3 Year | 5 Year | 10 Year |
| 2006 | $0.300 | ||||
| 2007 | $0.350 | 16.67% | |||
| 2008 | $0.420 | 20.00% | |||
| 2009 | $0.500 | 19.05% | 18.56% | ||
| 2010 | $0.750 | 50.00% | 28.92% | ||
| 2011 | $0.900 | 20.00% | 28.92% | 24.57% | |
| 2012 | $1.350 | 50.00% | 39.25% | 30.99% | |
| 2013 | $1.620 | 20.00% | 29.27% | 30.99% | |
| 2014 | $1.860 | 14.81% | 27.38% | 30.05% | |
| 2015 | $2.040 | 9.68% | 14.75% | 22.16% | |
| 2016 | $2.200 | 7.84% | 10.74% | 19.57% | 22.05% |
| 2017 | $2.420 | 10.00% | 9.17% | 12.38% | 21.33% |
| 2018 | $2.660 | 9.92% | 9.25% | 10.43% | 20.27% |
| 2019 | $2.920 | 9.77% | 9.90% | 9.44% | 19.30% |
| 2020 | $3.200 | 9.59% | 9.76% | 9.42% | 15.61% |
| 2021 | $3.520 | 10.00% | 9.79% | 9.86% | 14.61% |
| 2022 | $3.880 | 10.23% | 9.94% | 9.90% | 11.13% |
For dividend growth investors the payout ratio is one of the most important variables to monitor because it can give you a lot of information. All else being equal I prefer a lower payout ratio rather than a higher one as it allows more cushion for the inevitable business downturns without jeopardizing the dividend. Additionally, a stable payout ratio means that dividends have been growing in line with earnings or free cash flow growth, whereas a rising payout ratio means that dividends have been outgrowing underlying business performance.
That’s not necessarily a bad thing as the business could have undergone a change where they can now afford to pay out a higher percentage to owners, and in turn retain less for reinvestment. Or the business could have become more stable over time allowing a higher payout ratio to be considered more sustainable.
ACN Dividend Payout Ratios (ACN SEC filings)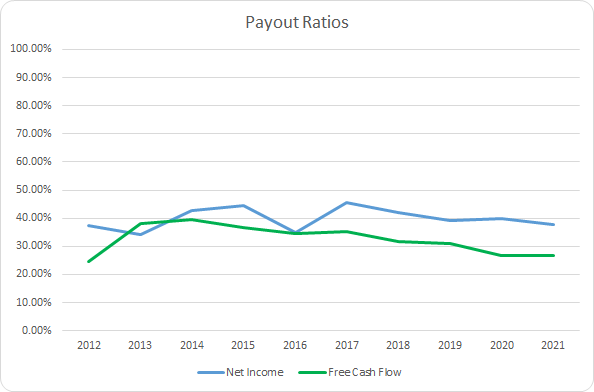
Accenture’s dividend payout ratios have been very steady over the years meaning that the strong dividend growth has occurred in conjunction with strong underlying business results.
The 10-year average net income payout ratio for Accenture is 39.8% with the 5-year average at 40.9%. Accordingly the average free cash flow payout ratios are 32.5% and 30.2%, respectively.
Quantitative Quality
When implementing the dividend growth strategy with an intent to own, not rent, the shares, the aim is to find businesses that you can sleep well at night while holding. High quality businesses will prove it through their financials over time.
ACN Revenue Profits and Cash Flow (ACN SEC filings)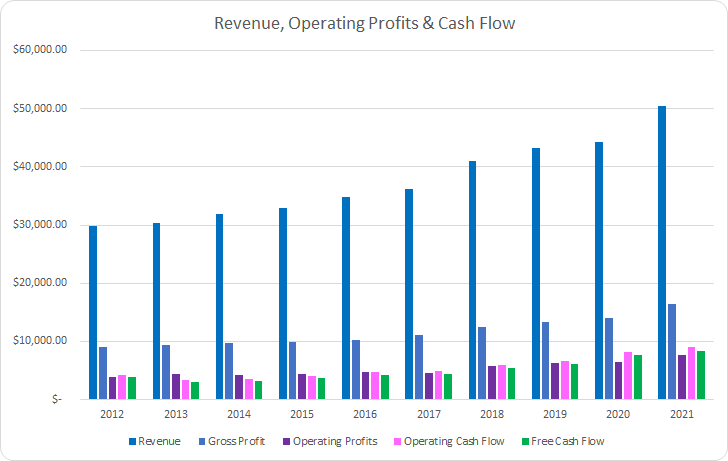
Over the last decade Accenture had a remarkable run showing revenue growth each and every year including during the disruption caused by the pandemic. During that time revenues grew by 69.7% in total or ~6.1% annualized through a combination of organic as well as acquired growth.
Gross profits improved by 82.1% or 6.9% annually with operating profits climbing 96.8% or 7.8% annually. Operating cash flow improved by 110.8% or 8.6% annualized and most importantly free cash flow increased 116.1% or 8.9% annually.
Additionally I track how well a business is able to generate profits or cash flow from its revenues by examining the margin structure. My expectation is that good business should be able to maintain or improve margins over time. I prefer to see free cash flow margins surpass 10% over time.
ACN Margins (ACN SEC filings)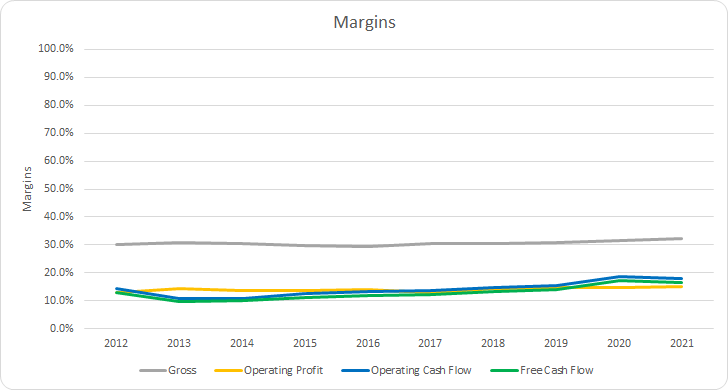
Accenture has maintained stable gross margins during the last decade. The 10-year average gross margin comes to 30.7% with the 5-year average at 31.2%.
Accenture hasn’t quite met the 10% free cash flow margin requirement; however, they only failed to reach that mark in two years that both came up very shy of the mark. The 10-year average free cash flow margin is 12.9% with the 5-year average coming to 14.7%.
I also want to see the prospective investment be efficient at using its assets or capital base in order to generate free cash flow. The primary measure that I use is the free cash flow return on invested capital, FCF ROIC. Similar to the free cash flow margin I expect to see stable or rising levels over time that preferably are well in excess of 10%.
ACN Free Cash Flow Returns (ACN SEC filings)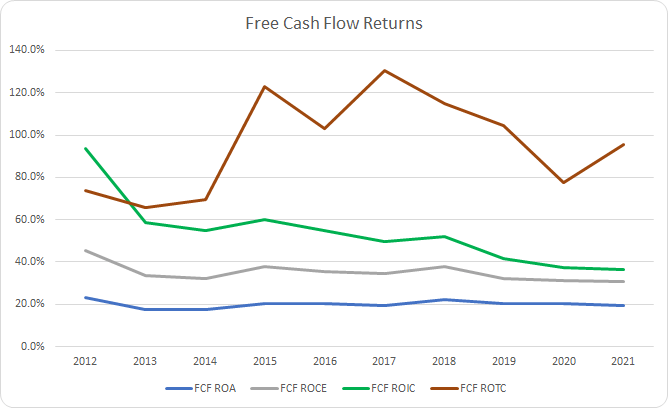
Despite lower free cash flow margins that one would expect, Accenture is very efficient at generating free cash flow from its assets. Accenture’s FCF ROA is routinely around the 20% level with a 10-year average of 20.1% and a 5-year average of 20.4%.
Similarly, Accenture maintains strong FCF returns on capital employed with a 10-year average of 35.2% and a 5-year average of 33.3%. As expected, Accenture carries very impressive FCF ROIC’s, although they have been falling over time, with a 10-year average of 54.0% and a 5-year average of 43.4%.
Since Accenture has completed various M&A activity I also measure the FCF return on tangible capital which helps to strip out the goodwill effects from the M&A and tries to narrow down the returns the business is generating on the capital used to actually run the business. Once again we see very strong FCF returns for Accenture with a 10-year average ROTC of 95.8% and a 5-year average of 104.6%.
All signs point to Accenture being a very capital efficient business.
To understand how Accenture uses its free cash flow I calculate three variations of the metric, defined below:
- Free Cash Flow, FCF: Operating cash flow less capital expenditures
- Free Cash Flow after Dividend, FCFaD: FCF less total cash dividend payments
- Free Cash Flow after Dividend and Buybacks, FCFaDB: FCFaD less net cash spent on share repurchases
ACN Free Cash Flows (ACN SEC filings)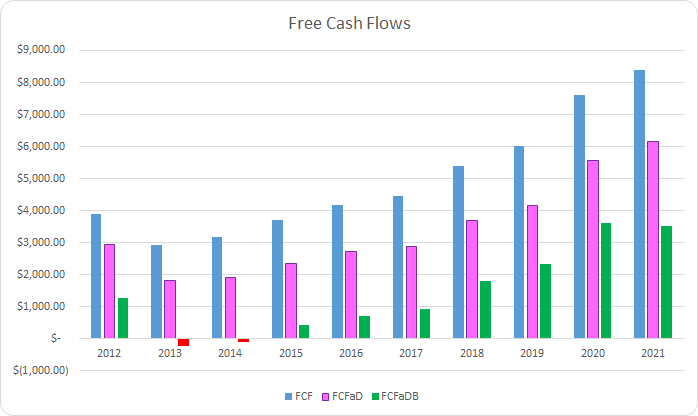
During the last decade Accenture has generated a total of $49.8 B in FCF through their business. Over that time they have paid out $15.5 B via dividends to shareholders which brings the cumulative FCFaD to $34.2 B. Additionally, Accenture used a net total of $19.9 B on share repurchases. That puts the cumulative FCFaDB for the last decade at $14.3 B.
I would prefer to see more companies and management teams utilize special dividends or a higher baseline dividend rather than share repurchases. The reason being that too often businesses ramp up share repurchases during the good times for the business just to reduce buybacks or even issue shares during the tough times.
ACN Shares Outstanding (ACN SEC filings)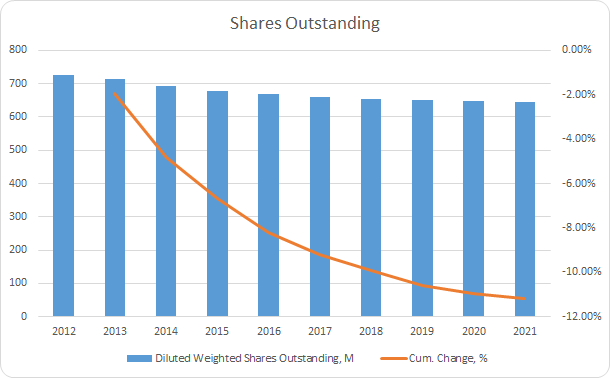
Between FY 2012 and FY 2021 Accenture used sent roughly $0.78 via dividends for every $1.00 net used on share repurchases.
In total Accenture’s shares outstanding have declined by 11.2% which works out to roughly a 1.3% annualized decline over the last decade. Buybacks, as a percentage, have been on the decline and FY 2021 saw the lowest year over year change at just 0.3%.
With a long-term investment in mind I want to make sure that the debt levels appear reasonable for the business and that there is not excessive leverage on the balance sheet.
ACN Debt to Capitalization (ACN SEC filings)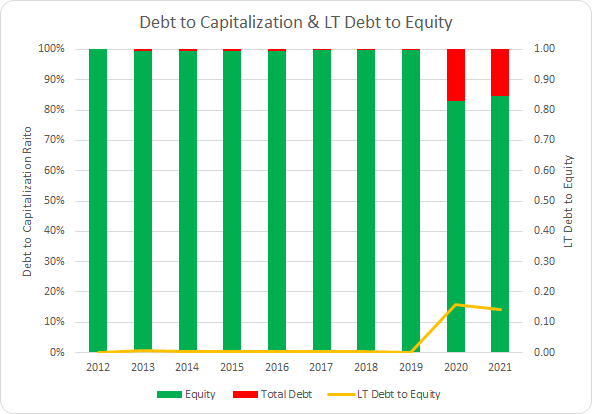
Accenture has largely withstood the draw of low interest rates over the last 10+ years and carries very minimal debt on their balance sheet. The 10-year average debt-to-capitalization ratio works out to just 3% with the 5-year average at 7%. Additionally, Accenture has carried more cash and equivalents on the books versus total debt each year between FY 2012 and FY 2021. With their net cash position, Accenture’s balance sheet poses no risk at this time.
How Did We Get Here?
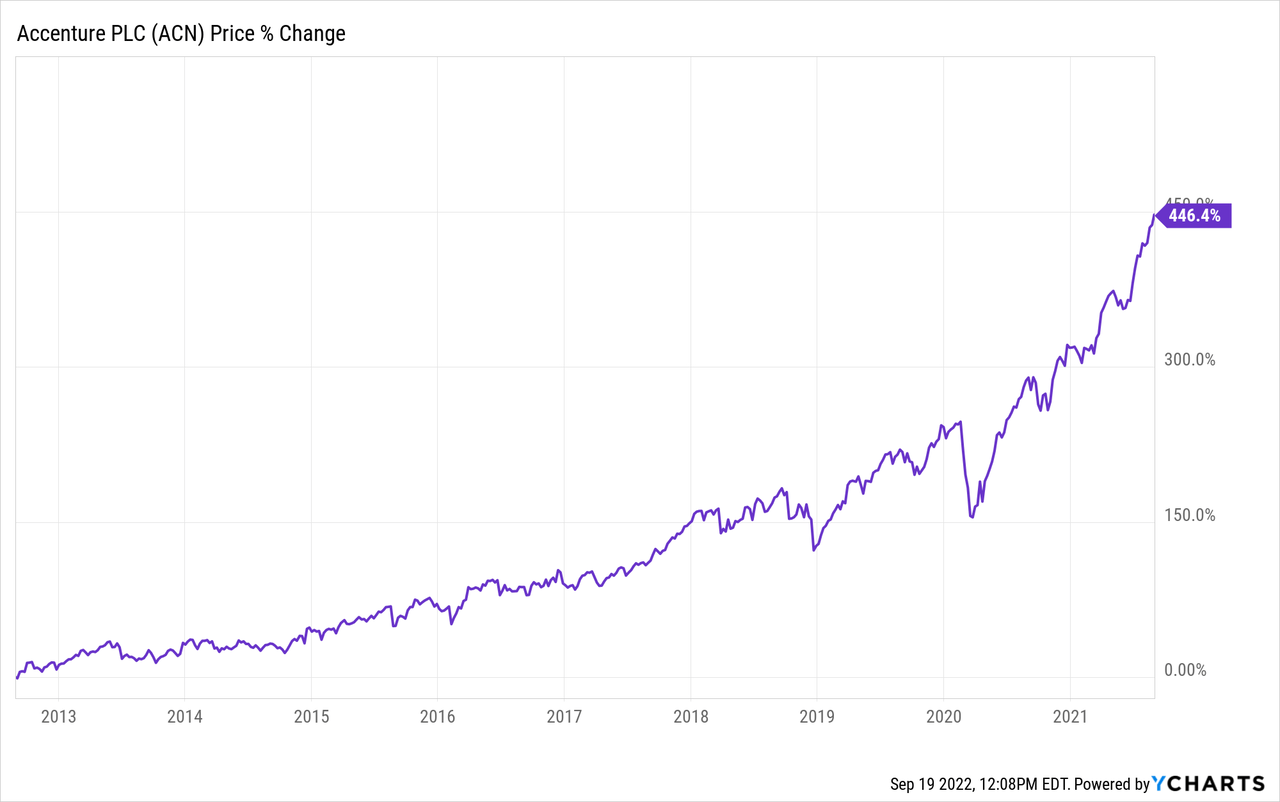
Accenture has rewarded investors over the last decade with very strong returns. Between August 31, 2012 and August 31, 2021 the share price increased from $61.60 to $336.56. That works out to a 446.4% increase. Including the 2.2% dividend yield at the start and the CAGR was roughly 20.7% during that time.
Of course, just because the share price has risen doesn’t mean that all of the returns have been justified as market participants could be valuing the business quite richly. As such I’ve tried to breakdown the returns into 3 components:
- Business Returns: Measured by revenue growth and change in net profit margin
- Capital Allocation Returns: Measured by dividend yield and share repurchases
- Sentiment Returns: Measured by the change in starting and ending P/E multiple
Accenture’s revenue grew by 69.7% in total over that time which accounts for 6.0% of the annualized return. Meanwhile the net profit margin rose from 8.6% to 11.7% representing a total increase of 36.3% and a +3.5% return attribution. That brings the total business justified returns to 9.5% annualized.
For the capital allocation returns the starting dividend yield was 2.2%. As we saw earlier the share count has fallen by 11.2% which works out to a +1.3% return attribution. That gives a total capital allocation attribution of +3.5% annualized.
Additionally, the P/E multiple was 17.5x as the beginning of the period (measured by share price on 8/31/12 vs FY 2012 EPS) and ended at 36.8x (measured by share price on 8/31/21 vs FY 2021 EPS). That’s a total increase of 109.7% or a +7.7% return attribution due to sentiment change.
| Annualized Returns | % of Returns | |
| Business Returns | 9.5% | 46% |
| Capital Allocation Returns | 3.5% | 17% |
| Sentiment Change | 7.7% | 37% |
| Total Annualized Returns | 20.7% |
Source: Author
All told the business returns and capital allocation returns accounted for a 13.0% annualized return or roughly 63% of the returns achieved over that time. The remaining 37% of return came from a positive change in investor sentiment.
ACN Return Attribution Breakdown (ACN SEC filings)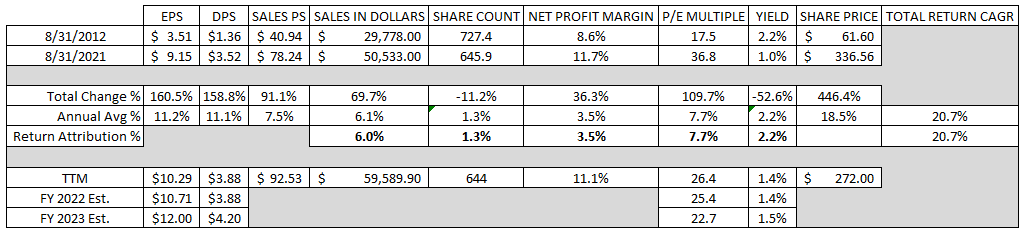
Valuation
Identifying a strong business is just part of the investment challenge. The other is purchasing it at a reasonable value and having the patience to wait for the opportunity. I utilize three valuation methods to try and narrow down a fair value range including dividend yield theory, a reverse discounted cash flow analysis, and a minimum acceptable rate of return, “MARR”, analysis.
Dividend yield theory is a valuation method based on the idea that investors, collectively, will value a business such that it offers roughly the same dividend yield over time. I use the 3-year average forward dividend yield for Accenture as a proxy for fair value.
Accenture Dividend Yield Theory (ACN Investor Relations and Google Finance)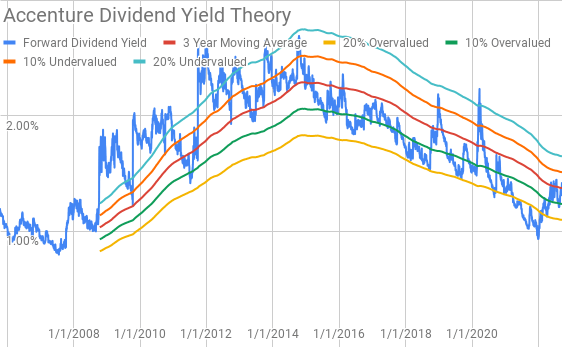
Since initiating a dividend in 2006, Accenture has typically offered a forward yield between 1.0% and 2.5%. At a share price around $272 Accenture shares offer a forward dividend yield of 1.43% compared to the 3-year average forward yield of 1.37%.
A reverse discounted cash flow analysis can be used to decode what kind of growth and margins a business must deliver in order to generate the free cash flows that are necessary to support the current market valuation.
I use a simplified DCF model based on revenue growth, an initial free cash flow margin of 12.5% that increases to 16% during the forecast period, and a terminal growth rate of 3.0%. For the discount rate to apply to those cash flows I’ve used an after tax cost of debt of 3.06% in conjunction with a 10% and 8% cost of equity. Based on those values that yields a 9.9% discount rate and a 7.9% discount rate.
With the current share price near $272 and the 10% cost of equity/9.9% discount rate, Accenture needs to grow revenues around 6.4% annually through the forecast period in order to generate the free cash flows that would support the current share price. At an 8% cost of equity/9.9% discount rate the required revenue growth drops to just 1.1% annually over that time.
A minimum acceptable rate of return, “MARR”, analysis requires you to estimate the future earnings and dividends that a business will generate over a given timeframe. You then determine a reasonable, and conservative, terminal multiple for those future earnings to come up with a potential future share price. If the expected return is greater than your minimum threshold in order to invest then you can proceed with the investment.
Analysts expect Accenture to report FY 2022 EPS of $10.71 and FY 2023 EPS of $12.00. They also expect Accenture to be able to grow EPS 8.5% annualized for the next 5 years. I then assumed that EPS growth would slow to 5.0% annually for the following 5 years. Dividends are assumed to target a 35% payout ratio.
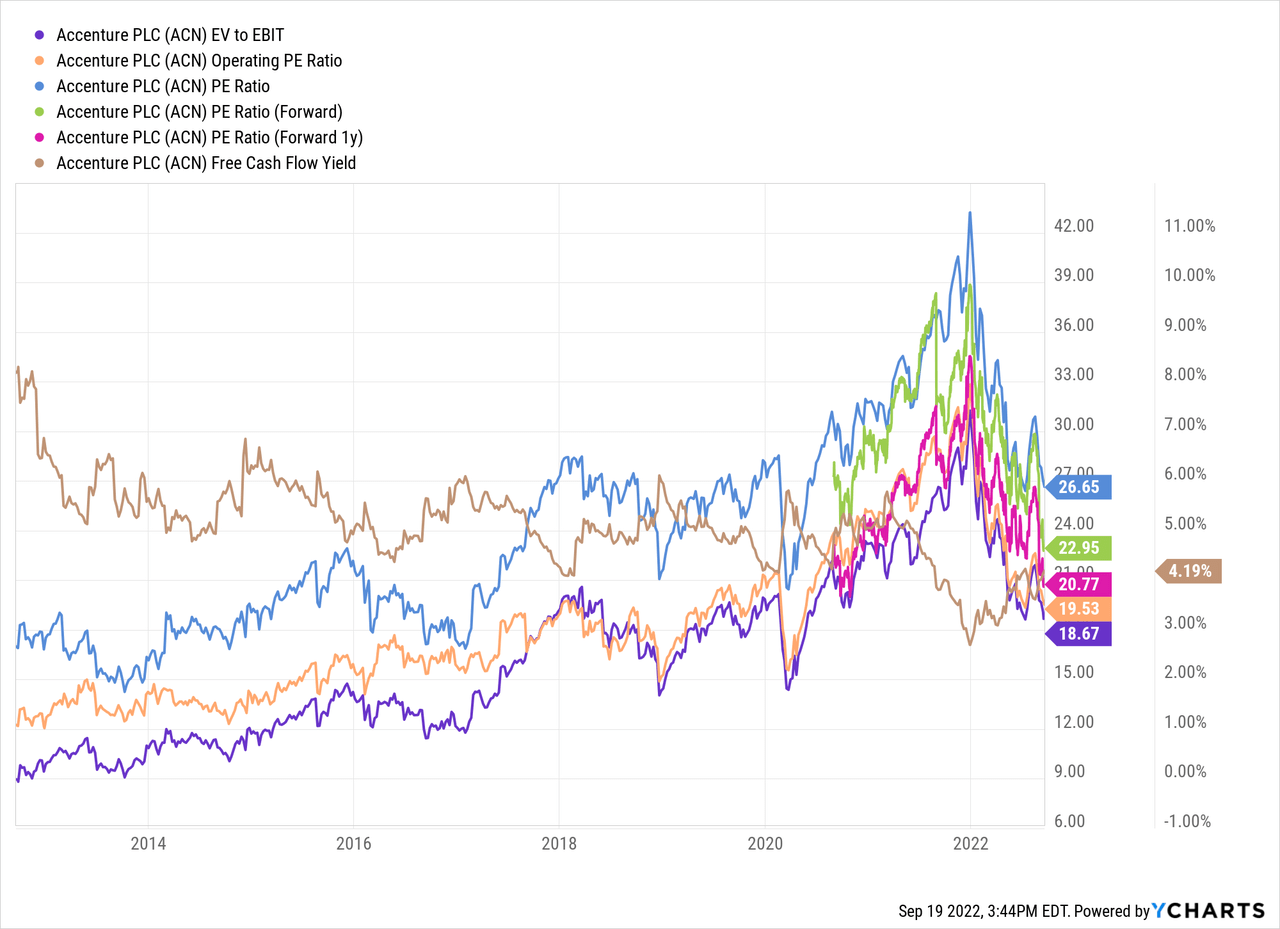
To determine a range of terminal multiples for use in the MARR analysis I like to see how market participants have typically valued Accenture over time. During the last 10 years Accenture has usually been valued between ~15x and ~30x TTM EPS.
The following table shows the potential internal rates of return that investors could earn from Accenture if the assumptions laid out above prove to be reasonable forecasts of how the future plays accounts. Returns assume that shares are purchased at $272, intraday pricing from Monday, with dividends taken in cash as well as paid and increased on the timeline that Accenture has followed.
| IRR | ||
| P/E Level | 5 Year | 10 Year |
| 30 | 13.0% | 9.8% |
| 25 | 9.3% | 8.0% |
| 22.5 | 7.3% | 7.0% |
| 20 | 5.0% | 5.9% |
| 17.5 | 2.5% | 4.6% |
| 15 | -0.3% | 3.2% |
Source: Author
Alternatively, I’ve taken the MARR analysis growth estimates and reversed the process to determine the maximum that I could purchase shares at today in order to generate the returns that I desire from my investments. My standard hurdle rate is a 10% IRR and for Accenture I’ll also examine 12% and 8% return targets.
| Purchase Price Targets | ||||||
| 10% Return Target | 12% Return Target | 8% Return Target | ||||
| P/E Level | 5 Year | 10 Year | 5 Year | 10 Year | 5 Year | 10 Year |
| 30 | $314 | $269 | $287 | $227 | $345 | $320 |
| 25 | $265 | $230 | $242 | $194 | $291 | $273 |
| 22.5 | $241 | $210 | $220 | $178 | $264 | $250 |
| 20 | $216 | $191 | $198 | $162 | $237 | $226 |
| 17.5 | $192 | $172 | $175 | $146 | $210 | $203 |
| 15 | $167 | $152 | $153 | $130 | $183 | $180 |
Source: Author
Conclusion
Accenture is a business that I’ve had my eye on for years, but it always seemed expensive just as most great businesses do. Accenture has proven its ability to continue to grow revenues at a solid pace coming in at 6.1% annualized over the last decade. Accenture carries strong FCF margins that routinely land between 10% and 15% with FCF ROICs greater than 40%.
Dividend yield theory suggests a fair value range between $257 and $313. With a dividend increase likely to be announced any day now, which I expect a raise to $1.05 per share per quarter, the fair value range rises to $278 to $339.
The reverse DCF analysis suggest that 8% returns require very modest growth over the coming decade and 10% returns appear quite achievable as well with required growth of just 6.4% annually through FY 2031. One thing to note is that the reverse DCF does not account for share repurchases which are likely to continue and should be more effective as the valuation has come down since late 2021.
The MARR analysis suggests a fair value range between $216 and $265 based on a 20x to 25x terminal multiple 5 years out with a 10% return threshold. Reducing the return target to 8% raises the fair value range to between $237 and $291.
One concern regarding Accenture is the ever-necessary M&A that Accenture undergoes to maintain and expand their suite of solutions for clients. Accenture’s ROICs have suffered over that time despite rising margins suggesting that the returns on the M&A has likely been done at rich valuations.
A back of the envelope calculation for the ROIIC for Accenture based on the prior 10 years reinvestment rate and a ROIIC estimate puts the compounding rate for Accenture in the 8-9% range depending on whether one looks at net income or free cash flow.
Accenture’s big point of strength is their strong balance sheet. With a net cash balance sheet they face what is effectively no risk from the recent rising interest rates in terms of solvency. The strong balance sheet also gives them opportunities to continue with M&A over any general economic weakness or recession.
Additionally, Accenture should be able to capitalize from a competitive positioning standpoint should a recession occur. While their business is likely to pullback in the intermediate term as their clients pare spending, I expect the business will be stronger for it on the other side as the relationships that are built and strengthened during those tough times lead to more spend from clients was spending returns.
Some recent evidence of that played out with the pandemic and ensuing recovery. Accenture showed modest revenue growth for FY 2020 compared to FY 2019 at just 2.6%; however, FY 2021 versus FY 2020 showed a huge ramp in client spend with Accenture’s revenues rising 14.0%.
In my opinion Accenture is still on the expensive side given the macro headwinds; although I believe it’s back in the range of reasonable for those looking to build out a long-term position. Two of the three valuation methods show that Accenture is likely within the range of fair value while the third suggests that Accenture is probably still overvalued by roughly 10%. That’s despite the share price being cut by 1/3 since the late 2021 high.
Be the first to comment